A Work Project presented in the context of a Directed Research Internship at the Research and Economic Policy unit of the Office for Economic Policy and International Affairs of the Portuguese Ministry of Finance, as part of the requirements for the Award of a Master Degree
in Economics from the NOVA – School of Business and Economics.
Sectoral Productivity and Employment: The Impact of
Product and Labour Market Reforms
Hugo Maria Sousa dos Santos Correia 782
A Project carried out on the Master in Economics Program, under the supervision of: Ana Fontoura Gouveia and Susana Peralta
Sectoral Productivity and Employment: The Impact of Product and Labour
Market Reforms
Abstract
This paper examines the impact of labour and product market reforms on sectoral employment and productivity, following a difference-in-differences approach. Using industry-level data for the period 1997-2013, we show that employment protection deregulation has a positive effect on the growth rate of employment, for industries more exposed to labour market legislation, despite not having any impact on productivity. Upstream product market deregulation increases sectoral employment growth, especially for the more exposed downstream sectors. Nevertheless, it has mixed effects on sectoral productivity growth: while upstream sectors face productivity losses (as only the most efficient firms are able to thrive), the downstream sectors, more exposed to the deregulated sectors, are able to grasp productivity gains.
JEL Classification: C23; E23; E24; J23; L16; O47
Keywords: Labour Market Reforms; Product Market Reforms; Employment; Productivity
Acknowledgments
I am endlessly indebted for all the guidance, support and suggestions given by my outstanding supervisors, Ana Fontoura Gouveia (GPEARI – Portuguese Ministry of Finance and Nova SBE) and Susana Peralta (Nova SBE). I am also very appreciative of the contributions provided by Teresa Molina. Moreover, I want to acknowledge with gratitude the valuable work of Filipa Fernandes and Tiago Martins (both GPEARI – Ministry of Finance). Finally, I would like to thank Statistics Portugal (INE) for their prompt assistance regarding the database and Banco de Portugal for providing the firm-level data.
I dedicate this work to my adored family and friends. A special mention goes to my beloved grandmother, Maria Regina Soares de Brito, for investing in my education since day one.
1. Introduction
Recent decades have seen a surge in the calls for product and labour market reforms: “Product
and labour market reforms are needed to lift persistently sluggish growth in advanced economies” – as summarized in one of the latest IMF Staff Discussion Notes (Banerji et al.,
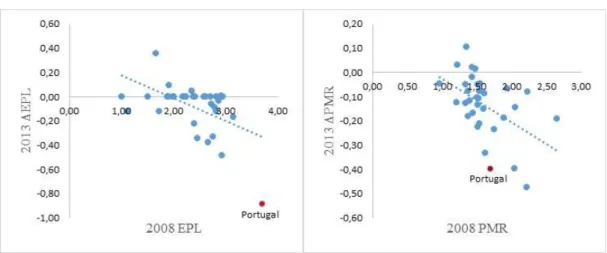
2017). Such reforms have been prescribed for Portugal as a growth-promoting tool, particularly after the sovereign debt and economic crisis and the adjustment programme that ensued (European Commission, 2014; OECD, 2014), leading the country to one of the most ambitious plan of structural reforms amongst developed countries (OECD, 2014; Koske, I. et al., 2015; see Figure 1). In the labour market, employment protection legislation reforms included cuts in severance pay; inclusion of further reasons for dismissal based on inadaptability; and performance-based criteria for dismissals in the case of extinction of the work position (OECD, 2017). The product market has also seen significant developments with: product and service markets liberalization (covering both networks and professional services), enhancement of the competition framework and improvements in the enforcement (European Commission, 2016; OECD, 2013a; 2014); in a context of reforms improving framework conditions (e.g. judicial system, business environment, etc.).
Figure 1 – Evolution of Employment Protection Legislation (EPL) and Upstream Product Market Regulation (PMR) in
OECD countries
Source: Own calculations, based on OECD Indicators of Employment Protection Legislation and OECD Indicators of Product
We take advantage of these recent developments to assess the effects of product and labour market deregulation on employment and productivity outcomes, at sectoral level, for the case of Portugal.1 This strategy allows us to obtain the marginal effect of the regulatory indicators in the sectors of the Portuguese economy, taking into account the idiosyncratic conditions of the country – whereas cross-country estimated parameters are assumed to be the same throughout a panel of countries, in spite of these having different underlying economic structures.2 Industry-level analysis also has advantages vis-à-vis (non-weighted) firm-level analysis, since the impact of a reform on the average firm does not necessarily carry over to its corresponding sector, as a whole.
We show that employment protection deregulation has a positive effect on the growth rate of employment, for industries more exposed to labour market legislation, despite not having any impact on productivity. However, by drilling down from sectoral to firm-level data, we show that the absence of aggregate sectoral effects disguises composition effects across firms, with winners and losers.
In addition, we show that product market deregulation, in upstream sectors, promotes overall employment growth - for the industries more exposed to the deregulated sectors. Particularly, the downstream sectors experience an increase in employment growth greater than the overall sectoral increase.3 Concerning productivity, whilst the deregulated upstream sectors are found
to suffer losses, the downstream sectors (more exposed to the deregulated ones) grasp
1Importantly, this study results from a partnership between the Office for Economic Policy and International
Affairs (GPEARI) of the Portuguese Ministry of Finance and Nova School of Business and Economics. The GPEARI is particularly interested in these sectoral effects on the Portuguese economy, given the lack of industry-level studies focusing on the Portuguese economy.
2 It is worth noting the existence of a trade-off. Cross-country sectoral data necessarily increases the sample
variation in opposition of exclusively considering national sectoral data.
3 Downstream sectors, also designated in the literature as “manufacturing industries”, are the sectors that use
intermediate inputs produced by the upstream sectors (or “non-manufacturing industries”). The latter sectors herein considered are: networks, retail distribution and professional services.
productivity gains. The analysis is complemented by further exploring the heterogeneous firm-level impact of product market deregulation on productivity. For upstream industries (and considering firms with relatively high exposure), we find evidence that only firms with higher productivity growth are able to thrive in a more competitive upstream environment. Conversely, the indirect impact on downstream industries is broad-based, with gains occurring independently of the initial productivity growth of the firm.
The paper is organized as follows: Section 2 reviews the relevant literature, Section 3 presents the methodology, and Section 4 describes the datasets and the variables used. The results are presented in Section 5 and, finally, Section 6 provides the conclusion and lays a foundation for future work.
2. Literature Review
This section reviews the quantitative evidence on the effects of product and labour market deregulation on productivity and employment.
i) Labour market deregulation
While some studies argue that stringent labour market regulation curbs productivity (OECD, 2007; Bassanini et al., 2009; Cingano et al., 2010), others find productivity gains from employment regulation (Acharya et al., 2013; Gouveia et al., 2017a).
Concerning the effect on employment, OECD (2016) provides industry-level evidence of short-run employment losses caused by easing Employment Protection Legislation (EPL), which are then reverted in the long-run. Indeed, most authors find evidence of EPL’s negative sectoral effect on employment, namely in labour intensive industries (Ahsan and Pagés, 2009) and in industries that have high job reallocation rates, particularly due to a reduction in the net entry
of firms (Pagés and Micco, 2007). There are also cross-country studies, with aggregate-level data, establishing a link between regulation and higher unemployment (Scarpetta, 1996; La Porta et al., 2004).
ii) Product market deregulation
Upstream product market deregulation has been found to foster aggregate and sectoral-level long-run employment for downstream industries that are more dependent on the intermediate inputs provided by upstream sectors (OECD, 2016). This effect is explained by a competition channel which decreases downstream input prices, increases its quality, and eliminates the regulatory-induced competitive disadvantage of downstream sectors when negotiating contracts and prices with upstream ones (Bourlès et al., 2010). Product market deregulation has also been linked with positive aggregate employment effects, that strengthen over time, particularly when labour market regulations are stringent (Fiori et al., 2012). Furthermore, Bassanini (2015) finds evidence of revertible employment short-run losses in upstream sectors, mainly through downsizing.
Several papers establish a positive link between pro-competitive upstream product market reforms and downstream productivity, using both firm-level (Arnold et al., 2011; Forlani, 2012; Gal and Hijzen, 2016; Topalova and Lanau, 2016) and sectoral-level data (Bourlès et. al., 2010, 2013; Barone and Cingano, 2011). However, while some authors argue that reforms have greater returns the closer an economy is to the technological frontier (Arnold et al., 2008; Acemoglu et al., 2003, 2006; Vandenbussche et al., 2006), others show that gains increase with the distance to the frontier (Nicoletti and Scarpetta, 2003; Gouveia et al., 2017a; Gouveia et al, 2017b). Bourlès et al., (2013) also find evidence of heterogeneous effects, showing that deregulation boosts the returns to innovation for the most productive firms but reduces the innovation incentives for the least productive.
Amable et al. (2016) argue that deregulation curbs innovation in upstream sectors, which trickles down to downstream sectors, hindering productivity growth.
3.
Methodology
Our baseline regression evaluates the effect of product and labour market regulatory indicators on two outcomes – employment and productivity – by comparing industries with different exposures to regulation. The fundamental reasoning behind this specification is that the intrinsic nature of an industry makes it more or less affected by regulation. In other words, the degree whereby a sector is exposed to regulation determines how binding regulation is for that sector, thus allowing us to perform a difference-in-differences analysis. Following the literature, we consider that sectors with higher layoffs are more exposed to labour market regulation (e.g. Bassanini et al., 2009), while those that use higher shares of upstream-sector inputs are more exposed to product market regulation (e.g. Bourlès et. al., 2010).
We thus implement the difference-in-differences specification of Bassanini et al. (2009), who specify the expected pairwise-difference between any two sectors (𝑘 and ℎ) as:
𝐸(∆ log 𝑂𝑢𝑡𝑐𝑜𝑚𝑒𝑘,𝑡 − ∆ log 𝑂𝑢𝑡𝑐𝑜𝑚𝑒ℎ,𝑡) = (𝑓( 𝐸𝑥𝑝𝑘) − 𝑓( 𝐸𝑥𝑝ℎ))𝑔(𝑅𝑒𝑔𝑡−1, ∆𝑅𝑒𝑔𝑡) [1]
, where 𝑓(. ) is a non-negative and non-decreasing function.
Letting 𝑔(. ) be linear, and 𝑓(. ) the identity function, we can re-write [1] as:
𝐸(∆ log 𝑂𝑢𝑡𝑐𝑜𝑚𝑒𝑘,𝑡) − 𝐸(∆ log 𝑂𝑢𝑡𝑐𝑜𝑚𝑒ℎ,𝑡) = 𝛽𝑅𝑒𝑔𝑡−1( 𝐸𝑥𝑝𝑘− 𝐸𝑥𝑝ℎ) +
𝛿∆𝑅𝑒𝑔𝑡( 𝐸𝑥𝑝𝑘− 𝐸𝑥𝑝ℎ) + (𝛾𝑘− 𝛾ℎ) [2]
Hence, for industry 𝑗, the expected growth of the outcome variable can be expressed as: E(∆𝑂𝑢𝑡𝑐𝑜𝑚𝑒𝑗,𝑡) = 𝛽𝐸𝑥𝑝𝑗 𝑅𝑒𝑔𝑡−1 + 𝛿𝐸𝑥𝑝𝑗 ∆𝑅𝑒𝑔𝑡+ 𝛾𝑗+ µ𝑡 [3]
, where µ𝑡 captures sector-invariant effects. In this setting, the growth of the outcome variable
∆𝑂𝑢𝑡𝑐𝑜𝑚𝑒𝑗,𝑡= 𝛽𝐸𝑥𝑝𝑗 𝑅𝑒𝑔𝑡−1 + 𝛿𝐸𝑥𝑝𝑗 ∆𝑅𝑒𝑔𝑡+ 𝜃𝑗 + 𝜃𝑡+ 𝜀𝑗𝑡 [4]
, where 𝑂𝑢𝑡𝑐𝑜𝑚𝑒𝑗,𝑡 stands for productivity or employment variables of industry j in year t
(depending on the specification), 𝐸𝑥𝑝𝑗 denotes the exposure to the regulatory variable for industry j, and 𝑅𝑒𝑔𝑡 stands for product or labour market regulation at time t (depending on the specification). Furthermore 𝜃𝑗 and 𝜃𝑡 are industry and time fixed effects, respectively.
The intuition for the difference-in-differences approach, that we follow, can be easily seen by focusing on a particular case of equation [4], whereby the treatment is defined by an indicator variable which identifies industries as being entirely regulation-binding (treatment group), if their exposure is greater than a certain threshold.4 In this binary setting (as opposed to our continuous one), the estimated coefficients provide us with the difference between treatment and control groups. In the continuous case we follow, we have the difference between two industries which are one percentage point apart in terms of exposure, hence our coefficient gives us the impact of “treatment” intensity. Indeed, as pointed out by Bassanini et al., (2009), it is more plausible that the extent to which an industry is affected by regulation depends on a continuous variable (such as our exposure variable).
Overall, it is important to note that 𝛽 measures the growth-effect, i.e. the permanent impact of the regulatory variable on the growth rate of the outcome variable (as the corresponding explanatory variable is specified as a level variable, while the response variable is specified as a growth variable); 𝛿 captures the level-effect i.e. the permanent level-impact of deregulation (as both the explanatory and the dependent variable are expressed as growth variables). However, as emphasized by Bassanini et al., (2009), some level-effects may not be captured by
𝛿 if they take too much time to materialize; additionally, a level effect which only materializes in the very long-term may be taken, in our model, by a permanent growth effect.
For the firm-level analysis (standard and quantile regressions), we maintain specification [4], with the exception of allowing the outcome variable to be firm-specific.
4
Data
4.1. Dataset
We use annual sectoral-level data from the Portuguese National Accounts (ESA2010), compiled by INE – Instituto Nacional de Estatística (Statistics Portugal). The time frame considered is restricted by the available regulatory indicator variables of choice – sourced from OECD - which only covers the 1997-2013 period. We consider the sectors whereby, for the relevant timeframe, a suitable matching could be performed between the 2-digit ISIC Rev.3 aggregation (followed by OECD, for the regulatory indexes) and the 2-digit CAE Rev.3 (followed by the Portuguese National Accounts), excluding sectors more prone to measurement error or with an unavailable correspondent exposure indicator.5 These corrections decrease our sectoral dataset from 306 to 288 observations in the employment protection analysis, and from 612 to 576 or 496 (depending on the specifications) for the product market regulation case. Additionally, for the purposes of testing the robustness of our sectoral-level analysis and to explore the heterogeneous effect of upstream deregulation on productivity growth, we conduct a firm-level analysis, using the IES - Informação Empresarial Simplificada (Simplified Corporate Information) database, provided by Bank of Portugal. This database encompasses annual accounting data for all Portuguese firms. The initial dataset has 3,840,634 observations
5 See Box 1 in the Appendix for a breakdown of the (final) different sectors considered for the EPL and PMR
for the period 2006-2015. In order to increase the reliability of our estimates, we exclude firms which report a negative or nil amount of assets, liabilities, costs, turnover, worked hours, employees and value added. Likewise, we restrict the data for the period 2006-2013, due to the regulatory indicators’ availability. Furthermore, we consider the same sectors as for the correspondent industry-level regression, for consistency purposes. This leads us to 600,466 observations for the firm-level analysis and 119,535 for the quantile regression one.
4.2. Variables
This section outlines the various variables used throughout our analysis.
As stated in Section 3, we measure regulatory stringency of the labour market through the OECD indicator of Employment Protection Legislation, a measure of the incurred costs and procedures associated with the dismissal and hiring of employees. This measure is partitioned into three sub-indicators: EPR, an index of regulatory strictness concerning individual dismissal of workers on regular contracts; EPT, which measures the degree of regulation for temporary contracts; and EPRC, comprising a weighted sum of both individual and collective dismissal sub-indicators.6 These regulatory indicators range from 0 (no regulation) to 6 (maximum stringency).
We follow Bassanini et al., (2009) and Jain-Chandra and Zhang (2014), and use the layoff rate for the United States for the period 2001-03 as a measure of exposure to labour market regulations, computed by Bassanini et al., (2009), based on the 2004 Displaced Workers Supplement data. The rationale is that industries which are more prone to adjust to shocks in demand and supply through layoffs are more affected by regulation that determines their ability to adjust through this same mean. The US is the OECD country with the lowest level of
6 EPRC attributes a weight of 2/7 for additional provisions for collective dismissals and 5/7 to individual dismissals
employment protection legislation, thus serving as a de facto proxy that captures any given industry’s “natural” layoff rate in the absence of regulation. By using the US layoff rate, we avoid endogeneity issues related with using the Portuguese layoff rate, as this national value could be determined by the prevailing level of regulation in the labour market.
For the effects of product market deregulation on downstream industries, we rely on the regulatory impact indicator (Regimpact), computed by the OECD.7 This indicator incorporates the OECD regulatory indices for upstream sectors, i.e. networks, retail distribution and professional services (a narrow version of this indicator, only encompassing networks is used for robustness checks), which are then weighted by an industry-specific exposure variable.The exposure variable is computed using the input-output matrices, ascertaining the weight of upstream sector industries on the input usage of the different sectors. The intuition is that a sector which uses a higher amount of inputs from the upstream industries is more vulnerable to regulation in those sectors. Similarly to the layoff rate, we use input-output coefficient from the correspondent US industry, to avoid endogeneity issues. The OECD regulatory impact indicator, Regimpact, takes value 0 for unaffected downstream sectors due to upstream regulation, and 1 for the highly-affected ones.
The outcome variables are: worked hours (HoursWorked), as a baseline for employment, with the number of employees (Employees) being used for robustness checks. Our measure of productivity is labour productivity, determined with the ratio of gross value added (GVA) to worked hours (HoursWorked). Output is used instead of gross value added, when available, for assessing the robustness of the results.
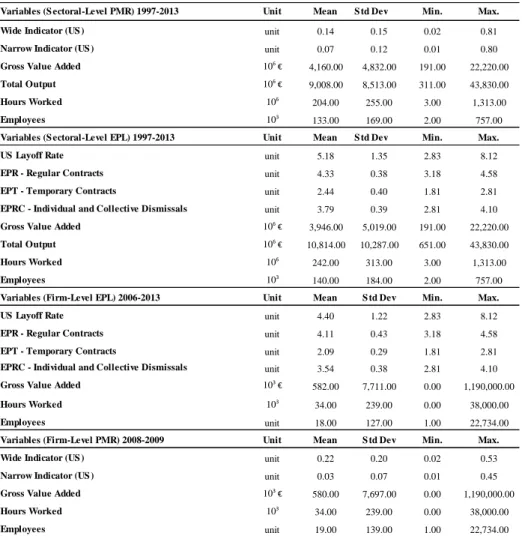
Table 1 presents the descriptive statistics for the various sectoral and firm-level samples used in the different specifications:
Source: Own computations using INE, IES, OECD and Displaced Workers Supplement data, for the above-mentioned
periods.
5. Empirical Results and Robustness Checks
In this section, we present the estimation results for specification [4], adapting it in accordance to the outcomes and regulatory indicators of choice.8
8 Whenever applicable, time fixed effects are included, as to control for unobserved macroeconomic shocks. We
also control for industry-specific demand dynamics: given that the baseline specification is estimated by a fixed effects models and based on first differences, sectoral fixed effects are implicitly being accounted for, and thus not included in the regressions; with the forthcoming quantile regression being the exception, where fixed effects were not included due to insufficient sample variation.
Variables (S ectoral-Level PMR) 1997-2013 Unit Mean S td Dev Min. Max.
Wide Indicator (US ) unit 0.14 0.15 0.02 0.81
Narrow Indicator (US ) unit 0.07 0.12 0.01 0.80
Gross Value Added 106 € 4,160.00 4,832.00 191.00 22,220.00
Total Output 106 € 9,008.00 8,513.00 311.00 43,830.00 Hours Worked 106 204.00 255.00 3.00 1,313.00 Employees 103 133.00 169.00 2.00 757.00
Variables (S ectoral-Level EPL) 1997-2013 Unit Mean S td Dev Min. Max.
US Layoff Rate unit 5.18 1.35 2.83 8.12
EPR - Regular Contracts unit 4.33 0.38 3.18 4.58
EPT - Temporary Contracts unit 2.44 0.40 1.81 2.81
EPRC - Individual and Collective Dismissals unit 3.79 0.39 2.81 4.10
Gross Value Added 106 € 3,946.00 5,019.00 191.00 22,220.00
Total Output 106 € 10,814.00 10,287.00 651.00 43,830.00
Hours Worked 106 242.00 313.00 3.00 1,313.00
Employees 103
140.00 184.00 2.00 757.00
Variables (Firm-Level EPL) 2006-2013 Unit Mean S td Dev Min. Max.
US Layoff Rate unit 4.40 1.22 2.83 8.12
EPR - Regular Contracts unit 4.11 0.43 3.18 4.58
EPT - Temporary Contracts unit 2.09 0.29 1.81 2.81
EPRC - Individual and Collective Dismissals unit 3.54 0.38 2.81 4.10
Gross Value Added 103 €
582.00 7,711.00 0.00 1,190,000.00
Hours Worked 103 34.00 239.00 0.00 38,000.00
Employees unit 18.00 127.00 1.00 22,734.00
Variables (Firm-Level PMR) 2008-2009 Unit Mean S td Dev Min. Max.
Wide Indicator (US ) unit 0.22 0.20 0.02 0.53
Narrow Indicator (US ) unit 0.03 0.07 0.01 0.45
Gross Value Added 103 € 580.00 7,697.00 0.00 1,190,000.00
Hours Worked 103 34.00 239.00 0.00 38,000.00
Employees unit 19.00 139.00 1.00 22,734.00
5.1 Sectoral-Level Impact of Labour Market Regulation
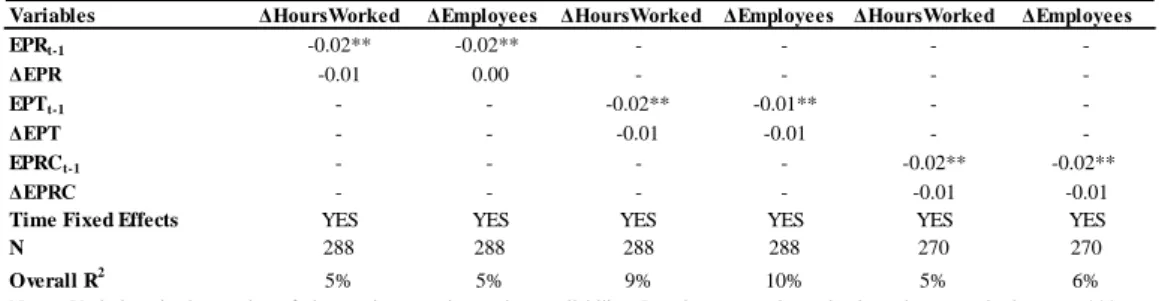
The results, presented in Table 2, show evidence of a negative link between employment protection legislation and employment growth, in industries that are “naturally” more affected by such legislation. Hence, these industries will tend to increase the rate at which they hire employees as a consequence of deregulation, in comparison to those less exposed to regulation. A likely explanation is that industries more prone to adjust to market shocks through hirings and layoffs have a higher latent labour demand than the one displayed under tight regulation. Therefore, if regulation hinders their ability to adjust, they are cautious to hire due to uncertainty, implying less efficient production outcomes, as they are less responsive to market changes. With deregulatory reform, these sectors are able to increase net hirings, with net benefits arising from increased flexibility. This result is robust to the usage of the variation in the number of employees as measure of employment growth.
Table 2 – Impact of Employment Protection Legislation on Sector-Level Employment
Source: Own computations, using INE and OECD data for the years 1997-2013.
Concerning the effects on productivity, the results presented in Table 3 suggest a lack of robust response of productivity to employment protection legislation, as there are no differences between regulation-exposed sectors and the others. Indeed, there are only two single significant and weakly significant effects for the cases of the indicators for temporary contracts (EPT) and of stringency ruling individual and collective dismissals (EPRC), but that fail to be robust to changes in the outcome variable of labour productivity.
Variables ΔHoursWorked ΔEmployees ΔHoursWorked ΔEmployees ΔHoursWorked ΔEmployees
EPRt-1 -0.02** -0.02** - - - -ΔEPR -0.01 0.00 - - - -EPTt-1 - - -0.02** -0.01** - -ΔEPT - - -0.01 -0.01 - -EPRCt-1 - - - - -0.02** -0.02** ΔEPRC - - - - -0.01 -0.01
Time Fixed Effects YES YES YES YES YES YES
N 288 288 288 288 270 270
Overall R2 5% 5% 9% 10% 5% 6%
Notes: Variations in the number of observations are due to data availability. Results were estimated using robust standard errors. ***: significant at 1% level; **: significant at 5% level; *: significant at 10% level.
Table 3 – Impact of Employment Protection Legislation on Sector-Level Productivity
Source: Own computations, using INE and OECD data for the years 1997-2013.
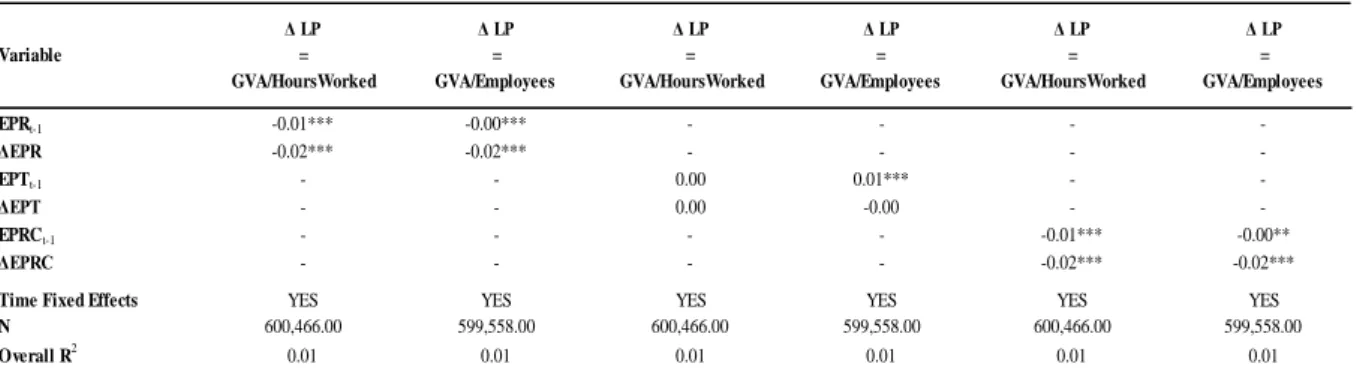
To further understand the lack of response of productivity, we extend the analysis to firm-level data (Table 4), showing that, despite no aggregate sectoral effects, there are composition effects that cancel out at sectoral level. Indeed, for the average firm, deregulation has a positive effect on productivity, the higher the exposure to regulation.9
Table 4 – Impact of Employment Protection Legislation on Firm-Level Productivity
Source: Own computations, using IES and OECD data for the years 2006-2013.
These results are robust to the usage of GVA/Employees as measure of labour productivity.
5.2. Sectoral-Level Impact of Product Market Regulation
Competitive-enhancing upstream reforms are estimated to have a positive impact on employment growth, for industries that depend relatively more on upstream intermediate inputs, and consequently are more affected by upstream product market regulation (Table 5). A
9 Nevertheless, there is no robust response of productivity to EPT (employment protection legislation for temporary
contracts). Variable Δ LP = GVA/Employees Δ LP = Output/Employees Δ LP = GVA/Employees Δ LP = Output/Employees Δ LP = GVA/Employees Δ LP = Output/Employees EPRt-1 0.06 0.02 - - - -ΔEPR -0.04 0.01 - - - -EPTt-1 - - 0.02 0.02** - -ΔEPT - - -0.00 0.00 - -EPRCt-1 - - - - 0.05* 0.02 ΔEPRC - - - - -0.06 0.00
Time Fixed Effects YES YES YES YES YES YES
N 288.00 288.00 288.00 288.00 270.00 270.00
Overall R2
0.00 0.00 0.02 0.02 0.00 0.10
Notes: Variations in the number of observations are due to data availability. Results were estimated using robust standard errors. ***: significant at 1% level; **: significant at 5% level; *: significant at 10% level. Variable Δ LP = GVA/HoursWorked Δ LP = GVA/Employees Δ LP = GVA/HoursWorked Δ LP = GVA/Employees Δ LP = GVA/HoursWorked Δ LP = GVA/Employees EPRt-1 -0.01*** -0.00*** - - - -ΔEPR -0.02*** -0.02*** - - - -EPTt-1 - - 0.00 0.01*** - -ΔEPT - - 0.00 -0.00 - -EPRCt-1 - - - - -0.01*** -0.00** ΔEPRC - - - - -0.02*** -0.02***
Time Fixed Effects YES YES YES YES YES YES
N 600,466.00 599,558.00 600,466.00 599,558.00 600,466.00 599,558.00
straightforward reasoning is that lower upstream regulation pressures upstream sectors to reduce prices and to increase the quality of their services, via increased competition and reduced negotiation-edge vis-à-vis downstream clients, which fosters downstream growth and allows downstream sectors to channel resources towards further hirings.
Despite the non-negligible increase in overall employment growth, the effect is stronger in downstream sectors (Table 6), most likely since upstream industries have two opposing forces at work, whilst competition may lead to a downsizing of incumbents, firm entry is promoted by upstream deregulation.10 The results are robust to the usage of employees as employment variable.
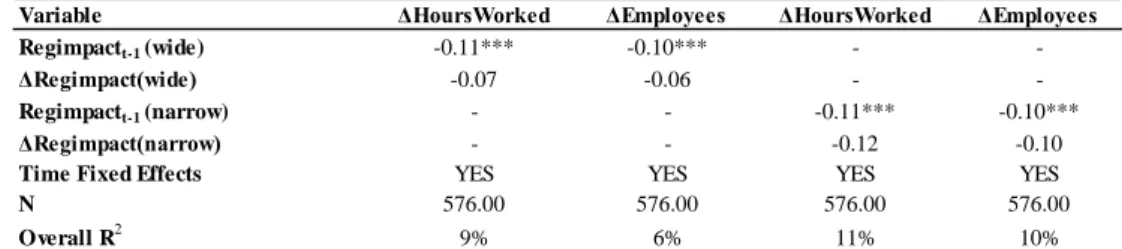
Table 5 - Impact of Upstream Product Market Deregulation on Sector-Level Employment
Source: Own computations, using INE and OECD data for the years 1997-2013.
Table 6 - Impact of Upstream Product Market Deregulation on Downstream Sector-Level Employment
Source: Own computations, using INE and OECD data for the years 1997-2013.
Turning to the impact on productivity, we find that an upstream deregulatory process dampens labour productivity growth for industries with a relative high-exposure to upstream regulation,
10 Since the regulatory indicator is also capturing the effect upstream deregulation has on the upstream sector
(direct effect of deregulation), we exclude the upstream industries of professional services, retail distribution and network from our sample and re-estimate the regression, using the wide Regimpact, in order to exclusively capture the indirect effects of upstream deregulation (on downstream sectors).
Variable ΔHoursWorked ΔEmployees ΔHoursWorked ΔEmployees
Regimpactt-1 (wide) -0.11*** -0.10*** -
-ΔRegimpact(wide) -0.07 -0.06 -
-Regimpactt-1 (narrow) - - -0.11*** -0.10***
ΔRegimpact(narrow) - - -0.12 -0.10
Time Fixed Effects YES YES YES YES
N 576.00 576.00 576.00 576.00
Overall R2 9% 6% 11% 10%
Notes: Variations in the number of observations are due to data availability. Results were estimated using robust standard errors. ***: significant at 1% level; **: significant at 5% level; *: significant at 10% level.
Variable ΔHoursWorked ΔEmployees
Regimpactt-1 (wide) -0.19 -0.40**
ΔRegimpact(wide) -0.61** -0.68**
Time Fixed Effects YES YES
N 496.00 496.00
Overall R2 11% 6%
Notes: Results were estimated using robust standard errors. ***: significant at 1% level; **: significant at 5% level; *: significant at 10% level.
in comparison to the remainder industries (Table 7). This result is robust to the usage of the narrow indicator and to the usage of Output for the computation of labor productivity, instead of the baseline variables.
Table 7 - Impact of Upstream Product Market Deregulation on Sector-Level Productivity
Source: Own computations, using INE and OECD data for the years 1997-2013.
Table 8 clarifies this outcome. Indeed, we find that there are productivity gains for downstream industries but not for the deregulated sectors themselves, which are hampered by increased competition and lower incentives to innovation (due to reduced mark-ups). The downstream sectors are likely to see their input costs going down and to gain better access to upstream services, thus allowing them to increase the efficiency of their productive process and to channel resources towards productivity-enhancing technology. Moreover, the result is robust to the below represented variation in the measure of productivity growth.
Table 8 - Impact of Upstream Product Market Deregulation on Downstream Sector-Level Productivity
Source: Own computations, using INE and OECD data for the years 1997-2013.
Furthermore, and given that some authors argue that the impact of reforms is mediated by firm-level productivity (e.g. Arnold et al., 2008; Gouveia et al., 2017a), we complement our analysis by assessing whether there are heterogeneous effects across firms with different productivity growth rates, which are concurring to our aggregate sectoral result. To do so, we estimate a
Variable Δ LP = GVA/HoursWorked Δ LP = Output/HoursWorked Δ LP = GVA/HoursWorked Δ LP = Output/HoursWorked
Regimpactt-1 (wide) 0.14** 0.18*** -
-ΔRegimpact(wide) 0.18 -0.07 -
-Regimpactt-1 (narrow) - - 0.18** 0.19*
ΔRegimpact(narrow) - - 0.22 -0.04
Time Fixed Effects YES YES YES YES
N 576.00 576.00 576.00 576.00
Overall R2 2% 11% 2% 15%
Notes: Variations in the number of observations are due to data availability. Results were estimated using robust standard errors. ***: significant at 1% level; **: significant at 5% level; *: significant at 10% level.
Variable Δ LP = GVA/HoursWorked Δ LP = GVA/Employees
Regimpactt-1 (wide) -0.58*** -0.38**
ΔRegimpact(wide) -0.27 -0.19
Time Fixed Effects YES YES
N 496.00 496.00
Overall R2 1% 3%
Notes: Results were estimated using robust standard errors. ***: significant at 1% level; **: significant at 5% level; *: significant at 10% level.
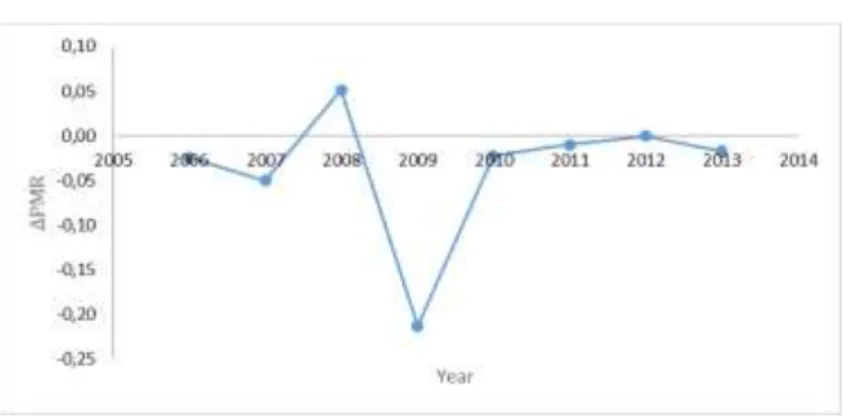
firm-level quantile regression.11 As, within our time frame, upstream product market regulation mostly changed between 2008-2009 (Figure 2), we restrict our quantile regression firm-level analysis to this period.12
Figure 2 – Growth of Upstream Product Market Regulation in Portugal
Source: Own computations, using OECD indicators of Product Market Regulation for the years 2006-2013.
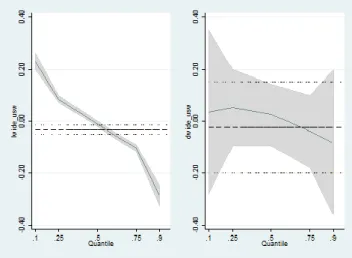
Figure 3 illustrates how the OLS estimates fail to grasp the whole picture of the deregulatory growth-effect on productivity (left-hand side panel), and only succeeds at doing so for the level-effects (right-hand side panel). The former quantile regression curve (in the left panel) sheds light on how the estimated coefficients vary along the conditional distribution of the productivity growth rate.
11 A firm-level analysis is performed due to lack of sector-level sample variation for this approach.
12 Panel quantile regression has numerous caveats associated with it. Moreover, firms are expected to change
Figure 3 - Impact of Upstream Product Market Deregulation on Firm-Level Productivity
Notes: The vertical axis display the marginal impact of one unit change per quantile (on the horizontal axis), for comparison
purposes the OLS estimates and the respective confidence intervals are also presented, as the horizontal dashed lines. The shadowed area surrounding the quantile regression curves represents its 95% confidence interval.
Source: Own computations, using IES and OECD data for the years 2008-2009.
The estimation, using the baseline measure of productivity growth, shows (Table 9) that firms with low levels of productivity growth (at the lower quantiles), experience a detrimental effect of upstream product market deregulation on productivity growth (considering firms with a higher exposure relatively to firms with lower exposure). Nevertheless, for firms with higher productivity growth rates, (at upper quantiles) deregulation becomes beneficial.
Table 9 - Impact of Upstream Product Market Deregulation on Firm-Level Productivity
Source: Own computations, using IES and OECD data for the years 2008-2009
Similarly to the previous analyses, we exclude the upstream industries, in order to assess whether these results are being influenced by the direct effects on deregulated sectors.
Δ LP Quantiles Variables 0.10 0.25 0.50 0.75 0.90 Regimpactt-1 (wide) 0.23*** 0.09*** -0.01** -0.10*** -0.28*** ΔRegimpact(wide) 0.04 0.05 0.03 -0.04 -0.08 N 119,535 119,535 119,535 119,535 119,535 Pseudo R2 0% 0% 0% 0% 0%
Notes: Industry fixed effects were not included due to insufficient sample variation; ***: significant at 1% level; **: significant at 5% level; *: significant at 10% level.
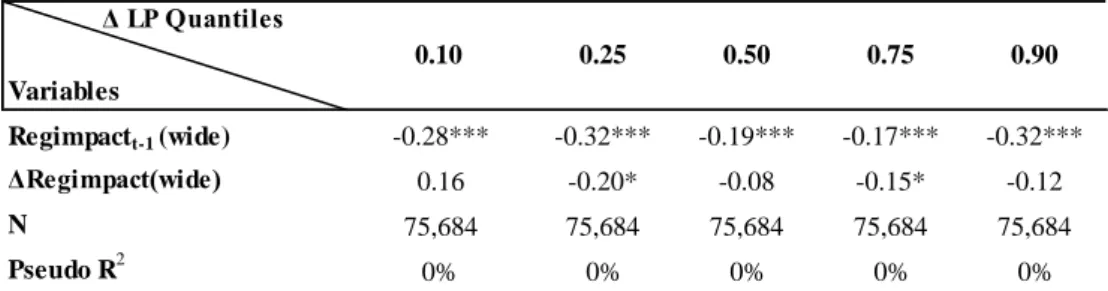
The estimated results (Table 10) suggest that the inequitable effects of deregulation on productivity growth are determined solely by the upstream direct effects of regulation; in this vein, upstream product market deregulation has a rather homogeneous positive effect on productivity growth for downstream firms, regardless of their relative productivity growth (their position along the quantile distribution)
Table 10 - Impact of Upstream Product Market Deregulation on Downstream Firm-Level Productivity
Source: Own computations, using IES and OECD data for the years 2008-2009
6. Conclusion and Future Directions
Recent years have seen a surge in the demand for product and labour market deregulation alike. Portugal has been in the forefront of this matter, having undertaken an ambitious reform programme, in the midst of sluggish economic growth and persistent economic imbalances. Empirical evidence on the aggregate sectoral impact of structural reforms, taking into account the specificities of the Portuguese economy, is therefore vital from a policy maker’s standpoint, in order to sharpen the design and implementation of such reforms and to complement the existing firm-level and cross-country evidence. Furthermore, literature shows that information is crucial for the ownership of any reform process (Boeri and Tabellini, 2012; Gouveia et al., 2017a).
In this context, we use sectoral-level data for the periods 1997-2013 to evaluate the impact of labour and product market reforms on employment and productivity growth, following a
Δ LP Quantiles Variables 0.10 0.25 0.50 0.75 0.90 Regimpactt-1 (wide) -0.28*** -0.32*** -0.19*** -0.17*** -0.32*** ΔRegimpact(wide) 0.16 -0.20* -0.08 -0.15* -0.12 N 75,684 75,684 75,684 75,684 75,684 Pseudo R2 0% 0% 0% 0% 0%
Notes: Industry fixed effects were not included due to insufficient sample variation; ***: significant at 1% level; **: significant at 5% level; *: significant at 10% level.
difference-in-differences approach. Where needed, we complement our analysis with firm-level data (available from 2006 onwards) in order to shed light on the effects at play.
The empirical results suggest overall benefits from deregulatory processes, both in terms of employment and productivity, with some qualifications nonetheless.
Concerning labour market reforms, and in line with the findings of OECD (2016) and Pagés and Micco (2007), our results suggest that decreasing the costs associated with hirings and dismissals fosters the employment growth rate, for industries more exposed to labour market regulations (proxied by the industry’s “natural” job turnover). In addition, while we do not find any sectoral-effect on productivity we show, relying on firm-level data, that there are gainers and losers, which resonates with the asymmetric effects found in the literature, with evidence of productivity gains and productivity losses. Our firm-level analysis points to positive effects for the average firm, which is small and has low productivity. This corroborates the results of Gouveia et al., (2017a), showing that only the least productive firms are able to grasp productivity gains from reduced employment protection legislation.
In respect to product market reforms, upstream deregulation is found to foster employment growth for the sectors with relatively high degree of exposure to upstream inputs, matching the findings of OECD (2016). Additionally, our results show that downstream industries see their productivity growth increase with upstream product market deregulation, similarly to the findings of Barone and Cingano (2011) and Bourlès et. al., (2010; 2013). Conversely, and as argued by Amable et al., (2016), we find evidence that upstream sectors face productivity losses, possible due to reduced incentives to innovate (via reduced mark-ups). Our quantile regression sheds further light on this result, showing that there are important composition effects in upstream industries – while firms with high relative exposure, that experience higher
productivity growth rates are able to grasp additional productivity gains, when faced with a more competitive environment, the ones at the bottom of the distribution face lower productivity growth.
Our analysis could be enlarged in a number of ways. In particular, the analysis of employment outcomes focuses on quantity of overall employment. It would be interesting to consider the effects on full-time and part-time employment and on permanent and temporary contracts as changes in regulation may have heterogeneous effects. Also, we do not account for the impact on the quality of employment, which is also a key element for policy assessment as deregulation may induce less stable employment relations and an erosion of workers’ rights, with important equity considerations. Furthermore, we do not account for interactions among reforms or for the initial regulatory stance. However, the impact of changes in regulation may be non-linear and may depend on the existing level of regulation, which is important for the sequencing and packaging of reforms. Furthermore, we consider that the effects are symmetric, i.e. that loosening and tightening regulation has a comparable effect, which is not necessarily the case.
7. References
[1] Acemoglu, Daron; Aghion, Philippe and Zilibotti, Fabrizio. 2003. “Vertical integration and distance to frontier.” Journal of the European Economic Association, 1(2‐3): 630-638.
[2] Acemoglu, Daron; Aghion, Philippe and Zilibotti, Fabrizio. 2006. “Distance to frontier, selection, and economic growth.” Journal of the European Economic association, 4(1): 37-74. [3] Acharya, V. V; Baghai, R. P. and Subramanian, K. V. 2013. “Labor laws and innovation.” The Journal of Law and Economics, 56(4): 997-1037
[4] Ahsan, Ahmand and Pagés, Carmen. 2009. “Are all labour regulations equal? Evidence from Indian manufacturing.” Journal of Comparative Economics, 37(1): 62-75.
[5] Amable, B.; Ledezma, I. and Robin, S. 2016. “Product market regulation, innovation, and productivity.” Research Policy, 45(10): 2087-2104.
[6] Arnold, Jens; Nicoletti, Giuseppe and Scarpetta, Stefano. 2008. "Regulation, Allocative Efficiency and Productivity in OECD Countries: Industry and Firm-Level Evidence." OECD Economics Department Working Papers 616, OECD Publishing.
[7] Arnold, Jen. M.; Javorcik, Beata and Mattoo, Aaditya. 2011. “Does services liberalization benefit manufacturing firms? Evidence from the Czech Republic.” Journal of International Economics, 85(1): 136-146.
[8] Banerji A.; Ebeke C.; Furceri D.; Dabla-Norris E.; Duval R.; Komatsuzaki T.; Poghosyan T. and Crispolti V. 2017. “Labor and Product Market Reforms in Advanced Economies: Fiscal Costs, Gains, and Support.” IMF Staff Discussion Note, March 2017.
[9] Bassanini, Andrea; Nunziata, Luca and Venn, Danielle. 2009. “Job protection legislation and productivity growth in OECD countries.” Economic Policy, 24(58): 349-402.
[10] Bassanini, Andrea. 2015. “A bitter medicine? Short-term employment impact of deregulation in network industries.” IZA Discussion Papers, No. 9187
[11] Barone, G. and F. Cingano. 2011.“Service Regulation and Growth: Evidence from OECD Countries.” The Economic Journal, 121(555)
[12] Boeri, Tito and Tabellini, Guido. 2012. “Does information increase political support for pension reform?” Public Choice, 150(1): 327-362.
[13] Bourlès, R.; Cette, G.; Lopez, J.; Mairesse, J. and Nicoletti, G. 2010. “The impact on growth of easing regulations in upstream sectors.” Research Report. CESifo
[14] Bourlès, R.; Cette, G.; Lopez, J.; Mairesse, J. and Nicoletti, G. 2013. “Do product market regulations in upstream sectors curb productivity growth? Panel data evidence for OECD countries.” Review of Economics and Statistics, 95(5): 1750-1768.
[15] Cingano, F.; Leonardi, M.; Messina, J. and Pica, G. 2010. “The effects of employment protection legislation and financial market imperfections on investment: evidence from a firm-level panel of EU countries.” Economic Policy, 25(61): 117-163.
[16] Égert, B. and I. Wanner. 2016. “Regulations in services sectors and their impact on downstream industries: The OECD 2013 Regimpact Indicator.” OECD Economics Department Working Papers, No. 1303, OECD Publishing, Paris.
[17] European Commission. 2014.” The Economic Adjustment Programme for Portugal - Eleventh Review.” Occasional Papers 191. April 2014. Brussels.
[18] European Commission. 2016. “Ex-post evaluation of the economic adjustment programme in Portugal: 2011- 2014.” Institutional paper 040. November 2016.
[19] Fiori, G.; Nicoletti, G.; Scarpetta, S. and Schiantarelli, F. 2012. “Employment effects of product and labour market reforms: are there synergies?” The Economic Journal, 122(558). [20] Forlani, E. 2012. “Competition in Services and Efficiency of Manufacturing Firms: Does 'Liberalization' Matter?” LICOS Discussion Paper No. 311/2012 (Katholieke Universiteit Leuven).
[21] Gal, P. and Hijzen, A. 2016. “The short-term impact of product market reforms: A cross-country firm-level analysis.” IMF Working Paper 16/116.
[22] Gouveia, Ana; Sílvia, Santos and I. Gonçalves. 2017a. "The impact of structural reforms on productivity: The role of the distance to the technological frontier." OECD Productivity Working Papers, No. 8, OECD Publishing, Paris.
[23] Gouveia, Ana Fontoura; Monteiro, Gustavo and Santos, Sílvia. 2017b. “Short-run effects of product markets deregulation: a more productive, more efficient and more resilient economy?” GPEARI – Ministério das Finanças
[24] Jain-Chandra, S. and Zhang, L. 2014. “How can Korea Boost Potential Output to Ensure Continued Income Convergence?”
[25] Koske, I.; Wanner, I.; Bitetti, R. and Barbiero, O. 2015. “The 2013 update of the OECD's database on product market regulation: Policy insights for OECD and non-OECD countries." OECD Economic Department Working Papers, No.1200, OECD Publishing.
[26] La Porta, R.; Botero, J. C.; Djankov. S.; Lopez-de-Silanes. F. and Shleifer, A. 2004. The Regulation of Labor. Technology, 1339.
[27] Nicoletti, G. and Scarpetta, S. 2003. “Regulation, productivity and growth. OECD Economics.” Department Working Paper 347. OECD publishing. Paris.
[28] OECD. 2007. “More jobs but less productive? The impact of labour market policies on productivity.” OECD Employment Outlook 2007.
[29] OECD, 2013a. “Portugal: Reforming the State to promote Growth. Better Policies Series.” OECD, Paris
[30] OECD. 2013b. “Product Market Regulation Database.” www.oecd.org/economy/pmr. [31] OECD. 2013c. Employment Protection Database www.oecd.org/employment/protection [32] OECD. 2013d. “Protecting jobs, enhancing flexibility: A new look at employment protection legislation.” OECD Employment Outlook 2013, OECD Publishing.
[33] OECD. 2014. “Portugal: Deepening Structural Reform to Support growth and Competitiveness.” OECD Better Policies Series.
[34] OECD. 2016. “Short-term labour market effects of structural reforms: pain before the gain?” OECD employment outlook. Chapter 3.
[35] OECD. 2017. "Labour market reforms in Portugal 2011-2015." OECD Publishing, Paris. [36] Pagés, Carmen and Micco, A. 2007. “The Economic Effects of Employment Protection:
Evidence from International Industry-Level Data.” (No. 4120). Inter-American Development Bank.
[37] Lanau, S. and Topalova, P. 2016. “The Impact of Product Market Reforms on Firm Productivity in Italy.” IMF Working Paper 16/119
[38] Nicoletti, G. and Scarpetta, S. 2003. “Regulation, productivity and growth.” OECD Economics Department Working Paper 347. OECD publishing. Paris.
[39] Scarpetta, Stefano. 1996. “Assessing the role of labour market policies and institutional settings on unemployment: A cross-country study.” OECD Economic studies, 26(1): 43-98. [40] Topalova. 2016. “The Refugee Surge in Europe: Economic Challenges.” Staff Discussion Note 16/02. International Monetary Fund, Washington.
[41] Vandenbussche, Jérôme; Aghion, Philippe and Meghir, Costas. 2006. “Growth, distance to frontier and composition of human capital.” Journal of Economic Growth, 11(2): 97-127.
Appendix – Box 1
Sectors Considered for the Employment Protection Legislation analysis:
Manufacture of food products, beverages and tobacco products; Manufacture of textiles, wearing apparel and leather products; Manufacture of wood and paper products, and printing; Manufacture of coke, and refined petroleum products; Manufacture of chemicals and chemical products; Manufacture of basic pharmaceutical products and pharmaceutical preparations; Manufacture of rubber and plastics products, and other non-metallic mineral products; Manufacture of basic metals and fabricated metal products, except machinery and equipment; Manufacture of electrical equipment; Manufacture of machinery and equipment n.e.c.; Manufacture of transport equipment; Manufacture of furniture; other manufacturing; repair and installation of machinery and equipment; Water, sewerage, waste management and remediation activities; Construction; Wholesale and retail trade, repair of motor vehicles and motorcycles; Transportation and storage; Accommodation and food service activities; Telecommunications.
Sectors Considered for the Product Market Regulation analysis:
Agriculture, forestry and fishing; Mining and quarrying; Manufacture of food products, beverages and tobacco products; Manufacture of textiles, wearing apparel and leather products; Manufacture of wood and paper products, and printing; Manufacture of coke, and refined petroleum products; Manufacture of chemicals and chemical products; Manufacture of basic pharmaceutical products and pharmaceutical preparations; Manufacture of rubber and plastics products, and other non-metallic mineral products; Manufacture of basic metals and fabricated metal products, except machinery and equipment; Manufacture of computer, electronic and optical products; Manufacture of electrical equipment; Manufacture of machinery and equipment n.e.c.; Manufacture of transport equipment; Manufacture of furniture; other manufacturing; repair and installation of machinery and equipment; Electricity, gas, steam and air-conditioning supply; Water, sewerage, waste management and remediation activities; Construction; Wholesale and retail trade, repair of motor vehicles and motorcycles; Transportation and storage; Accommodation and food service activities; Publishing, audiovisual and broadcasting activities; Telecommunications; Computer programming, consultancy and related activities; information service activities; Financial and insurance activities; Real estate activities; Legal and accounting activities; activities of head offices; management consultancy activities; architecture and engineering activities; technical testing and analysis; Scientific research and development; Advertising and market research; other professional, scientific and technical activities; veterinary activities; Administrative and support service activities; Public administration and defence; compulsory social security; Education; Human health services; Social work activities; Arts, entertainment and recreation; Other services activities.