1
NOVA School of Business and Economics
Master Thesis in Economics
The Impact of income support programs on
transitions to employment
Sara Margarida Fragoso Simões, Student Number: 643
Advisor: Professor Pedro Portugal
2
The Impact of income support programs on
transitions to employment
Abstract
The income support programs are created with the purpose of fighting both, the poverty
trap and the inactivity trap. The balance between both is fragile and hard to find. Thus, the goal of this work is to contribute to solve this issue by finding how income support programs, particularly the Portuguese RSI, affect transitions to employment.
This is made through duration analysis, namely using Cox and Competing Risks models. A particular feature is introduced in this work as it incorporates the possibility of Defective Risks.
The estimated hazard elasticity with respect to the amount of RSI received for individuals who move to employment is -0,41. More than a half of RSI receivers stays for more than
a year and the probability of never leaving to employment is 44%. The results appear to indicate that RSI has affected negatively transitions to employment.
3 Introduction
Income support programs are created with the purpose of fighting both, the poverty trap and the inactivity trap. The poverty trap consists on mechanisms which cause poverty to
persist. The inactivity trap happens when individuals do not have incentive to work. Imagine that policy makers concentrate their efforts on fighting the inactivity trap. In
order to create incentive to work, they reduce the amount of the benefit received when not working. In this case, the most disadvantaged households might not get the support they need. This decision stimulates the poverty trap. Imagine now that policy makers
decide to increase the amount received from social support programs to help the poorest households. This reduces the incentive to work, promoting the inactivity trap. As one can
see, the balance between both traps is fragile and hard to find. Hence, the present work aims to contribute for the solution of this problem by finding how income support
programs affect the transitions to employment.
This study will be made through several duration analysis models. The Cox Proportional Hazards model will provide information about the main duration determinants of the
program in question: the Portuguese RSI. Also, it will estimate the duration elasticity with respect to the amount of RSI received, in order to analyze the income effect on the program’s duration.
A Competing Risks model will deliver the effect of income support programs on transitions to employment and to a destination other than employment. The two possible
destinations considered when exiting RSI are: employment and not employment (inactivity, unemployment, other income sources…).
4
programs. This work allows us to know the determinants of duration of income support programs, particularly for the Portuguese case. Moreover, this work incorporates the possibility of defective risks, i.e., the probability of staying forever in the program. Thus,
it finally becomes possible to answer questions such as: do individuals move to employment after the RSI? What is the probability of never leaving the program to move
to employment? And to a destination other than employment?
Anne and L’Horty (2012) did, for the case of France, an inspirational work on income
support programs. Their work is centered on the French RSA (Revenu de Solidarité
Active), which corresponds to the Portuguese RSI (Rendimento Social de Inserção – Integration and Social Income). In general their work reveals that in most cities for most
households, particularly for families with two or more children, to accept part-time jobs receiving the minimum wage does not compensate when compared to the amount of
social benefits received. Moreover, it was not always financially interesting to accept a full-time job. Through simulation they show that the marginal tax rate of 38% retained by the government is very close to the maximum rate consistent with an incentive to target
a return to employment.
Such a study should be replicated for Portugal but, for now, I present a simple
accountability exercise to give an idea of the incentive to work in the Portuguese social support system. To perform this exercise several assumptions were made: (1) I targeted the active population, (2) 5 types of household composition were considered, (3) the
income if working is computed as minimum wage*14/12 deducted from the social security contribution of 11%, (4) the income if not working is the RSI for the household
5
social transports were based on Lisbon prices, (7) each individual goes twice a year to the hospital, and (9) the 7th grade values were the chosen ones for school related values. Lots
of choices needed to be made but this is just to give an idea of the level of incentive that
there is to work when receiving benefits such as RSI.
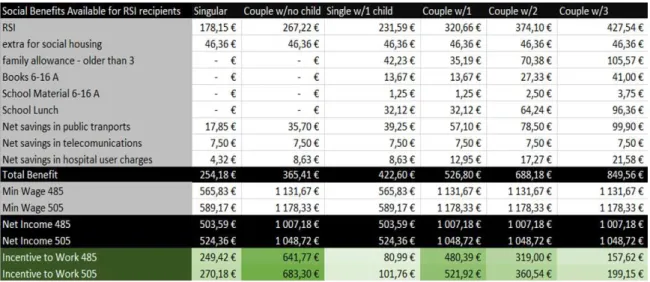
Table 11 presents evidence showing that households that have less incentive to work are
the single parent with one child (€81) followed by the couple with 3 (or more) children (€158). The table shows a small financial gain from being employed. However, it is
important to bear in mind that the magnitude of the incentive is small given that, for this
study, other benefits such as the following were not possible to measure: estimates for water, electricity and gas social tariffs, children support (Kindergarten), local support (strong source of benefits, +20% of total resources, Anne and L’Horty 2012), parallel
1The values on table 1 and on figure 1 are updated accordingly to the applicable legislation (RSI and other
Practical Guides available on the Social Security’s online platform), and the data also comes from a report
of the Entidade Reguladora da Saúde on hospital user charges from 6/2013 and from the price table of
6
economy (would increase the income when not working), costs associated with going to work.
This work starts with a literature review on negative income taxes in other countries and
provides some comparisons among them. Then a more detailed description of the Portuguese case, which indicates who may receive RSI, how much they receive, for how
long and what are the other supports that may be combined with RSI. Afterwards, I provide the theoretical framework, present the data used, explain the methodology applied and expose the findings. The conclusion, besides highlighting the main results,
also discusses further possible research from which solid policy implications may be derived for the Portuguese social support system.
Literature Review
There is an extensive literature about the negative income tax programs and its effect on
work incentives. It has become the benchmark for the modern analysis of means-tested transfer programs.
In opposition to the usual positive income tax, the negative income tax sends money back
to the taxpayer, as a refundable tax credit, but in this case the payment is reduced as income rises. In 1962, Milton Friedman proposed a consistent and explicit negative
income tax. Although the central goal was the work incentive, Friedman highlighted five other advantages to the program. First, it provides support to disadvantaged families based on their income, using an objective criteria and providing a clear target. It is paid
in cash, which is the best form of support in the receiver’s perspective. The negative income tax can eliminate the multiplicity of overlapping programs. Also, it would reduce
7
(conversely to minimum wages or tariffs). Nonetheless, there was still a challenge: what if the negative income tax effect on labor supply run counter its intended work incentives? Moffitt (2003) suggests that the labor supply impact of a negative income tax is
ambiguous. There are many studies for the United States and the United Kingdom that aim to evaluate this issue. Some conclude it has a positive impact on employment (Meyer,
2010; Hotz, Mullin, Scholz, 2001) and several others that conclude that this is not quite the case (Betcherman, Dar and Olivas, The World Bank, 2004).
The effects of the negative income tax on labor supply may differ across places, across
groups (Hotz and Scholz, 2003, found different results depending on the type of household) and across time. For the countries that will be referred there are some points
in common: their negative income tax is targeted at households with few means in which at least one person is working, and has an especial care for households with children.
As for Portugal the RSI (Rendimento Social de Inserção – Integration and Social Income) substituted the RMG (Rendimento Mínimo Garantido – Minimum Income Guaranteed), in the US the EITC (Earned Income Tax Credit) replaced the TANF (Temporary
Assistance to Needy Families). The United States has a tax of this type since 1975. The EITC was first instituted as a small tax credit to reimburse the social security taxes paid
by low-income workers with children (Edin, Tach, and Meekin, 2014). It expanded dramatically since then, especially, with the reforms of 1986, 1990 and 1993. The EITC plays an important role in the lives of the working poor who receive it: almost 27 million
families received $59.5 billion and lifted 6.3 million people out of poverty in 2010 (Center on Budget and Policy Priorities, 2012).
8
FC (Family Credit) was introduced. The WFTC can increase the income of households with at least two children, where just one adult is working full-time at the minimum wage by around 40%.
Accordingly to Cahuc and Zylberberg (2009), the WFTC is more generous than the EITC as it can markedly exceeds the direct wage (by 160% of gross income vs 40%). However,
it is more narrowly targeted, since only 1/20 of the British households benefit from it vs the 1/5 of American households that benefit from EITC.
In 2001, France has also introduced a negative income tax: “premium for employment” (PPE, prime pour l’emploi). This tax credit targets persons whose income from wages
lies in the range from 0.3 to 1.4 times the minimum wage, affecting about ¼ of the
households. The maximum amounts of the premium are very modest and smaller than those of the EITC and the WFTC. They come to less than 5% of declared income which
contrasts strongly with those of the EITC and WFTC, for which the maximum amounts of assistance represent, respectively, almost 40% and 160% of declared income. The negative income tax “à la française”, as it is called, does not target households with
children as much as its British and American counterparts. Therefore, it does stipulate some supplemental payments, but relatively small ones. In its present form, the PPE
distributes small amounts of money to many individuals (remember that practically ¼ households can benefit from it) which contributes to increase the costs of the program. France has not yet learned from the other countries experience the main lesson that it is
necessary to make work pay, and pay well enough, if financial incentives are to have any significant impact on labor market participation and returns to employment (Cahuc and
9 The Portuguese RSI
In 2003, in order to replace the RMG (Law 19-A/96, June 29th), the Portuguese system of benefits suffered a transformation with the introduction of the RSI (Law no. 13/2003). Even though their objective was pretty much the same, “to ensure the individuals and
their households support in order to meet their essential needs and foster social and professional integration”, the RSI was more exigent and detailed, particularly on labor
market participation. After its creation, and throughout the years, RSI went through many changes. There were changes in the eligibility criteria, in the amount received, in the
sanctions imposed, and in the labor market participation and job search duties.
By analyzing the evolution of the number of households receiving RSI (Figure 1), one
may conclude that from all the changes there were 2 major reforms: 2010 and 2012.
RSI underwent a profound transformation in 2010 (DL no. 70/2010, June 16th), when the country was already under the Stability and Growth Pact, which the main goal was to control and decrease public spending. The main objective of this reform was to harmonize
the conditions of access to non-contributory social benefits and to extend its application to all the social support provided by the state where the access had underlying the
10
of a capitation among the ones defined by the OECD (that depends on the composition of household members and takes into account the existence of economies of scale within them). Also, this reform increased the penalty for false statements from which resulted
improper benefits. The so called activation measures were also created. They required that all recipients between 18 and 55 who were not in the labor market, but were able to
be, were to be covered by measures of recognition and validation of school and professional skills, by measures of training, education or approach to the labor market, within a maximum period of six months after the subscription in the integration program.
This legislation defines and details the condition of resources, presenting much more restricted levels of income. This reform was more restrictive in terms of labor market
proactivity, as it decreed that the allowance would cease if the beneficiary denied convenient employment, socially necessary work or professional training.
As the crisis became accentuated, in May 2011 it was signed the Economic Adjustment Program for Portugal. The country’s situation originated another major reform on RSI in
2012 (DL no. 133/2012, June 27th). It presented a considerable reduction in the amount
received by adults not head of the household and children. The obligations of the RSI receivers became even more demanding and restrictive. The sanctions became, also, more
severe so that the individuals became more accountable for its actions. Moreover, this law gave even more attention to the incentives to work and to the duty of search for a job. In the present, the eligibility criteria to apply to RSI comprises the following conditions:
to be 18 years old or older (younger in certain exceptional cases), to have residency in Portugal for at least a year (citizens outside the EU more than 3 years), to be in serious
11
integration, to be enrolled in the employment center in the residency area if the individual is unemployed and able to work, not being in preventive detention or serving a sentence in a prison, not being institutionalized in facilities financed by the state. The RSI can be
received during 12 months, with possibility of renewal. The value of the RSI received by the head of household is €178,15. Each adult after the first receives €89,07 (50% of RSI)
and each children gets €53,44 (30% of RSI). When working, 80% of the individuals wage is considered to determinate the amount received. The RSI has the particularity of being possible to accumulate with the following supports: pension for old age, social disability
pension, widowhood pension, pension of orphanhood, complement for dependence, solidarity complement for the elderly, allowance for housing rents, bonus for disabled
individuals, allowance for assistance to a 3rd person, allowance for attendance at special education, family allowance, parental allowance, parenting and adoption subsidies,
sickness allowance and unemployment benefit.
RSI is constantly changing with small annual changes. More restrict criteria of access, designed to fight fraud and simplify supervision, and more demanding proactivity in
terms of the labor market participation are the main changes.
Theoretical Framework
In Graph 1 two budget constraints are presented. BCworking is represented by a negatively
sloped line, since the less the individual works the less he receives (lower earnings). The other is the budget constraint when the individual is eligible to receive RSI. BCRSI, is not
represented as a straight line. In point C the individual does not work (L4) receiving only
the RSI amount (Y4). However, as we move to the left, the hours worked increase and the
12
income tax rate of 80%. If the individual is an RSI beneficiary and works simultaneously, 80% of his earnings is deducted from the RSI amount that he would receive. For instance, in point B the individual collects the amount correspondent to RSI plus 20% of his
earnings (Y3). This individual has incentive to work but it is rather small given the curve’s
small slope. Instead of a straight line with a small slope, the American EITC presents a
concave curve, making it much more likely that an individual's utility-maximizing bundle will include some hours of work.
In point A, the individual could receive Y1 but receives only Y2 due to the implicit labor
income tax rate of 80%. In this case the individual prefers to work without being in the
program.
For the highest levels of hours worked the line is parallel to the one of the market, along which the individual does not receive RSI since he receives a higher wage associated to
more working hours.
Data
13
These are the most recent datasets available, which take into account several changes in RSI criteria and one of the two major reforms - the 2010 reform.
The dataset has a longitudinal dimension since individuals are identified by a unique
number which allows them to be followed over time.
The dataset used for this work was built by assembling the variables of interest disperse
on the other databases. The dataset includes the RSI duration and the first monthly amount of the cash benefit. The dataset also contains some information about the RSI beneficiaries, in order to build their profile. Descriptive information on these variables is
provided in the Appendix -Table 2.
The sample which will be used is only restricted by the exclusion of the individuals who
started receiving RSI before 2005. The resulting sample size is 12.516 individuals. This dataset samples those who start receiving RSI during the particular interval
2005-2012 and allows us to observe how long they received this benefit in this time window. This sampling plan is referred to as (in)flow sampling, and it is defined as a collection of data based on a random sample of all persons that became RSI receivers, and were
followed until 2012.
A survival time is censored if it is only known the beginning or the end within some
particular interval of time and, thus, the total spell length (from entry time until transition out of RSI) cannot be identified. Most observations are complete but others are right censored, in which cases the spell end date is unknown. This is because some of these
individuals left RSI during the observed period but others did not and, thus, it is not possible to know when their transition out of RSI occurred, if it ever did.
14
as for the case in question, the spell lengths may be summarized using a set of positive integers. Therefore, the observations on the transition process can be presented discretely rather than continuously. Although the underlying transition process may occur in
continuous time, the data are not observed/provided in that form. This will be important to make the correct specification of the hazard and survival functions.
Methodology
The methodological approach is described following closely Jenkins (2005).
In this work the data is discrete given that, although the underlying survival is in
continuous time, spell lengths are interval-defined. Hence, the time axis is partitioned into several contiguous non-overlapping intervals, which in this case are months, where the
interval boundaries are the dates: 𝑎0 = 0, 𝑎1, 𝑎2, … , 𝑎𝑘.
The discrete hazard rate is defined as follows: ℎ(𝑎𝑗) = Pr(𝑎𝑗−1< 𝑇 ≤ 𝑎𝑗|𝑇 > 𝑎𝑗−1),
where j indicates the interval and T represents the length of a spell for a subject and is a continuous random variable. It gives the probability of exiting RSI at t, given that the
individual was an RSI beneficiary until then.
The discrete time survivor function, written in terms of interval hazard rates, is defined
as:
𝑆(𝑗) ≡ 𝑆(𝑗) = (1 − ℎ1)(1 − ℎ2) … (1 − ℎ𝑗−1)(1 − ℎ𝑗) = ∏(1 − ℎ𝑘) 𝑗
𝑘=1
where 𝑆1is the probability of survival (still receiving RSI) through interval 1, 𝑆2 is the
probability of survival through interval 2, given survival through interval 1, and so on.
15
will be performed. The proportional hazard rate can be factored into separate functions of:
ℎ(𝑗|𝑋𝑖) = ℎ0(𝑗)𝑒𝑥𝑝(𝑋𝑖, 𝛽′) = ℎ0(𝑗)𝜆𝑖
where ℎ0(𝑗) is the baseline hazard (when covariates are all zero) and a function of t alone
and 𝑒𝑥𝑝(𝑋𝑖, 𝛽′) is a function of X alone. All ℎ(𝑗|𝑋𝑖) of this form are proportional to the
baseline hazard, with scale factor 𝑒𝑥𝑝(𝑋𝑖, 𝛽′).
The fact that the baseline hazard is completely unspecified can be an advantage because
we avoid misspecification problems of choosing the wrong shape, but it can also be a disadvantage if one is particularly interested in the shape of the baseline hazard function.
We will also estimate the survivor using the Kaplan-Meier method.
To consider the possibility of exiting to two destination states a competing risks model will be used. For the case in analysis, the individuals that receive RSI may exit because
they found a job, leaving to work, or for of any other reason, leaving to not employment. Given the above relationship between the hazard and the survivor functions the following
expression arises: 1 − ℎ(𝑗|𝑋𝑖) = [1 − ℎ0(𝑗)]exp (𝑋𝑖, 𝛽′). This leads to the clog-log
hazard function:
ℎ(𝑗|𝑋𝑖) = 1 − [1 − ℎ0(𝑗)]exp (𝑋𝑖, 𝛽′).
This work incorporates the possibility of defective risks, meaning that some individuals may stay in RSI forever. In order to do this, the survival function needs to be redefined
representing the proportion of individuals that did not terminate until t as 𝑆̃(𝑡) = (1 − 𝑝) + 𝑝𝑆(𝑡), where p is the proportion of individuals that face the risk of
stopping receiving RSI. The survival probability is given by the proportion of long-term survivors 1-p, which do not exit to a one of the two destinations with probability 1, plus
16
probability of remaining in RSI until t, S(t). The maximization of the likelihood function producing estimates for one additional unknown parameter p for each mode of termination. The generalization to multiple independent risks is straightforward. The
maximization of the likelihood function producing estimates for one additional unknown
parameter p lies between zero and one, the logit reparametrization for 𝑝 = exp(𝜇) /[1 + exp(𝜇)] was employed.
Finally, the Zero-Inflated Poisson model performed to study recurrence is described in
the Appendix.
Findings
Let us start this section with a description of the profile of RSI beneficiaries. Taking into
account the 12.516 individuals that received RSI at least once, the sample shows that almost 94% of the receivers are Portuguese and 70% are women. 73% of RSI recipients
have less than 45 years old when they receive RSI for the first time. More than a half of RSI households are constituted by less than three individuals and 20% are constituted by 4. More than 70% of the households do not have children with 3 or less years of age, 24% have 1 and almost 5% have 2 young children.
The maximum duration of RSI payments in the analyzed period is 79 months and 53% of RSI receivers stays for more than a year. The data allows us to see that the duration
verified more often is 12 months (but only 10% of the individuals), meaning that these individuals receive RSI for a year, which is interesting especially if we remember that
renovations, and therefore the re-evaluation of the individual’s situation, are done annually.
The Kaplan-Meier survival estimates (Figure 2) show a small difference between genders.
17
period after the 4th quarter of 2005 changes on RSI. Although this was not a major reform, it may have contributed to the survival’s decrease. Also, this survival function does not converge to zero, which arises suspicions about these individuals staying in RSI for long
periods – long term episodes. This feature will be developed below.
According to the Cox model regression results (Table 3), an increase of 10% on the amount of RSI received by the beneficiaries corresponds to a decrease of 2,9% of the hazard, as it was expected since the higher the amount the smaller the incentive to leave
RSI. Hence, the estimated hazard elasticity with respect to the amount of RSI received is -0,29.
As exposed above, the RSI amount changes with the type of household. The present rule presents a value for the head of household, another for the following adults and other for minors. The rule changed slightly over the years but the values were updated many times.
This explains why the dimension of the household is controlled for in the regression. Therefore, the value of this elasticity may be interpreted as the income effect on the
18
Regarding age, one more year decreases the hazard in 0,9%, meaning that the older the individuals are the longer they receive RSI. In terms of gender, if the individual is male, the conditional probability of leaving RSI increases 5,9%. Another notable result is that
one more person in the household decreases the hazard by 5,5%. This is evidence that the larger the household the longer it stays receiving RSI. In terms of the number of children,
if the household has one more children with less than 3 years old, the hazard decreases almost 21%, telling us that having young children increases the time of the household receiving RSI. Also, if the receiver is Portuguese, the hazard decreases 30%, which
implies that Portuguese individuals stay on RSI longer.
Long term episodes (Table 4) will now be the focus. Two possible destinations were
considered when exiting RSI: to move to employment or to other state that not employment (two competing risks). From those who exited RSI during the period in
Table 3.
Cox Regression
Male 0.059**
(0.026)
Age -0.009***
(0.001)
Log_RSI -0.292***
(0.014)
Members -0.055***
(0.008)
Children -0.212***
(0.023)
Portuguese -0.299***
(0.050)
Log L -60242.889
Standard errors in parentheses.
***p<0.01, **p<0.05, *p<0.1.
19
analysis (74% of the whole sample), only 38% found a job. The estimates of the competing risks model reveal that the amount of RSI received decreases the hazard, especially for the group of individuals that moves to employment. Thus, for both groups,
the estimated hazard elasticity with respect to the amount of RSI received is negative. The elasticity is –0.41 for those who move to employment and, -0.30 for those who move
to joblessness. This was expected since the higher the amount, the smaller the incentive to leave RSI, either to the ones who move to employment, or to the ones who do not.
It also reveals that if the individual is male the hazard increases for both groups, but it increases much more for the group that does not move to employment. A higher number
Table 4.
Work Not Work
Male 0.010 0.129***
(0.056) (0.035)
Age 0.109*** -0.026***
(0.014) (0.006)
Agesq -0.002*** 0.000***
(0.000) (0.000)
Log_RSI -0.413*** -0.302***
(0.027) (0.019)
Members -0.149*** -0.037***
(0.019) (0.011)
Children -0.184*** -0.268***
(0.049) (0.032)
Portuguese -0.270*** -0.371***
(0.101) (0.067)
Log_dur 0.130*** 0.314***
(0.028) (0.020)
Constant -2.127*** -2.089***
(0.308) (0.170)
Prob. Never Fail) 0.443 0.054
(0.018) (0.013)
Log L -13645.302 -21818.123
Standard errors in parentheses.
Singnificance levels: ***p<0.01, **p<0.05, *p<0.1. Number of Observations: 12516
20
of members in the household and of young children (less than 3 years old) decreases the hazard for both groups.
For both groups the duration dependence is positive, but higher for the group of
individuals that do not move to employment. This means that when duration increases, the probability of exiting RSI to other destination that not employment increases, and
increases more for those who do not exit to employment. The positive duration dependence might be due to the 12 months evaluation for renewal purposes, or to the tightening of the eligibility and labor market participation criteria that, each year,
becomes more and more demanding.
Furthermore, this analysis tells us that the probability of never exiting to employment is
44% (probability of long term survival), which is much higher than the probability of exiting for joblessness, only 5%.
An additional feature of this work regards recurrence. The Zero-Inflated Poisson model (Table 5) is explained in the appendix and, it is the indicated to see how the variables in analysis influence recurrence. From it one concludes that if the value of RSI increases
1%, recurrence tends to decrease 0,4%. In the regression non-linear effects of age were noticed. The probability of recurrence is maximum at 36 years old and men tend to return
less than women to RSI. If the beneficiary is Portuguese reoccurrence tends to increase relatively to other nationalities. When the number of members in the household increases by one unit the recurrence tends to decrease 2,8% and if there is one more children
younger than 3 years old in the household decreases the conditional mean of recurrence by 5,4%. Nevertheless, remember that these types of households, the ones with more
21 Conclusion
The aim of income support programs, such as the Portuguese RSI, is to support disadvantaged households and promote their integration in the labor market. Although, if
the design of the programs is not adequate, their purpose may not be achieved.
Regarding the recurrence analysis, evidence was found that the larger households, or with
more young children, receive RSI longer but, once exit, they do not usually return. This work reveals that the main RSI duration determinant is the amount of benefit received. The results presented a negative hazard elasticity with respect to the amount of
RSI received, for both groups. This was predictable since the higher the amount, the smaller the incentive to leave RSI. The amount of RSI received decreases the hazard,
Table 5.
Zero-Inflated Poisson
Male -0.432***
(0.053)
Age 0.072***
(0.012)
Agesq -0.001***
(0.000)
Log_RSI -0.004
(0.025)
Members -0.028*
(0.015)
Children -0.054
(0.040) Portuguese 0.395***
(0.108)
Log_dur -2.336***
(0.280)
Log L -6598.221
Standard errors in parentheses.
***p<0.01, **p<0.05, *p<0.1.
22
especially for the group of individuals that moves to employment, presenting an elasticity of -0,41.
The following arguments lead to the answer of the central question of this work. Firstly,
remember that more than a half of the individuals stays receiving it for more than a year. Secondly, the defective risks model results showed that the probability of never exiting
to employment is much higher than the probability of never exiting for other reason. This means that often, when individuals leave RSI they do not find a job. They may be jumping between benefits. These individuals are behaving in a rational way, by maximizing their
utility where they earn more with less effort. When evaluating possible policies that make work pay, policy makers need to take into account such strategies.
Therefore, for the Portuguese case, the results obtained show that RSI affects negatively transitions to employment. Namely, the implicit labor income tax rate (80%) does not
appear to be adequate as it does not produce the desirable effects on the Portuguese labor market. This indicates that changes need to be made regarding RSI design. The example of the United States was above mentioned as a possible alternative.
Policies that make work pay are not the perfect solution for joblessness but, if well designed, such policies can be an efficient way of improving the society’s welfare, as well
as the situation of the unemployed in particular.
To pursue any welfare reform in a solid basis, along with the choice of the minimum income guaranteed and the negative income tax rate, it is required that one knows the
distribution of the population and its elasticity of labor supply as well as a particular social welfare function. Most of this knowledge is still uncovered.
23
probability of never leaving RSI to employment, while the unemployment rates achieved worrying levels? What happened to RSI duration? Did the hazard elasticities with respect to the benefit amount change? How? These would be some of the questions that I would
also like to answer.
A possible road that I would like to explore further is to simulate what would be the ideal negative income tax rate based on a work similar to Anne and L’Horty (2012).
Nevertheless, this work is a first step in a long journey that Portugal needs to engage in to improve its social support system. Policy makers should not forget what is already done and the other country’s examples, namely the United States model vs France, in order to
24 APPENDIX
Zero-Inflated Poisson Model
A count model was used to check the probability of the individuals going back to RSI: reoccurrence. The dependent variable is a count variable since it is the number of spells. It is more accurate, for estimation purposes, to use the zero-inflated poisson model given the excess zero problem of the data, once many only received RSI once.
It comprises two components, each corresponds to a zero generating process. The first
process is underlined by a binary distribution that generates structural zeros, as the second follows a poisson distribution that generates counts, some of which may be zero. The two
model components are described as: Pr(𝑦𝑗 = 0) = 𝜋 + (1 − 𝜋)𝑒−𝜆
Pr(𝑦𝑗 = ℎ𝑖) = (1 − 𝜋)𝜆ℎ𝑖𝑒
−𝜆
ℎ𝑖! , ℎ𝑖 ≥ 1
where the outcome variable 𝑦𝑗 has any non-negative integer value, 𝜆 is the expected
Poisson count for the ith individual; 𝜋 is the probability of extra zeros.
Table 2 – Descriptive Statistics
Variable Mean St. Deviation Proportion
If male 0.300 0.458 30.06%
If Portuguese 0.943 0.232 94.29%
Variable Mean St. Deviation
First_RSI (€) 209.331 141.778
Variable Mean St. Deviation Mode
Age (years) 37.699 12.177 41
Duration (months) 20.401 17.310 12
Members (number) 3.102 1.659 3
25 References
Anne, Denis, and Yannick L'Horty. "The RSA (Revenu de solidarité active) and back‐to‐
work incentives in France." International Social Security Review 65.3 (2012): 77-100. Betcherman, Gordon, Amit Dar, and Karina Olivas. Impacts of active labor market programs: New evidence from evaluations with particular attention to developing and
transition countries. Social Protection, World Bank, 2004.
Cahuc, Pierre, and André Zylberberg. "The natural survival of work: job creation and job
destruction in a growing economy." MIT Press Books 1 (2009).
Edin, Katharine, Laura Tach, and Sarah Halpern‐Meekin. "Tax Code Knowledge and
Behavioral Responses Among EITC Recipients: Policy Insights from Qualitative Data."
Journal of Policy Analysis and Management 33.2 (2014): 413-439.
Hotz, V. Joseph, Charles H. Mullin, and John Karl Scholz. "The earned income tax credit and labor market participation of families on welfare." Poverty Research News 5.3
(2001): 13-15.
Hotz, V. J. and K. Scholz. 2003. “The Earned Income Tax Credit.” In Means-Tested
Transfer Programs in the United States, ed. R. Moffitt. Chicago: University of Chicago Press.
Jenkins, Stephen P. "Survival analysis." Unpublished manuscript, Institute for Social and
Economic Research, University of Essex, Colchester, UK (2005).
Meyer, Bruce D. "The effects of the Earned Income Tax Credit and recent reforms." Tax