Article
Printed in Brazil - ©2018 Sociedade Brasileira de Química*e-mail: [email protected]
Analytical Method Development for Fatty Acid Direct Methylation in Fruits
PatríciaD.S.Santos,a,bRobertadaSilveira,c,dNatáliaV.Reis,bJesuíV.Visentainera,band
OscarO.Santos*,a,b
aPrograma de Pós-Graduação em Química, Universidade Estadual de Maringá,
Av. Colombo, 5790, 87020-900 Maringá-PR, Brazil
bDepartamento de Química, Universidade Estadual de Maringá,
Av. Colombo, 5790, 87020-900 Maringá-PR, Brazil
cPrograma de Pós-Graduação em Ciência dos Alimentos, Universidade Estadual de Maringá,
Av. Colombo, 5790, 87020-900 Maringá-PR, Brazil
dDepartamento de Ciência dos Alimentos, Universidade Estadual de Maringá,
Av. Colombo, 5790, 87020-900 Maringá-PR, Brazil
Due to the amount of pigments, sugars and fibers found in fruits, the fatty acid quantification process leads to errors, such as its amount underestimation in the matrix. Therefore, the proposed method allows performing experiments in shorter time with reduced amount of sample and reagent. Design Expert software was used to find the validated time for alkaline and acidic reactions, which were six and eight minutes, respectively, and both concentration was 0.5 mol L-1. The validation was made for avocado pulp and different fruits were used for application of the method, such as: apple, mango, coconut and another avocado variety. Accuracy values ranged from 89.05 to 100.21%, being in accordance with acceptable values. Also the relative standard deviation (RSD)intra-day (0.30 to 1.30%) and the RSDinter-day values (0.32 to 1.44%) confirmed that the proposed method for fatty acid derivatization has good precision.
Keywords: lipids, direct derivatization, ultrasound
Introduction
Chemical composition of fruits varies according to species, cultivar, production place, edaphoclimatic factors, cultural treatments, degree of maturation, and harvest season. Due to the health benefits, there is an increase in
the consumption of fresh fruits by the population.1
A m o n g t h e m o s t c o n s u m e d f r u i t s , avo c a d o
(Persea americana Mill) is highlighted since studies
have been showing that the extracted oil is significant to prevent cardiovascular diseases, due to the high amount of
monounsaturated fat, such as oleic acid.2
Lipid extraction is an essential determination in the characterization of raw material; nevertheless, obtaining this fraction requires attention, such as the usage of cold
extraction method to avoid lipid degradation.3
The Bligh and Dyer4 method is widely used and it is
carried out in room temperature in order to not degrade,
consequently preventing oxidation reactions. This methodology was developed specifically for fish with 1% lipid and 80% moisture; however, it is used for food in general, which may not lead to an entirely extraction of
lipid material in sample.5
Triacylglycerols (TAG) are the main constituent of the lipid fraction of food, these compounds have an elevated boiling point (about 380 °C), which in order to be analyzed by gas chromatography (GC), it is necessary to be converted into more volatile substances, such as methyl esters of
fatty acids.6
A correct method that deserves attention is the direct esterification without the previous extraction of lipids, because smaller amount of solvent and sample are applied, as well as the reduction of steps to avoid or reduce
experimental errors.5 However, esterification time, sample
mass, catalyst, and esterifying reagent concentration affect the technique final result, being necessary the optimization of these factors.
fatty acids (FA) methylation method in fruit samples using response surface methodology.
Experimental
Reagents, materials and instruments
Chloroform, methanol, n-heptane, sulfuric acid and
hydrochloric acid were used without further purification and purchased from Millipore Sigma (Darmstadt, Germany). A mixture of fatty acids methyl esters (FAMEs, 189-19) and methyl tricosanoate (PI, 23:0 me) were also purchased from Millipore Sigma (St. Louis, MO, USA).
The butter variety avocado (Persea americana Mill) was
obtained from local market (Maringá City, Paraná State, Brazil). Two kilograms of the avocado were washed in chlorinated water, cut in half to remove the seed, the pulp was removed with a spoon, homogenized in a knife mill, packed in vacuum polyethylene bags and kept in the freezer at –18 °C until analysis.
Gas chromatography with flame ionization detector analysis (GC-FID)
Chromatographic analysis was performed on a Thermo
Scientific GC equipped with FID, split/splitless injector
and CP-7420 fused silica capillary column (Select FAME, 100.0 m long, 0.25 mm internal diameter and 0.25 µm thin film of cyanopropyl as stationary phase). Operating parameters are as follow: column temperature of 165 °C
for 18 min, then heated to 235 °C (4 °C min-1) for 20 min.
Injector and detector temperatures were maintained at 230
and 250 °C, respectively. Gas flows were 1.2 mL min-1 for
carrier gas (H2), 30.0 mL min-1 for make-up gas (N2), and in
the FID 30.0 and 300.0 mL min-1 of gas (H
2) and synthetic
air, respectively. The samples were injected in split mode, with 1:40 ratio. Injection volume was 1.0 µL. FAMEs were identified by comparison among the retention time of constituents samples and Sigma FAMEs. Theoretical correction factor was used and calculated to obtain FA
concentrations according to Visentainer,9 and FA amount
was calculated in mg g-1 of sample. FID correction is
necessary because of the magnitude signal generated by
detector in proportion to the number of C+ that are bounded
to hydrogen atoms.10
Analysis of electrospray ionization mass spectrometry (ESI-MS)
Samples were infused into an ESI Xevo Acquity® (Waters, Milford, MA, USA) mass spectrometer with flow
rate of 10.0 µL min-1 to evaluate the efficiency of the proposed
method in comparison to the traditional methodology for lipid extraction followed by methylation. The spectra were
acquired in ratio m/z 500 to 1200 in positive mode. Mass
parameters are as follows: capillary voltage, 3.0 kV; cone gas
flow, 40.0 L h-1; desolvation flow, 600.0 L h-1; desolvation
temperature, 600 °C; and source temperature, 130 °C. Data
were processed using MassLynxTM software.
Triacylglycerols identification was carried out as follows: 100.0 mg of oil was weighed; 6.0 mL of solution containing 4.0 mL of chloroform and 2.0 mL of methanol was prepared, 995 µL of this solution was added into the tube containing sample, 20.0 µL of 0.1% ammonium formate was also added, the tube was agitated until the total oil solubilization and then infused.
Validation parameters
Validation parameters of the method were determined in accordance to guidelines of the International Conference
on Harmonization.11 Figures of merit used were: precision,
accuracy and linearity range, which were obtained with six replicates.
The relative standard deviation (RSD) infer about precision, and the replication was performed in different days. Accuracy was obtained by comparing the results of traditional methodology (TM) with the proposed methodology (PM). Linear range was determined by interpolation of the FA sum obtained by TM in relation to the PM.
Traditional methodology for lipid extraction and esterification / transesterification (TM)
Lipids extractions were conducted according to Bligh
and Dyer,4 approximately 100.0 g of shredded sample
was thawed at room temperature and weighed; 100.0 mL of chloroform and 200.0 mL of methanol were added; the mixture was homogenized for 2 min; 100.0 mL of chloroform was added; the mixture was stirred for 30 s; 100.0 mL of water was added to the mixture aiming the phase separation; mixture was stirred for 30 s; then it was filtered on Whatman No. 1 paper under vacuum and the filtrate was transferred to a funnel of separation. After separation, the organic phase was collected and the solvent was evaporated on a rotary evaporator.
The esterification and transesterification reactions of FA
were performed according to Hartman and Lago7 method
modified by Maia and Amaya.8 Approximately 100.0 mg
of the extracted lipid was weighed in a test tube and added
heated in a boiling water bath for 5.0 min with subsequent cooling in running water; 5.0 mL of esterifying reagent
(NH4Cl/H2SO4/MeOH) was added to the tube; it was again
heated in water bath for 5.0 min and cooled in running water; 4.0 mL of saturated NaCl solution and 5.0 mL of hexane were added; then the tubes were shaken vigorously for 30 s. Lastly, the internal standard (PI, 23:0 me) was added and after phase separation, the upper phase was collected for injection into GC.
Experimental design
A rotational central composite design was generated
by Design Expert® 7 software to evaluate the influence
of acid and alkaline in reactions time, as well as its
concentration (NaOH in methanol and H2SO4 in methanol).
The alkali time levels –1 and +1 were 6.0 to 11.0 min,
respectively, and the acid time levels –1 and +1 were 8.0 to 15.0 min, respectively, while the levels of acid and
alkaline concentration –1 and +1 were 0.2 to 0.5 mol L-1.
The axial points (±α) for rotational system (k < 5) were
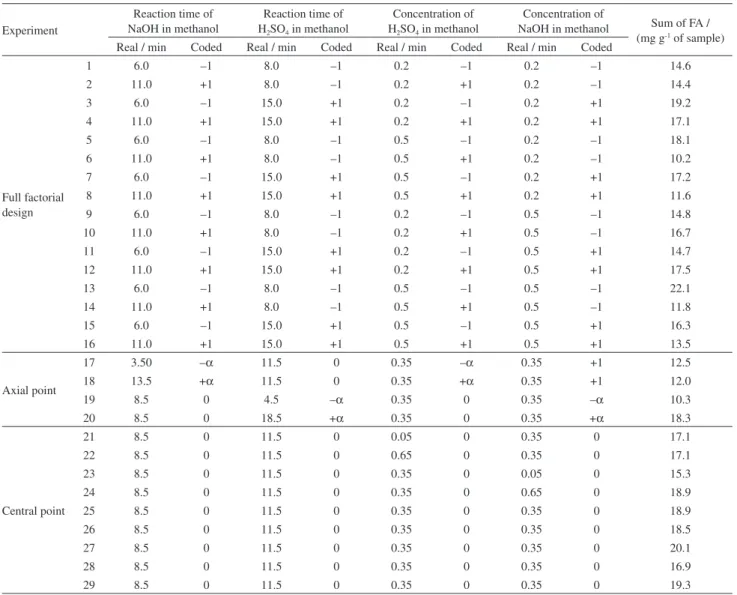
±1.4142, which were used to calculate the quadratic terms, as in Table 1. Five replicates were performed at the central point, totaling 29 experiments.
Proposed method for lipid methylation (PM)
Avocado sample was thawed at room temperature; 100.0 ± 1.0 mg was weighed into a 10 cm test tube; 2.0 mL of NaOH in methanol was added, its concentration being in accordance to the experimental design. Test tubes were placed in ultrasonic bath model Eco-Sonics Q 5.9/25 (Unique, São Paulo, Brazil) with 165 W of power and 25 kHz using different reaction times as determined by
Table1. Factors, levels and sum of fatty acids (FA) for each procedure of the experimental design
Experiment
Reaction time of NaOH in methanol
Reaction time of H2SO4 in methanol
Concentration of H2SO4 in methanol
Concentration of
NaOH in methanol Sum of FA / (mg g-1 of sample)
Real / min Coded Real / min Coded Real / min Coded Real / min Coded
Full factorial design
1 6.0 –1 8.0 –1 0.2 –1 0.2 –1 14.6
2 11.0 +1 8.0 –1 0.2 +1 0.2 –1 14.4
3 6.0 –1 15.0 +1 0.2 –1 0.2 +1 19.2
4 11.0 +1 15.0 +1 0.2 +1 0.2 +1 17.1
5 6.0 –1 8.0 –1 0.5 –1 0.2 –1 18.1
6 11.0 +1 8.0 –1 0.5 +1 0.2 –1 10.2
7 6.0 –1 15.0 +1 0.5 –1 0.2 +1 17.2
8 11.0 +1 15.0 +1 0.5 +1 0.2 +1 11.6
9 6.0 –1 8.0 –1 0.2 –1 0.5 –1 14.8
10 11.0 +1 8.0 –1 0.2 +1 0.5 –1 16.7
11 6.0 –1 15.0 +1 0.2 –1 0.5 +1 14.7
12 11.0 +1 15.0 +1 0.2 +1 0.5 +1 17.5
13 6.0 –1 8.0 –1 0.5 –1 0.5 –1 22.1
14 11.0 +1 8.0 –1 0.5 +1 0.5 –1 11.8
15 6.0 –1 15.0 +1 0.5 –1 0.5 +1 16.3
16 11.0 +1 15.0 +1 0.5 +1 0.5 +1 13.5
Axial point
17 3.50 –α 11.5 0 0.35 –α 0.35 +1 12.5
18 13.5 +α 11.5 0 0.35 +α 0.35 +1 12.0
19 8.5 0 4.5 –α 0.35 0 0.35 –α 10.3
20 8.5 0 18.5 +α 0.35 0 0.35 +α 18.3
Central point
21 8.5 0 11.5 0 0.05 0 0.35 0 17.1
22 8.5 0 11.5 0 0.65 0 0.35 0 17.1
23 8.5 0 11.5 0 0.35 0 0.05 0 15.3
24 8.5 0 11.5 0 0.35 0 0.65 0 18.9
25 8.5 0 11.5 0 0.35 0 0.35 0 18.9
26 8.5 0 11.5 0 0.35 0 0.35 0 18.5
27 8.5 0 11.5 0 0.35 0 0.35 0 20.1
28 8.5 0 11.5 0 0.35 0 0.35 0 16.9
29 8.5 0 11.5 0 0.35 0 0.35 0 19.3
experimental design, see Table 1. After alkaline reaction
time, 2.0 mL of H2SO4 in methanol was added, its
concentration is also in accordance to the experimental design; test tubes were placed in ultrasonic bath for a time previously determined by experimental design; 1.0 mL
of n-heptane was added; tubes were shaken for 30 s; then
centrifuged at 2000 rpm for 1.0 min. Thereafter, 500 µL of internal standard (PI, 23:0 me) was added and the upper phase was collected for injection into GC.
Results and Discussion
Experimental design
Table 1 displays the results of FA sums of the avocado pulp for each experimental design procedure.
The highest results correspond to the experiment
13 with FA sum of 22.1 mg g-1 of sample. Results were
obtained using the same concentration of H2SO4 and NaOH
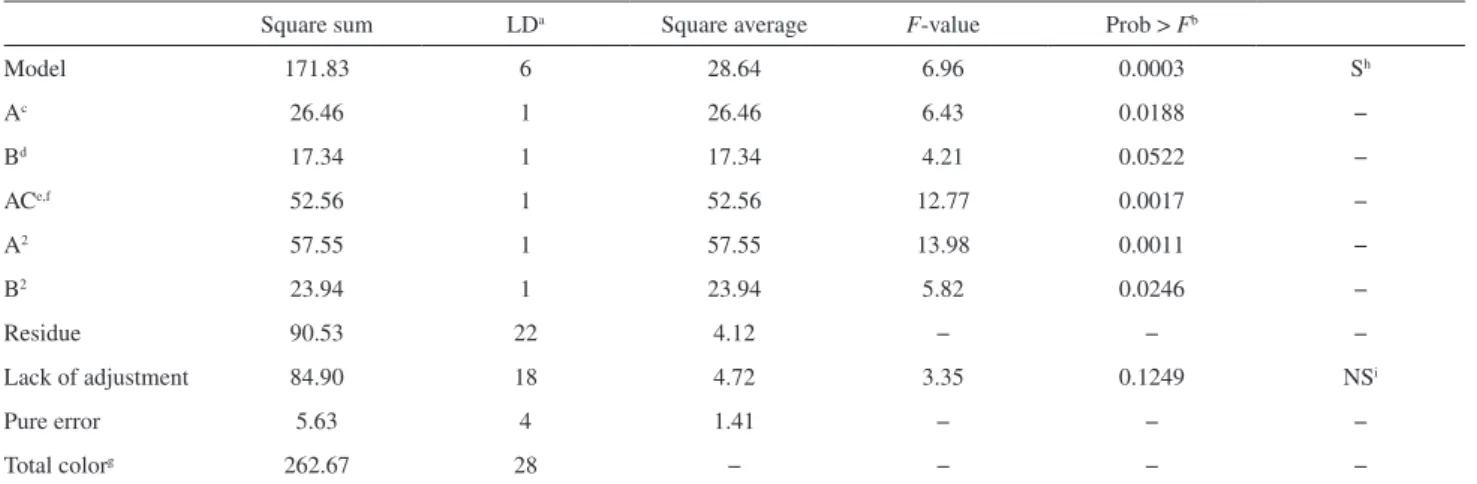
in methanol, conversely, with different times of alkaline and acid reactions. In order to clarify the obtained model and the interactions between factors, the results were evaluated by the analysis of variance (ANOVA) and the response surfaces generated by Design Expert. Among the models indicated by the software (linear, and interaction between two factors (2FI)), 2FI was chosen as the most appropriate due to its high order of significance, low lack of fit, and reasonable agreement between the correlation coefficient obtained and the predicted correlation coefficient for the model. ANOVA parameters are listed in Table 2.
F-Value of the model was 6.96 indicating that it is
significant. There is only 0.03% of chance that F-value of
the model could occur due to noise. Values less than 0.500
indicate that the model terms are significant, values greater than 0.100 indicate that the model terms are not significant.
The lack of adjustment of F-value (3.35) implies that it
is not relatively significant for pure error. There is 12.49%
of chance that F-value for lack of adjustment is greater
than noise.
Correlation coefficient (R2, 0.8165) and coefficient
of variation (CV, 12.65%) values indicate that the model obtained is satisfactory.
The model was adjusted based on real values as factor functions studied and indicated in equation 1:
FA sum = 18.0 – 1.0(A) + 0.8(B) – 1.8(AC) – 1.4(A2) –
0.9(B2) (1)
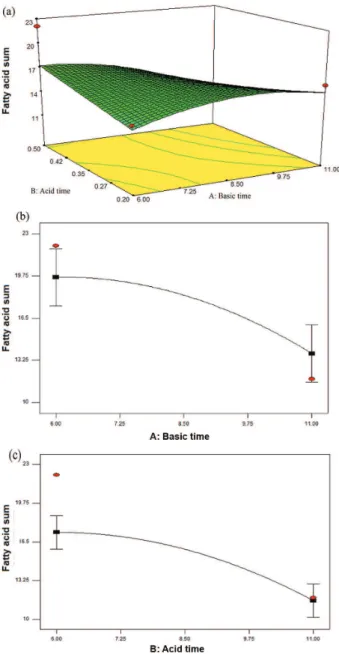
Figure 1a demonstrates the level of acid time while time decreases and acid concentration increases, implicating the highest FA sum. As the acid concentration decreases, the FA sum is reduced since the acid concentration was not efficient to make the methylation reaction occur. For reagent
concentration greater than 0.50 mol L-1, saponification
reaction favors the reduction of TAG amount available for transesterification. Higher amounts of soap produced difficult the separation of glycerol from methyl esters, reducing FA sum.
Figure 1b illustrates the quadratic effect of acid time in relation to FA sum, increasing with the decrease of time
until 8.0 min, providing maximum yield of 22.06 mg g-1 of
sample; the reasons were already mentioned before. Figure 1c shows the quadratic effect of alkaline concentration in relation to FA sum, providing a maximum
yield of 22.1 mg g-1 of sample, for reasons previously
mentioned.
Table2. ANOVA parameter models for proposed methodology (PM) in avocado sample
Square sum LDa Square average F-value Prob > Fb
Model 171.83 6 28.64 6.96 0.0003 Sh
Ac 26.46 1 26.46 6.43 0.0188 −
Bd 17.34 1 17.34 4.21 0.0522 −
ACe,f 52.56 1 52.56 12.77 0.0017 −
A2 57.55 1 57.55 13.98 0.0011 −
B2 23.94 1 23.94 5.82 0.0246 −
Residue 90.53 22 4.12 − − −
Lack of adjustment 84.90 18 4.72 3.35 0.1249 NSi
Pure error 5.63 4 1.41 − − −
Total colorg 262.67 28 − − − −
aLD: degree of freedom; bProb > F: probability value associated with F value; cA: reaction time of NaOH; dB: reaction time of H 2SO4;
eC: concentration
Model optimization
In order to optimize PM conditions, parameters of concentration and reaction time, both acid and alkaline, were restricted to values that were sufficient for methylation, since reaction efficiency is essential. With these established criteria, Design Expert predicted the optimum point parameters of 6.00 min for alkaline reaction time and 8.00 min for acid reaction time, and for concentrations the optimum point for acid and alkaline was
0.5 mol L-1, consequently the maximum value obtained with
these data was FA sum of 22.16 ± 2.80 mg g-1, being higher
than TM, which was 21.27 ± 3.01 mg g-1.
Another significant aspect is that the PM reduces the amount of sample and reagents consumed, and the sample preparation for GC analysis became faster, cheaper and with less environmental aggression when compared to TM.
Evaluation of the efficiency of the methylation reaction by ESI-MS
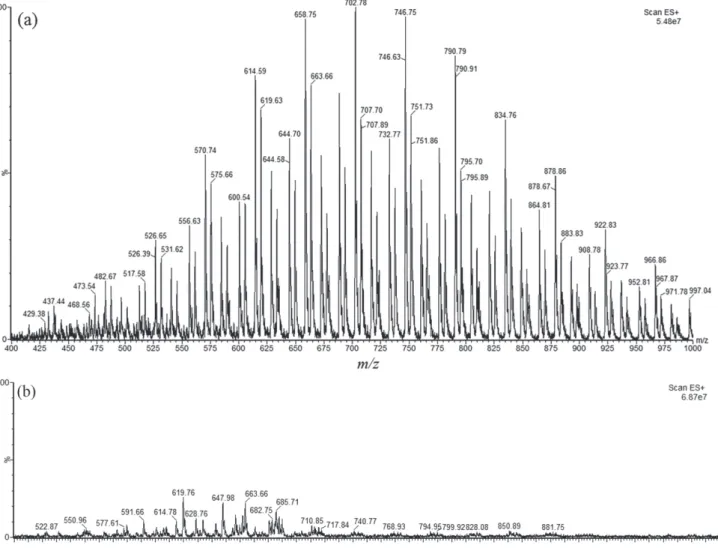
ESI-MS analysis (fingerprinting) by direct infusion was carried out in order to identify secondary metabolites present in extracted oils from avocado pulp, as well as to evaluate TM efficiency in comparison to PM of lipid extraction, esterification and transesterification. Figure 2a displays the mass spectra of the oil extracted from avocado, while Figures 2b and 2c display the mass spectra of non-esterified compounds by PM and TM, respectively.
The main TAGs identified in extracted oil were:
triacylglycerol 15:1-15:1-15:1 (m/z 776.74), triacylglycerol
12:0-17:1-17:2 (m/z 790.79), triacylglycerol 16:0-16:0-18:0
(m/z 834.76), triacylglycerol 17:0-17:0-17:1 (m/z 864.81),
triacylglycerol 17:0-17:1-18:0 (m/z 878.60), triacylglycerol
18:0-18:0-18:0 (m/z 908.78), triacylglycerol 18:0-18:0-18:1
(m/z 922.83).
Figure 2b represents the amount of non-esterified compounds by PM, while Figure 2c represents the amount of non-esterified compounds by TM, and, as can be observed, PM presented a lower amount of it in comparison to TM. The major diacylglycerols (DAG) detected as non-esterified products were lower in PM, as
can be seen in Figure 2b. In [DAG]+ form, it was detected
compounds with m/z 600.73 (16:0 + 17:0), 605.71
(17:0 + 17:0), 647.73 (18:0 + 18:0), 656.86 (17:0 + 20:0), 680.67 (17:2 + 22:0), 682.81 (18:0 + 21:0) and 740.71 (21:0 + 22:0). TAG amount detected for PM was inferior
than TM. For PM, the [TAG]+ encountered were 827.64
(15:0 + 18:1 + 15:0) and 879.04 (16:1 + 18:0 + 18:0), while
for TM the [TAG]+ were 768.93 (12:0 + 12:0 + 20:0),
796.96 (12:0 + 16:0 + 18:0), 822.98 (16:0 + 16:0 + 16:1) and 877.03 (17:0 + 17:2 + 18:0).
The non-esterified products in PM were inferior; it can be observed through the results obtained by GC-FID, since
PM sum was 22.16 ± 5.80 mg g-1 of sample, while TM
sum was 21.27± 5.84 mg g-1 of sample. Therefore, results
are consistent once in TM is necessary to make a previous lipid extraction, and during this extraction, other non-lipid compounds, which have affinity with the solvents employed, can be also extracted. In PM it does not occur because the esterification and the transesterification are performed directly in the matrix, minimizing the errors.
Fatty acid analysis
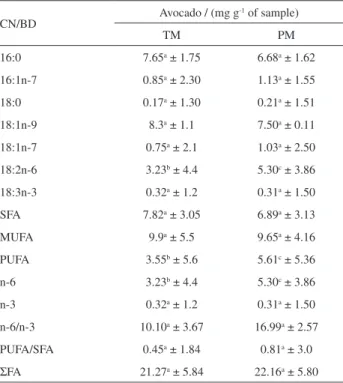
Table 3 expresses the results of FA quantification for avocado pulp carried out by traditional extraction, esterification and transesterification methodology in comparison to PM.
Avocado presents high humidity, fibers, sugars, as well as soluble pigments that difficult the lipids extraction by TM, obtaining considerable deviations in the results. In this
way, results obtained by PM in avocado samples caused a reduction of these procedural errors, due to the withdrawal of some steps. Consequently, PM was very effective when applied to avocado pulp.
Avocado oil is constituted mainly of monounsaturated fatty acids (MUFA, 60%), saturated fatty acids (SFA, 29%) and a significant amount of polyunsaturated fatty acids (PUFA, 11%). The application of the proposed method in avocado oil influenced, mainly, the concentration of
18:2n-6 FA and, consequently, PUFA and n-6, which presented significant difference.
Application of the proposed method using different samples
Table 4 expresses the results of FA quantification for coconut, banana, apple, mango and another avocado variety, carried out by traditional extraction, esterification and transesterification methodology in comparison to PM.
Fruits containing 1% of lipid content, such as mango, banana and apple, the PM is not applicable, that could be explained by the small amount of sample or the non-sufficient reagent concentration, implying in the not occurrence of methylation, which means that the sample is diluted, consequently, the fatty acids amount identified by GC-FID for PM is lower than TM.
The reduction of procedural errors in the analysis because of the shortened process resulted in better results for avocado and coconut samples in the PM, since in PM it is not necessary the previous lipids extraction causing reduction in the amount of solvent and sample in comparison to TM.
Therefore, PM can be applied to fruits with a lipid percentage greater than 5%.
Method validation
Accuracy values ranged from 89.05 to 100.21% being
in accordance with acceptable values. RSDintra-day (0.30 to
1.30%) and RSDinter-day values (0.32 to 1.44%) revealed
that PM for FA derivatization has good precision; usually in analysis methods the RSD estimation values should be
below 20%.12
Table3. Fatty acids quantification by traditional extraction, esterification and transesterification methodology in comparison to proposed method
CN/BD Avocado / (mg g
-1 of sample)
TM PM
16:0 7.65a ± 1.75 6.68a ± 1.62
16:1n-7 0.85a ± 2.30 1.13a ± 1.55
18:0 0.17a ± 1.30 0.21a ± 1.51
18:1n-9 8.3a ± 1.1 7.50a ± 0.11
18:1n-7 0.75a ± 2.1 1.03a ± 2.50
18:2n-6 3.23b ± 4.4 5.30c ± 3.86
18:3n-3 0.32a ± 1.2 0.31a ± 1.50
SFA 7.82a ± 3.05 6.89a ± 3.13
MUFA 9.9a ± 5.5 9.65a ± 4.16
PUFA 3.55b ± 5.6 5.61c ± 5.36
n-6 3.23b ± 4.4 5.30c ± 3.86
n-3 0.32a ± 1.2 0.31a ± 1.50
n-6/n-3 10.10a ± 3.67 16.99a ± 2.57
PUFA/SFA 0.45a ± 1.84 0.81a ± 3.0
ΣFA 21.27a ± 5.84 22.16a ± 5.80
Results expressed as mean ± variation coefficient of the three replicates.
ΣFA: FA sum; SFA: saturated FA sum; MUFA: monounsaturated FA sum;
PUFA: polyunsaturated FA sum; n-6: ω-6 FA sum; n-3: ω-3 FA sum;
CN/DB: carbon number/double bound; TM: traditional methodology; PM: proposed methodology. Different letters on the same line indicate a significant difference (p < 0.05) for t-test.
Table4. Fatty acids (FA) quantification by traditional extraction, esterification and transesterification method in comparison to the proposed method
CN/DB
FA / (mg g-1 of sample)
Apple Banana Mango Coconut Backyard avocado
TM PM TM PM TM PM TM PM TM PM
8:0 – – – – – – 2.23e ± 3.2 4.0f ± 3.1 – –
10:0 – – 0.042a ± 1.3 0.085a ± 1.7 0.30c ± 1.5 0.097b ± 2.0 8.42e ± 3.5 4.3f ± 3.1 – –
12:0 – – – – – – 32.31e ± 4.3 48.9f ± 2.1 – –
14:0 – – 0.020a ± 1.4 – – – 13.82e ± 2.1 24.0f ± 2.9 – –
16:0 0.08b ± 3.8 0.04b ± 4.0 0.61a ± 2.5 0.075a ± 3.0 0.34c ± 1.2 0.2b ± 2.7 8.58e ± 3.8 14.3f ± 4.1 9.8m ± 1.3 12.9m ± 1.6
16:1n-7 – – 0.046a ± 1.2 – 0.07d ± 0.9 – – – 0.90m ± 0.4 2.7m ± 0.5
18:0 0.014a ± 1.4 – 0.024a ± 1.8 0.40a ± 2.0 0.03d ± 1.8 – 2.21e ± 3.3 4.2f ± 3.0 0.25m ± 1.6 0.32m ± 0.9
18:1n-9 0.099c ± 2.3 – 0.26a ± 1.1 0.25a ± 1.5 0.35c ± 0.7 0.22b ± 0.8 8.84e ± 4.2 13.2f ± 4.5 14.4m ± 0.7 13.8m ± 0.5
18:1n-7 – – 0.32a ± 1.0 0.002a ± 2.2 0.25c ± 1.9 0.12b ± 0.9 1.59e ± 2.6 3.4f ± 2.5 0.46m ± 1.3 0.53m ± 1.5
18:3n-3 – – – – – – – – 0.06m ± 0.7 0.35m ± 0.4
18:2n-6 0.020b ± 1.1 0.083b ± 0.9 – – – – – – 5.49m ± 1.3 6.80m ± 0.9
ΣFA 0.213b ± 8.6 0.12b ± 4.9 1.32a ± 10.3 0.812a ± 9.8 1.34c ± 8.0 0.637b ± 6.5 78.0e ± 27.0 116.3t ± 25.3 31.4m ± 7.5 37.4m ± 7.5
The linear interval was performed with avocado and coconut samples, indicating the range of 5.0 to 12.0% of lipids.
Conclusion
Through the surface response methodology, it was possible to optimize and validate a new, fast and efficient methylation technique, which was performed in only 14.00 min (6.00 min of sonication after addition of NaOH
solution and 8.00 min of sonication after addition of H2SO4
solution), and it can be applied efficiently in fruit samples with lipid percentage of 6.0 to 12.0%.
ESI-MS analysis allowed evaluating the PM efficiency in comparison to the traditional lipid extraction, esterification and transesterification methodology. PM occasioned in fewer DAG and TAG residues after reaction, minimizing the usage of sample and reagent amounts. PM also allowed the samples preparation for FA analysis by gas chromatography to be performed faster, cheaper and with less environmental impact when compared to TM.
Acknowledgments
The authors thank CNPQ, CAPES and Fundação Araucária for the financial support and grant of the scholarship. They also thank the state of Paraná and the Universidade Estadual de Maringá for making available the necessary technologies for the development of this research.
References
1. http://www.agencia.cnptia.embrapa.br/gestor/tecnologia_de_ alimentos/arvore/CONT000fid57plx02wyiv80z4s4737f5asrp. html, accessed in June 2017.
2. Daiuto, E. R.; Tremocoldi, M. A.; Alencar, S. M.; Vieites, R. L.; Minarelli, P. H.; Rev. Bras. Frutic.2014, 36, 417. 3. Visentainer, J. V.; Franco, M. R. B.; Ácidos Graxos em Óleos
e Gorduras: Identificação e Quantificação, 2ª ed.; Editora da Universidade Estadual de Maringá/Eduem: Maringá, 2012. 4. Bligh, E. G.; Dyer, W. J.; Can. J. Biochem. Physiol.1959, 37,
911.
5. Figueiredo, I. L.; Claus, T.; Santos Júnior, O. O.; Almeida, V. C.; Magon, T.; Visentainer, J. V.; J. Chromatogr. A2016, 1456, 235.
6. Milinsk, M. C.; Matsushita, M.; Visentainer, J. V.; Oliveira, C. C.; de Souza, N. E.; J. Braz. Chem. Soc.2008, 19, 1475. 7. Hartman, L.; Lago, R. C. A.; Lab. Pract.1973, 22, 475. 8. Maia, E. L.; Amaya, D. B. R.; Rev. Inst. Adolfo Lutz 1993, 53,
27.
9. Visentainer, J. V.; Quim. Nova2012, 35, 274.
10. Neto, B. B.; Scarminio, I. S.; Bruns, R. E.; Como Fazer Experimentos: Pesquisa e Desenvolvimento na Ciência e Indústria, 2ª ed.; Editora da Unicamp: Campinas, 2001. 11. International Conference on Harmonization (ICH); Validation
of Analytical Procedures: Text and Methodology Q2 (R1); ICH: London, 2005.
12. Ribani, M.; Bottoli, G. B. C.; Collins, H. C.; Jardim, F. S. C. I.; Melo, C. F. L.; Quim.Nova2004, 27, 771.
Submitted: September 14, 2017 Published online: March 5, 2018