Food Science and Technology
DO:
D https://doi.org/10.1590/fst.27916
OSSN 0101-2061 (Print) OSSN 1678-457X (Dnline)
1 Introduction
Ot is noticed that food contamination by metals has attracted scientific interest because of the potential damage caused to health. Many inorganic elements, especially metal ions, can play dual role in the physiology of organisms: some are indispensable to life, while others are toxic in high concentrations, which may affect some activities of the body and, in some irreversible cases, death (Macarovscha, 2011).
Lead and Cadmium are considered as human carcinogens by the Onternational Agency for Research on Cancer, when they are excessively consumed. On lower doses, they can cause a number of diseases, especially cardiovascular, kidney, nervous system, blood as well as bones diseases. Arsenic is also toxic mainly in inorganic form. Ots toxicity ranges from skin lesions to cancer of the brain, liver, kidney and stomach (Raptopoulou et al., 2014). On Brazil, the maximum permissible level of arsenic and lead in tomato concentrate is 0.5 mg kg-1 (Brasil, 2013), while Cd
maximum permissible level in food is 1.0 mg kg-1 (Brasil, 1965).
The majority of the toxic effects induced by chromium occur in the respiratory tract. The essentiality of chromium in humans and animals is related to Cr (OOO), nutrient that plays an important role in the metabolism of glucose, fats and proteins. The chromium (VO) compounds may cause adverse effects on the skin, the respiratory tract and kidneys (Azevedo & Chasin, 2003). The maximum permissible level of chromium in food
is 0.1 mg kg-1 (Brasil, 2013) and some studies showed Cr level
ranges in fruits and vegetables from 0.04 to 0.16 µg kg−1.
Nickel can be ingested by consumption of plant and animal containing it. The main chronic effects caused by Ni are rhinitis, asthma and sinusitis (Poletti, 2012). Most fresh products have less than 0.5 mg kg-1 but the food processing and storage methods
seem to increase the Ni levels (Azevedo & Chasin, 2003). The maximum permissible level of Ni in food is 5.0 mg kg-1,
according to Brazilian legislation (Brasil, 1965). This is a very high value considering the levels usually found in fresh products.
The toxicity of antimony depends on its chemical form and oxidation state, and compounds of trivalent antimony are generally more toxic than pentavalent forms (Sánchez-Martínez et al., 2013). Dral exposure to antimony predominantly affects the gastrointestinal system (Sundar & Chakravarty, 2010). The maximum permissible level of antimony in food is 2.0 mg kg-1 (Brasil, 1965).
Tin is a metal present in tinplate, used in the internal coating of cans. The tissues and organs that accumulate the highest concentrations of tin are bone, lymph nodes, liver, lung, ovary, testis and kidney (Baysal et al., 2011). Tin toxicity, in inorganic form, is considered low and the maximum tolerable limit established by law is 250 mg kg-1 (Brasil, 1965).
The consumption of processed food generates some questions, including questions about the contact between product and
Evaluation of metals in tomato sauces stored in different types of packaging
Luiza Portugal MUNOZ1*, Lisia Maria Gobbo dos SANTDS1, Katia Laine Magalhães do CDUTD1, Silvana do Couto JACDB1
Received 03 Nov, 2016 Accepted 10 Apr., 2018
1 Instituto Nacional de Controle de Qualidade em Saúde – INCQS, Fundação Oswaldo Cruz – FIOCRUZ, Rio de Janeiro, RJ, Brasil *Corresponding author: portugalluiza@hotmail.com
Abstract
There is a growing concern about health and food safety when it comes to processed food. On the present study, it has been hypothesized that tomato sauces contain high amounts of metals possibly leached from packaging. Concentrations of As, Cd, Pb, Cr, Ni, Sn and Sb were determined by OCP-MS in tomato sauces stored in metallic, plastic, cellulosic and glass packaging. Packaging composition was determined by XRF. This study has also determined Cr and Sn content, by GF AAS, in simulant solutions prepared to be in contact with the four types of packaging. The results showed that there was no significant difference between the concentrations of metals in products stored in different types of packaging (p>0.05), except for Sn and Ni. Canned products presented higher concentrations of tin (0.19 mg/kg); and nickel contents showed a range of 0.05 to 0.1 mg/kg. The only metal that was in higher concentration than the established by law (0.1 mg/kg) was Cr (mean value of 0.3 mg/kg). The XRF identified the presence of chromium in plastic, cellulosic and metallic packaging, and tin only in cans. For simulant solution, the tin from cans was the only identified migrant and chromium migration was not detected.
Keywords: metal; packaging; OCP-MS; XRF; GF AAS.
packaging, as shown by some studies: According to Hansen et al. (2010), antimony concentration up to a factor of 2.7 above the EU limit for drinking water were found in commercial juices and may either be leached from the packaging material. Melo et al. (2009) studied Sb concentrations in mineral water stored in PET bottles, assuming the release of the metal from the plastic.
Metals and their salts are present in the composition of different types of packaging. They are used as stabilizers, catalysts and coatings for example, and may migrate from the packaging to the food. The packaging is allowed to contain inorganic elements as long as it does not transfer to the food toxic substances or contaminants in quantities that pose a risk to human health (Brasil, 2012). Ot is known that packaging basically play a role in storage, protection and information. Thus, it is expected that there is no migration of unwanted substances from packaging to food. The main factors affecting the leaching of metals from different materials include the acidity of the food, the time of contact between the food and the packaging and the food water content. Dn a smaller scale of influence there are factors such as contact area, temperature, agitation, and the alloy quality itself (Dessuy, 2011).
Among the vegetables cultivated worldwide for fresh consumption, tomato stands out because it is produced and used universally (Camargo et al., 2007). Ot is estimated that 80% of the world tomato production is for industrial processing that will store the final product in some kind of packaging. Among the most common ones, there are the plastic, cellulosic, metallic and glass packaging for tomato sauce storage. This product has a pH around 4 and, being an acid and aqueous product, creates a favorable environment for a possible migration of elements from packaging material to the sauce (Quintaes et al., 2004).
The tinplate used in metallic packaging is based on a steel base with low carbon coated by tin layer on both surfaces and passivation treatment with chromium oxides (Associação Brasileira de Embalagem de Aço, 2009, Tomate: a grande diversidade de opções em lata do saboroso e nutritivo fruto, personal communication). Cellulosic materials generally present poor barrier to gases and water vapor. However, laminated packaging have high barrier due to aluminum sheet and/or plastic film in the structural composition (Universidade Estadual de Campinas, 2005, Embalagens Celulósicas, personal communication).
From the point of view of interaction with food, glass is extremely advantageous since it is totally inert and do not transmit any odor or taste to food. Ot also does not cause migration of its elements to the product (Magnusson & Örnemark, 2014). The glass composition varies greatly and chemical components such as lead oxide (PbD) can participate in its composition. Finally, the tomato sauces stored in plastic materials are found in packaging known as flexible or stand up pouch. The advantages of this material are light weight, unbreakable, recyclable, mechanical and thermal resistance (Universidade Estadual Paulista, 2013, Embalagens para alimentos, personal communication).
Despite the considerations of packaging, we must remember that some elements are present in the raw material of some processed products, since they are often subjected to treatments with pesticides and fertilizers. Brazil has laws that set the maximum permissible values of some contaminants such as As, Cd, Pb, Cr, Ni, Sb and Sn for tomato concentrates and food in general, as
ANVOSA (Brasil, 2013) and ANVOSA (Brasil, 1965). Unlike Brazil, some countries do not have these limits for the industrialized product, relying only on laws that include raw materials such as fruits and vegetables. This is the case in Europe that has the European Commission Regulation 1881/2006 (European Union, 2006), which recommends maximum levels for certain contaminants in foodstuffs, considering fruits and vegetables, but does not include concentrate or tomato sauces, for example.
The purpose of this study was to analyze and evaluate the levels of inorganic trace elements in twenty samples of tomato sauces, from local supermarkets in the city of Rio de Janeiro, Brazil. On addition to this analysis, the four types of packaging were analyzed to provide more information about the possible food-packaging interaction, and simulant solutions were also made in order to verify the migration of some elements from packaging to food. Simulant is a product that imitates the behavior of a group of food that has similar characteristics (Brasil, 2001).
2 Materials and methods
2.1 Instrumentation
The tomato sauce samples were digested in a microwave model Speed Wave (Berghof, Germany) with the addition of nitric acid 65%. The determination of As, Cd, Pb, Cr, Ni, Sb and Sn concentration was made by Onductively Coupled Plasma Mass Spectrometry - OCP-MS – (Nexion 300D Perkin Elmer, USA) equipped with a concentric nebulizer (MEONHARD),
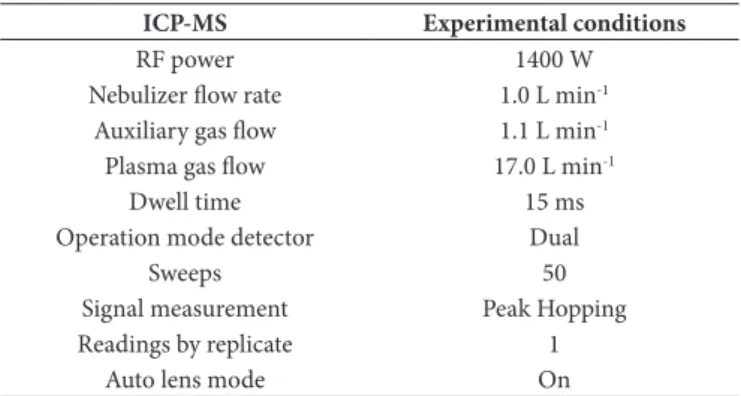
and a glass cyclone spray chamber was used. Argon gas with a minimum purity of 99.996% was obtained from White Martins (São Paulo, Brazil). The instrument conditions used were: autolens mode, peak hopping measurement mode, dwell time of 15 ms, 50 sweeps by reading, 1 reading by replicate, 3 replicates. Nickel cone, skimmer and hyper-skimmer and a quartz ball joint injector 2.0 mm i.d. were used. Details of the instrumental operating conditions are depicted in Table 1.
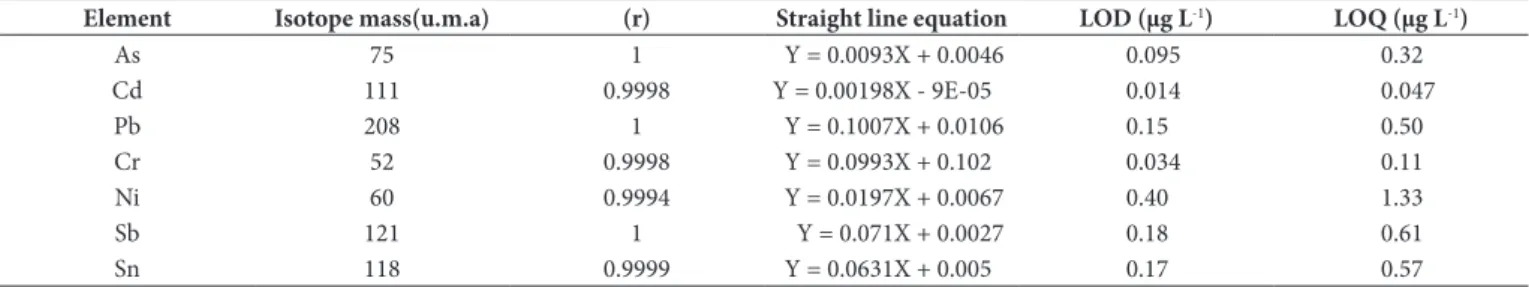
Sensitivity, linearity, selectivity and precision were determined by repeated analysis of fortified samples. The detection limit (LDD) was determined as 3 times the standard deviation of the blank (n = 10) and the limit of quantification (LDQ) as 10 times the standard deviation of the blank (n = 10). The figures of merit for the analyzed elements are presented in Table 2.
Table 1. Experimental conditions used on OCP-MS equipment to determine inorganic contaminants in tomato sauce samples.
ICP-MS Experimental conditions
RF power 1400 W
Nebulizer flow rate 1.0 L min-1
Auxiliary gas flow 1.1 L min-1
Plasma gas flow 17.0 L min-1
Dwell time 15 ms
Dperation mode detector Dual
Sweeps 50
Signal measurement Peak Hopping
Readings by replicate 1
The simulant solutions were analyzed by Graphite Furnace Atomic Absorption Spectrometer – GF AAS – (PinAAcle 900Z Perkin Elmer, USA), equipped with auto sampler (AS 900), transverse-heated graphite furnace with Ontegrated Platform and longitudinal Zeeman background correction. The sample and standards volume introduced into the graphite tube by the auto sampler was 20 µL, and the volume of the matrix modifier was 5 µL. Each analyte was run in duplicate (2 replicates). The experimental conditions used on GF AAS for chromium and tin quantification are shown in Table 3.
For tin determination, a mixture of Pd-Mg was used as a matrix modifier solution, both in the form of nitrate. And for chromium determination no chemical modifier was used.
The elemental composition of packaging materials was analyzed using the X-Ray Fluorescence technique – XRF – (XL3t, Thermo Scientific, USA). To perform XRF analysis, two calibration programs recommended by the manufacturer were used: Mode Eletronic Metals and Mode Plastics. Multielement reference materials for each analyzed material were used to verify instrument performance (Niton serial number 180-606- lote J, batch J). The results were compared to nominal concentrations and to acceptable ranges (30s Main Range) for each element.
2.2 Analytical procedure
All materials were cleaned with acidified ultrapure water.
2.3 Tomato sauce
Twenty samples of tomato sauces in two different brands were purchased from supermarkets in the city of Rio de Janeiro: twelve tomato sauce samples from brand A (4 in plastic, 4 in cellulosic and 4 in metallic packaging) and eight samples from brand B (3 in plastic, 3 in metallic and 2 in glass packaging). All the samples were from different lots. The tomato sauce samples were coded as A1 to A12 for samples from brand A and B1 to B8 for samples from brand B. Each sample was homogenized in a domestic food processor and 0.5g was weighted, transferred to Teflon flasks and, after the addition of 3 mL of HND3 and 2 mL of water, the flasks were submitted to digestion in a microwave model Speed Wave (Berghof, Germany) using a five steps program. The resulting solutions were transferred to polypropylene tubes and the volume was completed to 15 ml. After that, an aliquot of 5 mL was diluted to 15 mL and Rh was
added to a final concentration of 10 µg L-1 for its evaluation as
internal standard. All the samples were analyzed in triplicates (3 replicates). The isotopes measured in this study were
75As, 111Cd, 208 Pb, 52Cr, 60Ni, 121Sb and 118Sn. The external calibration
was accomplished with aqueous solutions in the concentrations of 0.5; 1.0; 5.0; and 10.0 µg L -1. All calibration solutions were
in 1% v/v nitric acid containing 10 µg L-1 of Rh. Accuracy was
determined by recovery test and the relative standard deviations (RSD) for n =5 were determined for the tomato sauce samples enriched with the analytes. Fortified samples, from plastic, cellulosic, metallic and glass packaging, were submitted to the same procedure as the other samples.
2.4 Packaging
For this test, pieces of each packaging were cut according to the color of the external surface, shown in Figure 1. Each of these pieces was analyzed internally using XRF technique. Table 2. Osotope, correlation coefficient (r), straight line equation, Limit of Detection (LDD) and Limit of Quantification (LDQ) for trace elements analyzed by OCP-MS.
Element Isotope mass(u.m.a) (r) Straight line equation LOD (µg L-1) LOQ (µg L-1)
As 75 1 Y = 0.0093X + 0.0046 0.095 0.32
Cd 111 0.9998 Y = 0.00198X - 9E-05 0.014 0.047
Pb 208 1 Y = 0.1007X + 0.0106 0.15 0.50
Cr 52 0.9998 Y = 0.0993X + 0.102 0.034 0.11
Ni 60 0.9994 Y = 0.0197X + 0.0067 0.40 1.33
Sb 121 1 Y = 0.071X + 0.0027 0.18 0.61
Sn 118 0.9999 Y = 0.0631X + 0.005 0.17 0.57
Table 3. Dptimized parameters for the analysis of tin and chromium in simulant solutions.
Tin
Wavelength 286.33 nm
Slit 0.7 nm
Pyrolysis Temperature 1400 °C Atomization Temperature 2200 °C
Chemical modifier 0.005 mg Pd + 0.003 mg Mg(ND3)2
Lamp EDL
Measurement Peak Area
Standards (µg L-1) 50
Correlation Coefficient 0.9998
LDQ (µg L-1) 5
Chromium
Wavelength 357.87 nm
Slit 0.7 nm
Pyrolysis Temperature 1500 °C Atomization Temperature 2300 °C
Lamp HCL
Measurement Peak Area
Standards (µg L-1) 100
Correlation Coefficient 0.9969
LDQ (µg L-1) 5
2.5 Simulant Solutions
The simulant solutions for contact with packaging were prepared according to the specific laws ANVOSA (Brasil, 2007, 2001, 2012, 2010) for each type of packaging. For the plastic one, a simulant type B (simulant aqueous acid food (pH <4.5)) containing acetic acid solution 3% (w / v), and deionized water was placed in contact with the packaging for ten days on 40 °C. Each of the two selected plastic containers received 300 mL of simulant solution. For cellulosic packaging, the same classification was adopted for food simulants (B), but the contact method was done for 24 hours at a temperature of 50 °C, as indicated by the corresponding resolution. Thus, 350 mL of simulant solution were placed in two cellulosic boxes. The simulant solution for contact with the glass packing was prepared with a 4% (w/v) acetic acid solution. This simulant was heated to 80 °C and placed in the glass vessel preheated (80 °C) oven for 45 minutes to 90% of its capacity (450 mL). The containers were left in a controlled oven at 80 ± 2 °C for 120 minutes. Finally, for the metallic packaging, a simulant type A was prepared, which corresponds to aqueous acids and non-acidic foods that may contain salt and/or sugar and oil / water emulsions, tested with an aqueous solution containing 3% chloride sodium, 10% sucrose and 1% tartaric acid. The packaging were then filled, closed and placed in a water bath at 100 °C for 2 hours. After each specific procedure, simulant solutions were removed from the packaging and stored for later analysis by Atomic Absorption Spectrometry.
2.6 Solutions and reagents
All reagents were at least of analytical purity grade. Distilled and deionized water with resistivity of 18.2 mV Ωcm obtained by Milli-Q system from Millipore (Bedford, USA) and concentrated Figure 1. Pieces of each packaging analyzed by X-Ray Fluorescence (XRF).
nitric acid 65% (v/v) from Merck (Darmstadt, Germany) were used. The standard solution containing 1mg L-1 of As, Cd,
Pb, Cr, Ni, Sb and Sn was prepared by appropriate dilution of 1000 mg L-1 As, Cd, Pb, Cr, Ni, Sb and Sn stock standard
solutions from Merck (Darmstadt, Germany) and with 5 mL Suprapur nitric acid from Merck. 500 µL solution containing 1mg L-1 Rh were added in all solution as internal standard, final
concentration 10 µg L-1.
3 Results and discussion
3.1 Tomato sauce
Recovery of inorganic elements added to the samples was from 74 to 94% for As, 84 to 88% for Cd, 77 to 93% for Pb, 93 to 95% for Cr, 102 to 106% for Ni, 86 to 92% for Sb and 54 to 83% for Sn. These results are in accordance with the recovery range of 40 to 120% set by Eurachem and ONMETRD (Magnusson & Örnemark, 2014; Onstituto Nacional de Metrologia, Qualidade e Tecnologia, 2011) and the results confirmed that the determination of these elements in tomato sauce, after acid solubilization by microwave digestion, can be performed by OCP-MS without any interference.
The concentrations of elements for all tomato sauce samples are expressed in mg kg-1 and are given in the tables
produce tomato sauces in glass packaging and the brand B does not sell products in cellulosic packaging.
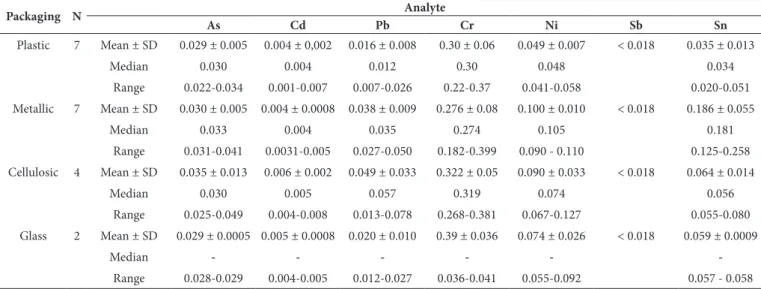
On Table 5, the results showed that As, Cd and Pb contents were below the limits established by law (0.5, 1.0 and 0.5 mg kg-1,
respectively) and there was no significant difference between concentrations of tomato sauce stored in different types of packaging.
For Cr, the lowest mean value found was 0.27 mg kg-1 in
products stored in cellulosic packaging and the highest mean value was 0.39 mg kg-1 in tomato sauces stored in glass packaging.
These results are above the maximum permissible level of chromium in food (0.1 mg kg-1). The maximum permissible
level of Ni in food, according to Brazilian legislation (Brasil, 1965) is 5.0 mg kg-1. This is a very high value considering the
levels usually found in fresh products. On this study, the range of Ni concentrations was from 0.041 to 0.110 mg kg-1. The lowest
value was found for samples stored in plastic packaging and the highest value was found for samples in metallic packaging.
The results showed that Sb content was below the limit of quantification (LDQ) - 0.018 mg kg-1 - in all samples and tin was
the only element that had different concentrations, depending on the packaging: while samples stored in plastic, cellulose and glass packaging presented a range of 0.020 to 0.080 mg kg-1, the
samples stored in cans had a range of 0.125 to 0.258 mg kg-1.
3.2 Packaging
Table 6 shows the results of the test for XRF calibration. Ot is observed that the results were in the recommended range allowing the packaging samples to be analyzed.
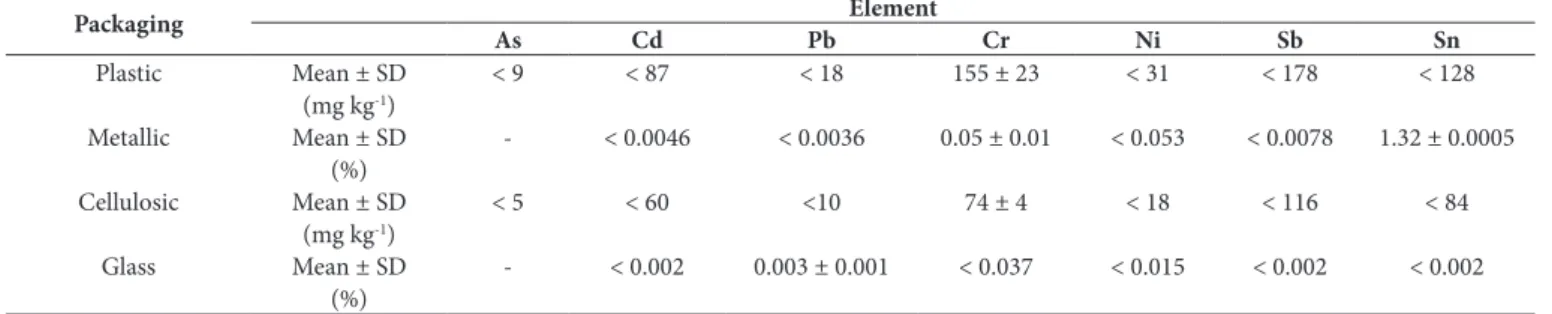
Table 7 shows the mean concentrations found in the analysis of packaging by X-Ray Fluorescence (XRF).
Regarding the packaging analysis by X-Ray Fluorescence technique, among the studied elements, only chromium, tin and lead were detected. Ot is observed that tin was detected only in metallic packaging. Ot is known that the surface of this kind of packaging is coated with layers of this element, confirming the high content of tin found. Ot has been reported the use of modern technology to decrease the amount of Sn in the coating of metal containers (Universidade Estadual Paulista, 2013, Embalagens para alimentos, personal communication) but the results of the present study show it is still not sufficient to eliminate the migration of this element to the food. Chromium was present in all studied packaging, with the exception of glass packaging (< LDQ).
On plastic packaging, all analyzed parts contained chromium in its composition, with a value range of 138 mg kg-1 (in the inner
surface with yellow outer surface) to 182 mg kg-1 (in the inner
surface with green outer surface). On the cellulosic packaging, chromium content had a mean value of 74 mg kg-1. And, for
metallic packaging, the inner surface of the can showed a mean value of 0.05% of chromium in its composition. Lead was detected only in glass packaging, however in very low quantity Table 4. Comparison of the concentrations (mg kg-1) obtained between brands A and B for tomato sauces stored in plastic and metallic containers.
Packaging Brand N Analyte
As Cd Pb Cr Ni Sb Sn
Plastic (N=7) A 4 Mean ± SD 0.026 ± 0.005 0.005 ± 0.001 0.019 ± 0.01 0.30 ± 0.05 0.05 ± 0.01 <0.018 0.04 ± 0.01 B 3 Mean ± SD 0.03 ± 0.0007 0.002 ± 0.001 0.013 ± 0.007 0.29 ± 0.09 0.044 ± 0.005 <0.018 0.02 ± 0.007 Metallic (N=7) A 4 Mean ± SD 0.032 ± 0.002 0.005 ± 0.0005 0.04 ± 0.01 0.29 ± 0.07 0.10 ± 0.01 <0.018 0.19 ± 0.09
B 3 Mean ± SD 0.025 ± 0.007 0.003 ± 0.001 0.035 ± 0.007 0.25 ± 0.09 0.10 ± 0.006 <0.018 0.18 ± 0.07
Table 5. Results (mg kg-1) of trace elements: Mean ± Standard Deviation (SD), median and range in 20 samples of tomato sauce stored in plastic
(N=7), metallic (N=7), cellulosic (N=4) and glass (N=2) packaging.
Packaging N Analyte
As Cd Pb Cr Ni Sb Sn
Plastic 7 Mean ± SD 0.029 ± 0.005 0.004 ± 0,002 0.016 ± 0.008 0.30 ± 0.06 0.049 ± 0.007 < 0.018 0.035 ± 0.013
Median 0.030 0.004 0.012 0.30 0.048 0.034
Range 0.022-0.034 0.001-0.007 0.007-0.026 0.22-0.37 0.041-0.058 0.020-0.051 Metallic 7 Mean ± SD 0.030 ± 0.005 0.004 ± 0.0008 0.038 ± 0.009 0.276 ± 0.08 0.100 ± 0.010 < 0.018 0.186 ± 0.055
Median 0.033 0.004 0.035 0.274 0.105 0.181
Range 0.031-0.041 0.0031-0.005 0.027-0.050 0.182-0.399 0.090 - 0.110 0.125-0.258 Cellulosic 4 Mean ± SD 0.035 ± 0.013 0.006 ± 0.002 0.049 ± 0.033 0.322 ± 0.05 0.090 ± 0.033 < 0.018 0.064 ± 0.014
Median 0.030 0.005 0.057 0.319 0.074 0.056
Range 0.025-0.049 0.004-0.008 0.013-0.078 0.268-0.381 0.067-0.127 0.055-0.080 Glass 2 Mean ± SD 0.029 ± 0.0005 0.005 ± 0.0008 0.020 ± 0.010 0.39 ± 0.036 0.074 ± 0.026 < 0.018 0.059 ± 0.0009
Median - - - - -
(0.003% of material composition). Cadmium, antimony and nickel were not found in any analyzed packaging.
3.3 Simulant solution
Table 8 shows that the results of simulant solutions analysis by GF AAS did not indicate the presence of Cr and Sn, after going through the contact procedure with their packaging, with the exception of the simulant solution in metallic packaging which accused the presence of tin. The concentration found for this element was 0.067 mg L-1. Despite the high concentrations of
Cr found in the tomato sauces samples and the presence of Cr in the studied packaging, the values of this element in simulant solutions was extremely low - below the limit of quantitation of the method, 5 µg L-1.
4 Conclusion
First of all, the previous analysis made for the brands A and B allowed us to conclude that there is no significant difference between the results presented by the two brands for products stored in the same kind of packaging. Therefore, all samples of tomato sauce were considered regardless of the brand.
The concentrations of metals in the analyzed products were below the Maximum Tolerable Limits established by Brazilian legislation for tomato concentrate, with the exception of Cr. Since some countries do not adopt tolerable limits for industrialized food products, it is highlighted the importance of legislation towards the industrialized final product, such as tomato sauce.
Regarding packaging, Sn in tomato sauce stored in metallic packaging showed higher concentrations than in the products stored in other types of packaging, but remained below the established limit of 250 mg kg−1. This difference may indicate
a food-packaging interaction. Also, the packaging analysis by X-Ray Fluorescence can confirm this hypothesis, since tin was detected only in metallic containers.
All simulant solutions presented concentrations of Cr and Sn below the limit of quantification (LDQ), except for the solution in contact with the metallic packaging, with tin concentration of 0.067 mg L-1. This result coincides with the
high levels of tin in sauces stored in cans coated with layers of this element, suggesting, once again, the occurrence of migration from the packaging to the food.
Despite the high concentrations of Cr found in tomato sauces and the presence of this element in metallic, plastic and cellulosic packaging, the values of Cr in simulant solution was extremely low (below the quantification limit of the analytical method, 5 µg L-1). This result suggests that the chromium found
in tomato sauces came from another source of contamination, not the packaging itself.
Regardless of brand and packaging, the analyzed product did not show any significant change considered to be harmful to health, being able to be consumed safely and without presenting any sanitary risk.
Table 6. Comparison of multielement reference material solder (Niton serial number 180-606 - Lote J), nominal concentrations and acceptable limits.
Element Nominal concentration (%w/w) Acceptable range (% w/w) Value found
(% w/w)
Sn 96 93-98 95.854 ± 0.301
Ag 2.9 2.50-3.30 3.004 ± 0.028
Cu 0.47 0.40-0.80 0.439 ± 0.023
Cd 0.35 0.27-0.41 0.390 ± 0.014
Pb 0.11 0.10-0.18 0.171 ± 0.010
Mode Electronics Metals, Duration 61.04, Units %, Sigma Value 2, Alloy1 SAC 305: 3.34, Flags No Al, SAMPLE 180-606.
Table 7. Mean concentrations found in the analysis of packaging by X-Ray Fluorescence (XRF).
Packaging Element
As Cd Pb Cr Ni Sb Sn
Plastic Mean ± SD < 9 < 87 < 18 155 ± 23 < 31 < 178 < 128 (mg kg-1)
Metallic Mean ± SD - < 0.0046 < 0.0036 0.05 ± 0.01 < 0.053 < 0.0078 1.32 ± 0.0005 (%)
Cellulosic Mean ± SD < 5 < 60 <10 74 ± 4 < 18 < 116 < 84
(mg kg-1)
Glass Mean ± SD - < 0.002 0.003 ± 0.001 < 0.037 < 0.015 < 0.002 < 0.002 (%)
Table 8. Mean concentrations of chromium and tin, in mg L-1, found
in simulant solutions.
Packaging Element
Cr Sn
Plastic Mean ± SD < 0.005 < 0.005 (mg L-1)
Metallic Mean ± SD < 0.005 0.067 ± 0.005 (mg L-1)
Cellulosic Mean ± SD < 0.005 < 0.005 (mg L-1)
monômeros, outras substâncias iniciadoras e polímeros autorizados para elaboração de embalagens e equipamentos plásticos em contato com alimentos (Resolução - RDC nº 56, de 16 de novembro de
2012). Diário Oficial [da] República Federativa do Brasil. Retrieved
from: http://bvsms.saude.gov.br/bvs/saudelegis/anvisa/2012/ rdc0056_16_11_2012.html
Camargo, G. A., Haj-Osa, N., & Queiroz, M. R. (2007). Avaliação
da qualidade de tomate seco em conserva. Revista Brasileira de
Engenharia Agrícola e Ambiental, 11(5), 521-526. http://dx.doi. org/10.1590/S1415-43662007000500012.
Dessuy, M. B. (2011). Desenvolvimento de estratégias analíticas usando
espectrometria de absorção atômica para avaliar a composição de copos de liga peltre e lixiviação de cádmio, chumbo e antimônio. Unpublished results.
European Union – EU. (2006). Commission Regulation (EC) No 1881/2006
of 19 December 2006 setting maximum levels for certain contaminants in foodstuffs, L 364/5–L 364/24. Bruxelas: EC.
Hansen, C., Tsirigotaki, A., Bak, S. A., Pergantis, S. A., Sturup, S., Gammelgaard, B., & Hansen, H. R. (2010). Elevated antimony
concentrations in commercial juices. Journal of Environmental
Monitoring, 12(4), 822-824. http://dx.doi.org/10.1039/b926551a. PMid:20383361.
Onstituto Nacional de Metrologia, Qualidade e Tecnologia – ONMETRD.
(2011). Orientação sobre validação de métodos analíticos. Rio de Janeiro:
ONMETRD. Retrieved from: http://www.inmetro.gov.br/credenciamento/ organismos/doc_organismos.asp?tDrganismo=CalibEnsaios
Macarovscha, G. T. (2011). Determinação de elementos metálicos em
nutrição enteral. Onstituto de Química, Universidade Estadual de Campinas. Unpublished results.
Magnusson, B., & Örnemark, U. (Ed.). (2014). EURACHEM/CITAC
Guide: the fitness for purpose of analytical methods: a laboratory guide to method validation and related topics. USA: EURACHEM/COTAC.
Melo, C. A., Moreira, A. B., Bak, S. A., & Bisioti, M. C. (2009). Investigação
da concentração de antimônio em águas minerais engarrafadas em polietileno tereftalato (PET). Sociedade Brasileira de Química. Unpublished results.
Poletti, J. (2012). Quantificação de elementos-traço em arroz. Unpublished
results.
Quintaes, K. D., Amaya-Farfan, J., Tomazini, F. M., Morgano, M. A., & Mantovani, D. M. B. (2004). Migration of minerals from Brazilian
stainless steel, cast iron, soap stone pans to food simulant. Food
Science and Technology (Campinas), 24(3), 397-402. http://dx.doi. org/10.1590/S0101-20612004000300017.
Raptopoulou, K., Pasias, O., Thomaidis, N., & Proestos, C. (2014). Study of the migration phenomena of specific metals in canned tomato paste before and after opening. Validation of a new quality indicator
for opened cans. Food and Chemical Toxicology, 69, 25-31. http://
dx.doi.org/10.1016/j.fct.2014.03.023. PMid:24680799.
Sánchez-Martínez, M., Pérez-Corona, T., Cámara, C., & Madrid, Y. (2013). Migration of antimony from PET containers into regulated
EU food simulants. Food Chemistry, 141(2), 816-822. http://dx.doi.
org/10.1016/j.foodchem.2013.03.067. PMid:23790852.
Sundar, S., & Chakravarty, J. (2010). Antimony Toxicity. International
Journal of Environmental Research and Public Health, 7(12), 4267-4277. http://dx.doi.org/10.3390/ijerph7124267. PMid:21318007.
Acknowledgements
The authors are grateful for the financial and analytical support provided by ONCQS/FODCRUZ/MONOSTÉROD DA SAÚDE/ BRASOL and ONMETRD.
References
Azevedo, F. D., & Chasin, A. A. M. (2003). Metais: gerenciamento da
toxicidade. On J. P. Dliveira (Ed.), Níquel (pp. 127-142). São Paulo:
Atheneu.
Baysal, A., Dzcan, M., & Akman, S. (2011). A rapid method for the determination of Pb, Cu and Sn in dried tomato sauces with solid
sampling electrothermal atomic absorption spectrometry. Food and
Chemical Toxicology, 49(6), 1399-1403. http://dx.doi.org/10.1016/j. fct.2011.03.031. PMid:21440027.
Brasil. Agência Nacional de Vigilância Sanitária – ANVOSA. (1965, Abril 9).Modifica o Decreto nº 50.040, de 24 de janeiro de 1961, referente a normas reguladoras do emprêgo de aditivos para alimentos, alterado pelo Decreto nº 691, de 13 de março de 1962 (Decreto nº 55.871,
de 26 de março de 1965). Diário Oficial [da] República Federativa
do Brasil. Retrieved from: http://www.planalto.gov.br/ccivil_03/ decreto/1950-1969/d55871.htm
Brasil. Ministério da Saúde. Agência Nacional de Vigilância Sanitária – ANVOSA. (2001, maio 15). Aprova o Regulamento Técnico - Critérios Gerais e Classificação de Materiais para Embalagens e Equipamentos em Contato com Alimentos constante do Anexo desta Resolução
(Resolução - RDC Nº 91, de 11 de maio de 2001). Diário Oficial [da]
República Federativa do Brasil. Retrieved from: http://portal.anvisa. gov.br/documents/10181/2718376/(1)RDC_91_2001_CDMP.pdf/ fb132262-e0a1-4a05-8ff7-bc9334c18ad3
Brasil. Agência Nacional de Vigilância Sanitária – ANVOSA. (2007, Março 26). Aprova o “Regulamento Técnico sobre Disposições para Embalagens, Revestimentos, Utensílios, Tampas e Equipamentos Metálicos em Contato com Alimentos” (Resolução - RDC Nº 20, de 22
de março de 2007). Diário Oficial [da] República Federativa do Brasil.
Retrieved from: http://portal.anvisa.gov.br/documents/33916/390501/ ALOMENTDS%2BRESDLU%25C3%2587%25C3%2583D%2B%2B RDC%2BN%25C2%25BA.%2B20%252C%2BDE%2B22%2BDE%2 BMAR%25C3%2587D%2BDE%2B2007.pdf/d04ac5a7-f1c9-4eb5-98c1-989cede53650
Brasil. Agência Nacional de Vigilância Sanitária – ANVOSA. (2010, novembro 30). Dispõe sobre migração em materiais, embalagens e equipamentos plásticos destinados a entrar em contato com alimentos (Resolução - RDC nº 51, de 26 de novembro de 2010). Diário Oficial [da] República Federativa do Brasil. Retrieved from: http://portal.anvisa.gov.br/documents/33916/390501/ALOMENT DS%2BRESDLU%25C3%2587%25C3%2583D%2BRDC%2BN% 25C2%25BA%2B51%252C%2BDE%2B26%2BDE%2BNDVEMBR D%2BDE%2B2010%2B-%2BMigra%25C3%25A7%25C3%25A3o. pdf/237fc1dc-2d3c-44d0-9b60-1ecdb39b6169
Brasil. Agência Nacional de Vigilância Sanitária – ANVOSA. (2013, agosto 30). Dispõe sobre o Regulamento Técnico MERCDSUL sobre Limites Máximos de Contaminantes Onorgânicos em Alimento
(Resolução - RDC nº 42, de 29 de agosto de 2013). Diário Oficial
[da] República Federativa do Brasil. Retrieved from: http://bvsms. saude.gov.br/bvs/saudelegis/anvisa/2013/rdc0042_29_08_2013.html Brasil. Ministério da Saúde. Agência Nacional de Vigilância Sanitária