Reproductive strategies and genetic variability in tropical freshwater fish
Maria Dolores Peres Lassala and Erasmo Renesto
Núcleo de Pesquisas em Limnologia, Ictiologia e Aqüicultura, Universidade Estadual de Maringá,
Maringá, PR, Brazil.
Abstract
We estimated the genetic variability of nine fish species from the Brazilian upper Paraná River floodplain (Astyanax altiparanae, Hoplias malabaricus, Leporinus lacustris, Loricariichthys platymetopon, Parauchenipterus galeatus, Pimelodus maculatus, Rhaphiodon vulpinus, Roeboides paranensis and Serrasalmus marginatus) based on data for 36 putative allozyme loci obtained using corn starch gel electrophoresis of 13 enzymatic systems: aspartate aminotransferase (EC 2.6.1.1), acid phosphatase (EC 3.1.3.2), esterase (EC 3.1.1.1), glycerol-3-phosphate dehy-drogenase (EC 1.1.1.8), glucose-6-phosphate dehydehy-drogenase (EC 1.1.1.49), glucose-6-phosphate isomerase (EC 5.3.1.9), Iditol dehydrogenase (EC 1.1.1.14), isocitrate dehydrogenase – NADP+
(EC 1.1.1.42), L-lactate dehy-drogenase (EC 1.1.1.27), malate dehydehy-drogenase (EC 1.1.1.37), malate dehydehy-drogenase-NADP+
(EC 1.1.1.40), phosphoglucomutase (EC 5.4.2.2) and superoxide dismutase, (EC 1.15.1.1). The mean expected heterozygosity varied from zero to 0.147. When data from the literature for 75 species of tropical fish were added to the nine species of this study, the heterozygosity values differed significantly among the groups of different reproductive strategies. The highest mean heterozygosity was for the non-migratory without parental care, followed by the long-distance mi-gratory, and the lowest mean was for the non-migratory with parental care or internal fecundation.
Key words:genetic variability, heterozygosity, Paraná River, polymorphism, reproductive strategies, tropical fish.
Received: July 19, 2006; Accepted: March 16, 2007.
Introduction
The reactions that species offer to environmental se-lective pressures is reflected in their physiological strate-gies, which can reduce maintenance energy, increase the efficiency of energy acquisition and, consequently, opti-mize reproductive efficiency. The success of such strate-gies may be estimated by the individual ability of being genetically present in the offspring (Agostinho and Júlio Jr., 1999).
In fish, reproductive strategies are extremely diversi-fied, encompassing variations in the way they meet and attract partners, in spawning locations and parental care (Wootton, 1990). External fertilization and embryonic de-velopment are the dominant pattern for the majority of tele-ost fish, although internal fertilization and external embryonic development occurs in some Brazilian freshwa-ter species such as Parauchenipterus galeatus. Blumer (1982) described parental care as any type of investment that enhances the survival probability of offspring (repro-ductive success) and which vary from pre-fertilization
ac-tivities such as nest building (e.g.inHoplias malabaricus) to mouth brooding and live-bearing.
Adaptation to heterogeneous environments depends upon the genetic variability of species, reduction in genetic variability resulting in reduced feeding and reproductive performance leading to inefficient exploration of the habi-tats (Kirpichnikov, 1992). Several authors have tried to ex-plain the mechanisms which maintain genetic variability in natural populations. Nevo (1988) analyzed the relationship between heterozygosity and ecological and biological fea-tures such as climate (arctic, temperate and tropical), geo-graphic range (wide, narrow, endemic), habitat type (un-derground, terrestrial, aquatic), habitat range (specialist, generalist) aridity (arid, sub-arid, sub-humid, mesic with a moderate or well-balanced moisture supply) and territo-riality (territorial, non-territorial) in 1,111 species (verte-brates, inverte(verte-brates, and plants) and concluded that envi-ronmental heterogeneity is the major factor in maintaining and structuring genetic diversity in natural populations. Wardet al.(1994) compared the heterozygosity of marine, freshwater and anadromous (fish which live mostly in the sea but breed in fresh water) fish and concluded that marine fish have greater genetic variability than the other types. Heithaus and Laushman (1997) investigated the effects of ecology, life history and water quality on genetic variation www.sbg.org.br
Send correspondence to Erasmo Renesto. Núcleo de Pesquisas em Limnologia, Ictiologia e Aqüicultura, Universidade Estadual de Maringá, Av. Colombo 5790, 87020-900 Maringá, PR, Brazil. E-mail: erenesto@hotmail.com.
of three stream-dwelling fish species and revealed that the genetic variability tends to decrease as species become more ecologically specialized.
Allozyme electrophoresis has been extensively used to estimate genetic variability in natural populations (Nevo, 1988; Van Der Banket al., 1989; Wardet al., 1994) and our study employed this technique to estimate the genetic vari-ability of nine species of fish from the Brazilian upper Paraná River floodplain and, jointly with literature data, verify the relationships between genetic variability and re-productive strategies.
Material and Methods
From March to December, 2002 in the Brazilian up-per Paraná River floodplain, nine species from the most abundant fish with different reproductive strategies were sampled from Baía River (22°44’ S, 53°17’ W) and Paraná River (22°46’ S, 53° 15’22” W) (Figure 1). The species sampled were Astyanax altiparanae Garutti & Britski 2000, Hoplias malabaricus (Bloch 1794), Leporinus lacustris Campos 1945, Loricariichthys platymetopon
Isbrücker & Nijssen 1979, Parauchenipterus galeatus
(Linnaeus 1766), Pimelodus maculatus Lacépède 1803,
Rhaphiodon vulpinusAgassiz 1829,Roeboides paranensis
Pignalberi 1975 andSerrasalmus marginatusValenciennes 1847. A total of 267 specimens were sampled.
Immediately after capture, white skeletal muscle, gill, heart and liver tissue were removed from each specimen and frozen in liquid nitrogen. Tissues were homogenized with
plastic sticks in 1.5 mL microcentrifuge tubes containing Tris/0.02 M HCl (1:1 w:v) buffer, pH 7.5. Carbon tetrachlo-ride (CCl4) was added to the homogenized liver samples (1:2
v:v) due to the large amounts of fat present in the tissues (Pasteuret al., 1988). The homogenized samples were cen-trifuged at 45,114 x g for 30 min at temperatures between 1° and 5 °C and the supernatants submitted to horizontal elec-trophoresis in 15% corn starch gel (Valet al., 1981).
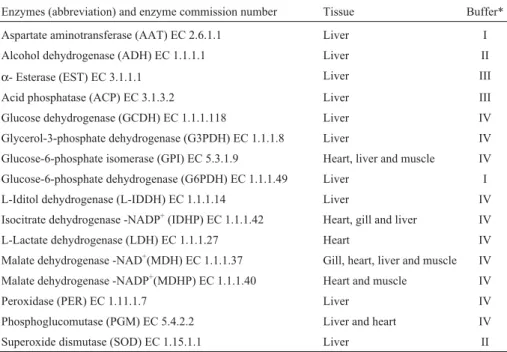
We evaluated 16 enzymatic systems (Table 1), en-zyme nomenclature following the proposals of Murphyet al. (1996). Electrophoreses conditions were according to the following authors: Boyer et al., (1963) for SOD; Ruvolo-Takasusukiet al., (2002) for ACP and EST; Shaw
Table 1- Electrophoretic conditions for 16 enzymatic systems analyzed for species from the upper Paraná River floodplain. The enzymes were run for 14 h, except forα- esterase (EST) EC 3.1.1.1 and acid phosphatase (ACP) EC 3.1.3.2, which were both run for 5.5 h.
Enzymes (abbreviation) and enzyme commission number Tissue Buffer*
Aspartate aminotransferase (AAT) EC 2.6.1.1 Liver I
Alcohol dehydrogenase (ADH) EC 1.1.1.1 Liver II
α- Esterase (EST) EC 3.1.1.1 Liver III
Acid phosphatase (ACP) EC 3.1.3.2 Liver III
Glucose dehydrogenase (GCDH) EC 1.1.1.118 Liver IV
Glycerol-3-phosphate dehydrogenase (G3PDH) EC 1.1.1.8 Liver IV
Glucose-6-phosphate isomerase (GPI) EC 5.3.1.9 Heart, liver and muscle IV
Glucose-6-phosphate dehydrogenase (G6PDH) EC 1.1.1.49 Liver I
L-Iditol dehydrogenase (L-IDDH) EC 1.1.1.14 Liver IV
Isocitrate dehydrogenase -NADP+(IDHP) EC 1.1.1.42 Heart, gill and liver IV
L-Lactate dehydrogenase (LDH) EC 1.1.1.27 Heart IV
Malate dehydrogenase -NAD+(MDH) EC 1.1.1.37 Gill, heart, liver and muscle IV
Malate dehydrogenase -NADP+(MDHP) EC 1.1.1.40 Heart and muscle IV
Peroxidase (PER) EC 1.11.1.7 Liver IV
Phosphoglucomutase (PGM) EC 5.4.2.2 Liver and heart IV
Superoxide dismutase (SOD) EC 1.15.1.1 Liver II
*I = Tris/EDTA/Maleate pH 7.4 (Shaw & Prasad, 1970); II = Tris/EDTA/borate pH 8.6 (Boyeret al., 1963); III = Tris-HCl pH 7.5 (Ruvolo-Takasusukiet al., 2002); IV = Tris/citrate pH 7.0 (Shaw and Prasad, 1970).
and Prasad (1970) for AAT, G3PDH, G6PDH, GPI, IDDH, IDHP, LDH, MDH, MDHP and PGM. Standard histoche-mical staining procedures were used to visualize specific enzymes (Aebersoldet al., 1987). Genetic interpretation of the gels was based on the quaternary structure of the en-zymes (Wardet al., 1992). Data were analyzed using the POPGENE program version 1.31 (Yehet al., 1997). Ge-netic variability was estimated using Nei’s unbiased hete-rozygosity (He) or gene diversity (Nei, 1978). The obser-ved (Ho) and expected (He) heterozygosities for each putativeloci and the overall loci means were also calcu-lated. Genotypic frequencies were tested for Hardy-Wein-berg equilibrium using the chi squared (χ2) test.
The species were organized in three distinct groups of reproductive strategy according to Vazzoler and Menezes (1992): group 1 (G1), containing the long-distance (> 100 km) migratory speciesP. maculatusandR. vulpinus; group 2 (G2), containing the sedentary or short-distance (< 100 km) migratory speciesA.altiparanae,L. lacustris,R. paranensis which provide no parental care; and group 3, containing the sedentary or short-distance migratory species
H. malabaricus,L. platymetopon,P. galeatus, S. marginatus
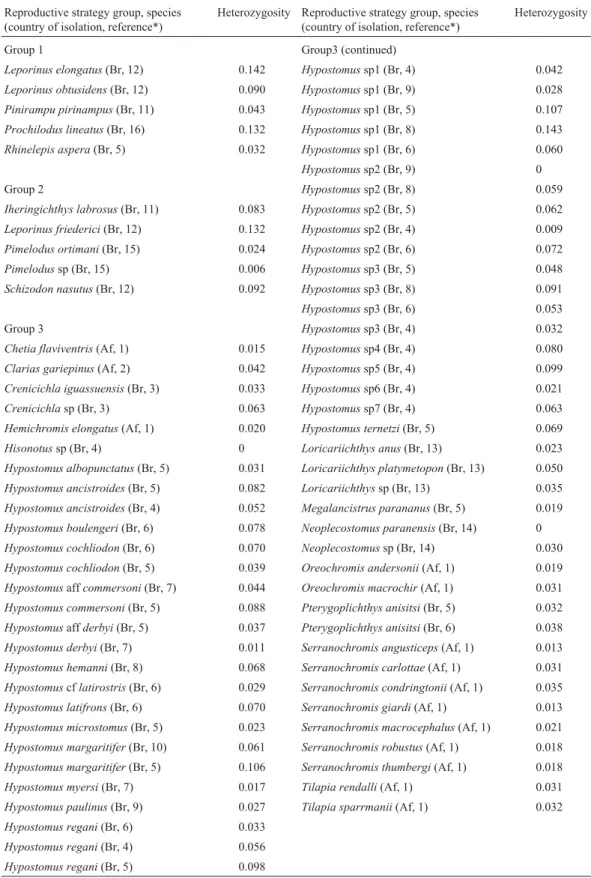
with internal fertilization or which provide parental care. Since it is unlikely that the species analyzed by us were rep-resentative of all tropical fish, we added data from the litera-ture for a further 75 tropical fish species (61 from Brazil and 14 from Africa) for which the heterozygosity values had been estimated using allozyme data (Table 2), hence the total number of species analyzed was 84.
The significance of differences between groups was evaluated using a null models analysis of variance and the EcoSim 7 program (Gotelli & Entsminger, 2006).
Results
Genetic variability
The calculated genetic variability values for each spe-cies are presented in Table 3, from which it can be seen that the greatest frequency of polymorphicloci, average num-ber of alleles per locus and heterozygosity were obtained forA. altiparanae, followed byH. malabaricus. No poly-morphic locus was detected inR. vulpinusfor the 29 loci analyzed. Except for P. maculatus the expected hetero-zygosity were higher than obtained heterohetero-zygosity, which indicates, on average, an excess of homozygotes for all loci. All loci were in Hardy-Weinberg equilibrium (HWE) forL. lacustris, L. platymetopon, P. maculatus, R. vulpinus
andR. paranensis. The loci not in HWE wereG6pdh-1,
Iddh-1 and Mdhp-1 for A. altiparanae, Gdh-1 for S. marginatus, Gdh-2 for P. galeatus, Adh-1, G6pdh-1, Gpi-A, Gpi-b, sMdh-BandSod-1forH. malabaricus.
Heterozygosity and reproductive strategies
The lowest heterozygosity values in our sample of nine species were for the G1 long-distance migratory
species (R. vulpinus = 0 andP. maculatus = 0.011), which therefore also presented the lowest group average (He = 0.005). The highest average heterozygosity (He = 0.110) occurred in the G2 sedentary or short-distance migratory species with-out parental care, withA. altiparane having the highest heterozygosity (0.152) of all the species analyzed. The G3 sedentary or short-distance migratory species with internal fertilization or parental care exhibited intermediate hetero-zygosity (0.067).
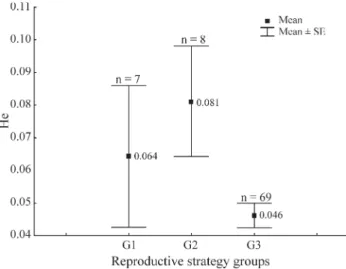
When we considered the nine tropical fish species an-alyzed by us plus the 75 species from the other studies we found that the number of species in each reproductive strat-egy group and the average heterozygosity (He)±the stan-dard error for each group was as follows: G1 = 7 (Ho = 0.064±0.021), G2 = 8 (He = 0.081± 0.016) and G3 = 69 (He = 0.046±0.002) (Table 3, Figure 2), with He varying from zero to 0.142 for G1, from 0.006 to 0.152 for G2, and from zero to 0.143 for G3 (Tables 2 and 3). These data show that the highest average heterozygosity was pre-sented by the G2 sedentary or short-distance migratory spe-cies without parental care, the G1 long-distance migratory species had and intermediate average heterozygosity and the G3 species with parental care or internal fertilization presented the lowest average heterozygosity.
A Shapiro-Wilk test for normality showed that the He values were not normally distributed (W = 0.9199, p < 0.0001) and the Levene test for homogeneity of vari-ances showed a significant value (F = 4.843, p = 0.0103), indicating that the variances were heterogeneous. We con-ducted ANOVA but since the assumptions of normality and homogeneity of variances were not met by the data the sig-nificance of the ANOVA was tested by null models using the EcoSim 7 programs. The ANOVA detected a signifi-cant difference (F2, 81= 4.02; p < 0.05) between the three
re-productive strategy groups.
Table 2- Heterozygosity (He) values estimated for 75 tropical fish species from Brazil and Africa based on enzymatic data. Group 1 = Migratory species, Group 2 = sedentary species or short-distance migratory without parental care; Group 3 = sedentary species or short-distance migratory with internal fer-tilization or parental care. Africa = Af, Brazil = Br.
Reproductive strategy group, species (country of isolation, reference*)
Heterozygosity Reproductive strategy group, species (country of isolation, reference*)
Heterozygosity
Group 1 Group3 (continued)
Leporinus elongatus(Br, 12) 0.142 Hypostomussp1 (Br, 4) 0.042
Leporinus obtusidens(Br, 12) 0.090 Hypostomussp1 (Br, 9) 0.028
Pinirampu pirinampus(Br, 11) 0.043 Hypostomussp1 (Br, 5) 0.107
Prochilodus lineatus(Br, 16) 0.132 Hypostomussp1 (Br, 8) 0.143
Rhinelepis aspera(Br, 5) 0.032 Hypostomussp1 (Br, 6) 0.060
Hypostomussp2 (Br, 9) 0
Group 2 Hypostomussp2 (Br, 8) 0.059
Iheringichthys labrosus(Br, 11) 0.083 Hypostomussp2 (Br, 5) 0.062
Leporinus friederici(Br, 12) 0.132 Hypostomussp2 (Br, 4) 0.009
Pimelodus ortimani(Br, 15) 0.024 Hypostomussp2 (Br, 6) 0.072
Pimelodussp (Br, 15) 0.006 Hypostomussp3 (Br, 5) 0.048
Schizodon nasutus(Br, 12) 0.092 Hypostomussp3 (Br, 8) 0.091
Hypostomussp3 (Br, 6) 0.053
Group 3 Hypostomussp3 (Br, 4) 0.032
Chetia flaviventris(Af, 1) 0.015 Hypostomussp4 (Br, 4) 0.080
Clarias gariepinus(Af, 2) 0.042 Hypostomussp5 (Br, 4) 0.099
Crenicichla iguassuensis(Br, 3) 0.033 Hypostomussp6 (Br, 4) 0.021
Crenicichlasp (Br, 3) 0.063 Hypostomussp7 (Br, 4) 0.063
Hemichromis elongatus(Af, 1) 0.020 Hypostomus ternetzi(Br, 5) 0.069
Hisonotussp (Br, 4) 0 Loricariichthys anus(Br, 13) 0.023
Hypostomus albopunctatus(Br, 5) 0.031 Loricariichthys platymetopon(Br, 13) 0.050
Hypostomus ancistroides(Br, 5) 0.082 Loricariichthyssp (Br, 13) 0.035
Hypostomus ancistroides(Br, 4) 0.052 Megalancistrus parananus(Br, 5) 0.019
Hypostomus boulengeri(Br, 6) 0.078 Neoplecostomus paranensis(Br, 14) 0
Hypostomus cochliodon(Br, 6) 0.070 Neoplecostomussp (Br, 14) 0.030
Hypostomus cochliodon(Br, 5) 0.039 Oreochromis andersonii(Af, 1) 0.019
Hypostomusaffcommersoni(Br, 7) 0.044 Oreochromis macrochir(Af, 1) 0.031
Hypostomus commersoni(Br, 5) 0.088 Pterygoplichthys anisitsi(Br, 5) 0.032
Hypostomusaffderbyi(Br, 5) 0.037 Pterygoplichthys anisitsi(Br, 6) 0.038
Hypostomus derbyi(Br, 7) 0.011 Serranochromis angusticeps(Af, 1) 0.013
Hypostomus hemanni(Br, 8) 0.068 Serranochromis carlottae(Af, 1) 0.031
Hypostomuscflatirostris(Br, 6) 0.029 Serranochromis condringtonii(Af, 1) 0.035
Hypostomus latifrons(Br, 6) 0.070 Serranochromis giardi(Af, 1) 0.013
Hypostomus microstomus(Br, 5) 0.023 Serranochromis macrocephalus(Af, 1) 0.021
Hypostomus margaritifer(Br, 10) 0.061 Serranochromis robustus(Af, 1) 0.018
Hypostomus margaritifer(Br, 5) 0.106 Serranochromis thumbergi(Af, 1) 0.018
Hypostomus myersi(Br, 7) 0.017 Tilapia rendalli(Af, 1) 0.031
Hypostomus paulinus(Br, 9) 0.027 Tilapia sparrmanii(Af, 1) 0.032
Hypostomus regani(Br, 6) 0.033
Hypostomus regani(Br, 4) 0.056
Hypostomus regani(Br, 5) 0.098
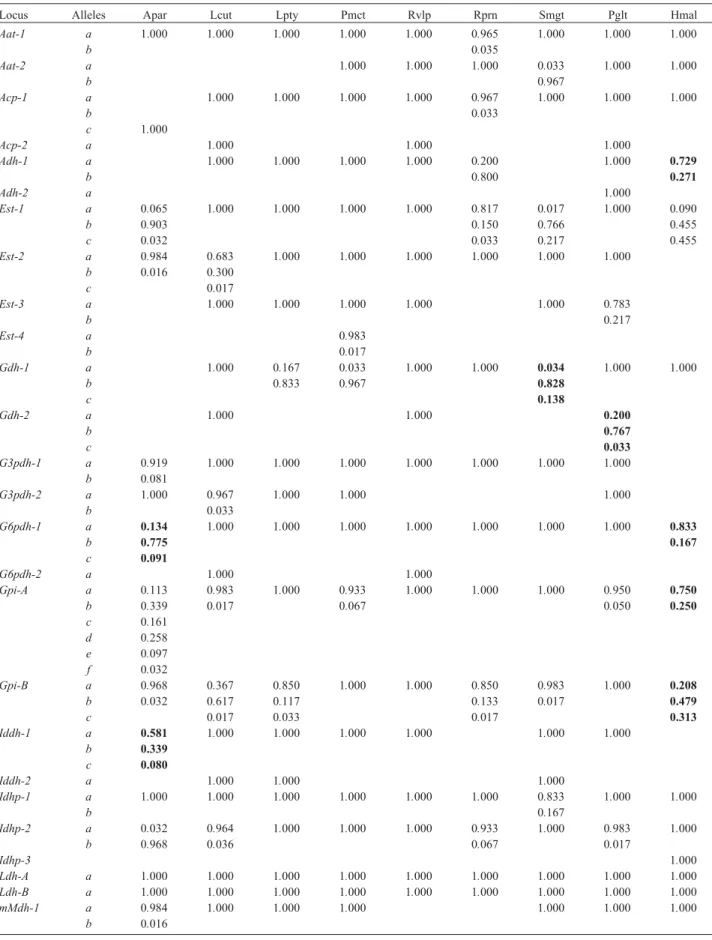
Table 3- Allele frequencies at 36 loci of nine fish species from the Paraná River floodplain. Bold type numbers are loci not in Hardy-Weinberg equilibrium. The nine species were:Astyanax altiparanae (Apar),Leporinus lacustris (Lcut), Loricariichthys platymetopon(Lpty), Pimelodus maculatus(Pmct),Rhaphiodon vulpinus(Rvlp),Roeboides paranensis(Rprn),Serrasalmus marginatus(Smgt),Parauchenipterus galeatus(Pglt) and Hoplias malabaricus(Hmal). Numbers in boldface type indicate thelociwhich are not in Hardy-Weinberg equilibrium.
Locus Alleles Apar Lcut Lpty Pmct Rvlp Rprn Smgt Pglt Hmal
Aat-1 a 1.000 1.000 1.000 1.000 1.000 0.965 1.000 1.000 1.000
b 0.035
Aat-2 a 1.000 1.000 1.000 0.033 1.000 1.000
b 0.967
Acp-1 a 1.000 1.000 1.000 1.000 0.967 1.000 1.000 1.000
b 0.033
c 1.000
Acp-2 a 1.000 1.000 1.000
Adh-1 a 1.000 1.000 1.000 1.000 0.200 1.000 0.729
b 0.800 0.271
Adh-2 a 1.000
Est-1 a 0.065 1.000 1.000 1.000 1.000 0.817 0.017 1.000 0.090
b 0.903 0.150 0.766 0.455
c 0.032 0.033 0.217 0.455
Est-2 a 0.984 0.683 1.000 1.000 1.000 1.000 1.000 1.000
b 0.016 0.300
c 0.017
Est-3 a 1.000 1.000 1.000 1.000 1.000 0.783
b 0.217
Est-4 a 0.983
b 0.017
Gdh-1 a 1.000 0.167 0.033 1.000 1.000 0.034 1.000 1.000
b 0.833 0.967 0.828
c 0.138
Gdh-2 a 1.000 1.000 0.200
b 0.767
c 0.033
G3pdh-1 a 0.919 1.000 1.000 1.000 1.000 1.000 1.000 1.000
b 0.081
G3pdh-2 a 1.000 0.967 1.000 1.000 1.000
b 0.033
G6pdh-1 a 0.134 1.000 1.000 1.000 1.000 1.000 1.000 1.000 0.833
b 0.775 0.167
c 0.091
G6pdh-2 a 1.000 1.000
Gpi-A a 0.113 0.983 1.000 0.933 1.000 1.000 1.000 0.950 0.750
b 0.339 0.017 0.067 0.050 0.250
c 0.161
d 0.258
e 0.097
f 0.032
Gpi-B a 0.968 0.367 0.850 1.000 1.000 0.850 0.983 1.000 0.208
b 0.032 0.617 0.117 0.133 0.017 0.479
c 0.017 0.033 0.017 0.313
Iddh-1 a 0.581 1.000 1.000 1.000 1.000 1.000 1.000
b 0.339
c 0.080
Iddh-2 a 1.000 1.000 1.000
Idhp-1 a 1.000 1.000 1.000 1.000 1.000 1.000 0.833 1.000 1.000
b 0.167
Idhp-2 a 0.032 0.964 1.000 1.000 1.000 0.933 1.000 0.983 1.000
b 0.968 0.036 0.067 0.017
Idhp-3 1.000
Ldh-A a 1.000 1.000 1.000 1.000 1.000 1.000 1.000 1.000 1.000 Ldh-B a 1.000 1.000 1.000 1.000 1.000 1.000 1.000 1.000 1.000
mMdh-1 a 0.984 1.000 1.000 1.000 1.000 1.000 1.000
Discussion
The genetic variability estimated in nine fish species from the upper Paraná River floodplain using Nei’s gene diversity (He) varied from zero to 0.1518 with an average of 0.066, very near to the average of 0.051 described for 195 piscine species from several world-wide localities re-viewed by Wardet al.(1992).
It has been generally accepted that populations of long-distance migratory species have higher genetic vari-ability than non-migratory species because of their higher gene flow. Although this is true for severaltaxa(Wardet al., 1992), our data are not in agreement with this hypothe-sis. In our study, no polymorphic locus was found in a sam-ple of 29 analyzed loci of R. vulpinus, a long-distance migratory species. This is surprising, since other cases of absence of genetic variability have been found in two sed-entary species,Neoplecostomus paranensisfrom the upper Paraná River (Zawadzkiet al., 2004b) andHypostomussp. 2 from the third-order Paraná River tributary Ribeirão Ma-ringá (Paivaet al., 2005). Furthermore,P. maculatus, the other long-distance migratory species analyzed in our study, showed low genetic variability (He = 0.011),
con-trasting with the value of He = 0.132 estimated for other mi-gratory species such asProchilodus lineatus(Revaldaves
et al., 1997) and Leporinus friderici (Chiari and Sodré, 1999).
The genetic variability estimated by us for S. marginatus(He = 0.045) andP. galeatus(He = 0.062) were intermediate compared to the average of 49 freshwater fish species (He = 0,046) estimated by Wardet al.(1994). On the other hand, our estimated values for A. altiparanae
(He = 0,152),H. malabaricus(He = 0,137),R. paranensis
(He = 0,084) andL. lacustris(He = 0,081) were high com-pared to the average found by Wardet al.(1994).
In the nine species analyzed by us the average hetero-zygosity of species with different reproductive strategies was not statistically different when compared amongst each other, which could lead to the conclusion that repro-ductive strategies are not related to genetic variability. However, our results could have been biased because the group of migratory species analyzed by us had only two species, so to compensate for this we carried out an analysis of our set of nine species combined with data on 75 tropical fish species from the literature. When the data for the 84
Table 3 (cont.)
Locus Alleles Apar Lcut Lpty Pmct Rvlp Rprn Smgt Pglt Hmal
sMdh-A a 1.000 1.000 0.100 1.000 1.000 1.000 1.000 1.000 1.000
b 0.900
sMdh-B a 1.000 1.000 1.000 1.000 1.000 1.000 1.000 0.983 0.604
b 0.017 0.396
Mdhp-1 a 0.800 0.767 1.000 1.000 1.000 0.933 1.000 1.000 0.938
b 0.200 0.233 0.067 0.063
Mdhp-2 a 0.484 1.000 1.000 1.000 1.000 1.000 1.000 1.000
b 0.516
Per-1 a 1.000 1.000 1.000 1.000 1.000 1.000 1.000
Per-2 a 1.000 1.000 1.000 1.000 1.000 1.000
Per-3 a 1.000
Pgm-1 a 1.000 0.717 1.000 0.967 1.000 0.467 1.000 0.067 1.000
b 0.283 0.033 0.533 0.433
c 0.500
Sod-1 a 1.000 0.352 1.000 1.000 1.000 1.000 0.633 0.318
b 0.093 0.333 0.0682
c 0.555 0.033
Sod-2 a 0.983 1.000 1.000
b 0.017
Number of specimens (N)
31 30 30 30 42 30 30 30 24
Average number of alleles per locus (K)
1.8 1.3 1.1 1.2 1.0 1.4 1.3 1.3 1.4
polymorphic loci frequency (P0.99)
0.524 0.267 0.107 0.172 0 0.381 0.217 0.226 0.333
Average observed heterozygosity (Ho)
0.068 0.062 0.006 0.011 0 0.052 0.039 0.039 0.048
Average expected heterozygosity (He)
0.152 0.081 0.026 0.011 0 0.084 0.045 0.062 0.137
Standard deviation (SD) 0.225 0.171 0.077 0.028 0 0.142 0.108 0.154 0.220
tropical fish species were analyzed, the relationship be-tween heterozygosity and reproductive strategies were changed and there was a significant difference between the reproductive strategies groups (Figure 2). With this analy-sis, the average heterozygosity values which differed most were those between the G3 parental care group with and the G2 group without parental care. The heterogeneity of the heterozygosity variances between groups may have been due to the number of species analyzed, since the minimum and maximum heterozygosity values were similar among the groups.
The number of surviving offspring is likely to be greater in species with parental care than in species without parental care (Vazzoler, 1996), and species exhibiting pa-rental care tend to be less variable. This can be observed in
L. platymetopon, which brood their fry inside the male’s mouth and is the most abundant species of the Paraná River floodplain. In species without parental care, few offspring are likely to survive, and a greater genetic variability is im-portant to face environmental challenges.
Nei (1987) pointed out three main factors related to heterozygosity level are the quaternary structure of pro-teins, the molecular weight of the protein subunit and the species population size. In addition to these factors, we found that parental care is another factor that should be taken into account to maintain gene diversity. However, since a large number of factors influence the amount of ge-netic variability, we believe that further studies will be nec-essary to elucidate the relationship between genetic variability and ecological features of fish species.
Acknowledgments
The authors would like to thank Dr. Horácio Ferreira Júlio Jr. and Gilmar Lassala for helping with the capture and identification of fish, Jaime L. Pereira for drawing the map, Gislaine Iachstel Manetta for personal help and Dr. Luiz Carlos Gomes for statiscal help. We also thank NUPELIA-UEM for material support, and the Brazilian National Counsel of Technological and Scientific Develop-ment (Conselho Nacional de Pesquisa – CNPq) and Coor-denação de Aperfeiçoamento de Pessoal de Ensino Supe-rior (CAPES) for financial support.
References
Aebersold PB, Winans GA, Tell DJ, Milner GB and Utter M (1987) Manual for starch gel electroforesis: A method for the detection of genetic variation. NOAA Technical Report NMFS 61:1-17.
Agostinho AA and Júlio HF Jr (1999) Peixes da bacia do alto rio Paraná. In: Lowe-McConnell RH (ed) Estudos Ecológicos de Comunidades de Peixes Tropicais. Editora da Univer-sidade de São Paulo, São Paulo, pp 374-400.
Almeida FS and Sodré LMK (1998) Analysis of genetic variabil-ity in three species of Pimelodidae (Ostariophysi, Siluriformes). Genet Mol Biol 21:487-492.
Boyer SH, Fainer DC and Naughton MA (1963) Myoglobin: In-herited structural variation in man. Science 140:1228-1231. Blumer LS (1982) A bibliography and categorization of bony
fishes exhibiting parental care. Zool J Lin Soc 75:1-22. Chiari L and Sodré LMK (1999) Genetic variability in five species
of anostomidae (Ostariophysi, Characiformes). Genet Mol Biol 4:517-523.
Heithaus MR and Laushman RH (1997) Genetic variation and conservation of stream fishes: Influence of ecology, life his-tory, and water quality. Can J Fish Aquat Sci 54:1822-1836. Kirpichnikov VS (1992) Adaptative nature of intrapopulational
biochemical polymorphism in fish. J Fish Biol 40:1-16. Murphy RW, Sites JW, Buth DG Jr and Haufler CH (1996)
Pro-teins: Isozyme electrophoresis. In: Hillis DM, Moritz C and Mable BK (eds) Molecular Systematics. 2nd edition. Sin-nauer Associates, Sunderland, pp 51-120.
Nei M (1987) Molecular Evolutionary Genetics. Columbia Uni-versity Press, New York, 512 pp.
Nei M (1978) Estimation of average heterozygosity and genetic distance from a small number of individuals. Genetics 89:583-590.
Nevo E (1988) Genetic diversity in nature. Evol Biol 23:217-246. Paiva S, Renesto E and Zawadzki CH (2005) Genetic variability
ofHypostomus(Teleostei, Loricariidae) from the Ribeirão Maringá, a stream of the Upper Rio Paraná basin, Brazil. Genet Mol Biol 28:370-375.
Pasteur N, Pasteur G, Bonhomme F, Catalan J and Britton-Davidian J (1988) Practical Isozyme Genetics. Ellis Hor-wood Limited, Chichester, 215 pp.
Renesto E, Zawadzki CH and Revaldaves E (2001) Biochemical taxonomy ofCrenicichla(Pisces, Perciformes, Cichlidae) of the Iguaçu river, Brazil. Brazil Arch Biol Technol 44:15-22. Renesto E, Zawadzki CH and Revaldaves E (2000) Genetic
evi-dence for two species of genusPimelodusLacépède, 1803 (Siluriformes, Pimelodidae) in the Iguaçu River (Brazil). Genet Mol Biol 23:809-813.
Revaldaves E, Renesto E and Machado MFPS (1997) Genetic variability of Prochilodus lineatus (Characiformes, Prochilodontidae) in the Upper Paraná River. Rev Brazil Genet 20:381-388.
Ruvolo-Takasusuki MCC, Machado MFPS and Conte H (2002) Esterase-3 polymorphism in the sugarcane borerDiatraea saccharalis. Genet Mol Biol 25:61-64.
Shaw CR and Prasad R (1970) Starch gel electrophoresis of en-zymes: A compilation of recipes. Biochem Genet 4:297-320.
Val AL, Schwantes AR, Schwantes MLB and Luca PH (1981) Amido hidrolisado de milho como suporte eletroforético. Ciência e Cultura 33:737-741 (Abstract in English). Van Der Bank FH, Grobler JP and Du Preez HH (1992) A
com-parative biochemical genetic study of three populations of domesticated and wild African catfish,Clarias gariepinus. Comp Biochem Physiol 101:387-390.
Van Der Bank FH, Grant WS and Ferreira JT (1989) Electropho-retically detectable genetic data for fifteen southern African cichlids. J Fish Biol 34:465-483.
Vazzoler AEA (1996) Biologia da Reprodução de Peixes Teleós-teos: Teoria e Prática. Editora da Universidade Estadual de Maringá, Maringá, 169 pp.
Ward RD, Skibinski DOF and Woodward M (1992) Protein hete-rozygosity, protein structure and taxonomic differentiation. Evol Biol 26:73-59.
Ward RD, Woodward M and Skibinski DOF (1994) A compari-son of genetic diversity levels in marine, freshwater, and anadromous fishes. J Fish Biol 44:213-232.
Wootton RJ (1990) Ecology of Teleost Fishes. Chapman & Hall, London, 404 pp.
Yeh FC and Boyle TJB (1997) Population genetic analysis of co-dominant and dominant markers and quantitative traits. Belg J Bot 129:156-157.
Zawadzki CH, Renesto E and Bini LM (1999) Allozyme discrimi-nation of three species of the genusHypostomusLacépède, 1803 (Osteichthyes, Loricariidae) from the rio Iguaçu basin (Brazil). Rev Suis Zool 106:91-105.
Zawadzki CH, Reis RE and Renesto E (2000) Allozyme discrimi-nation of three species of Loricariichthys (Siluriformes, Loricariidae) from Southern Brazil. Rev Suis Zool 107:1-12. Zawadzki CH, Weber C, Pavanelli CS and Renesto E (2002) Mor-phological and biochemical comparison of two allopatric
populations of Hypostomus margaritifer (Regan, 1907) (Osteichthyes, Loricariidae) from the upper Paraná River basin, Brazil. Acta Scientiarum 24:499-505.
Zawadzki CH, Renesto E, Paiva S and Lara-Kamei MCS (2004a) Allozyme differentiation of four populations ofHypostomus (Teleostei, Loricariidae) from Ribeirão Keller, a small stream in the upper Rio Paraná basin, Brazil. Genetica 121:251-257.
Zawadzki CH, Alves AL, Renesto E and Oliveira C (2004b) Bio-chemical evidence of a possible new species of Neoplecostumus (Teleostei, Loricariidae) from the upper Rio Paraná basin, Brazil. Biochem Syst Ecol 32:573-582. Zawadzki CH, Renesto E, Reis RE, Moura MO and Mateus RP
(2005) Allozyme relationships in hypostomines (Teleostei, Loricariidae) from the Itaipu Reservoir, Upper Rio Paraná basin, Brazil. Genetica 123:271-283.
Internet Resource
Gotelli NJ and Entsminger GL (2006) EcoSim: Null models soft-ware for ecology. Version 7. Acquired Intelligence Inc. & Kesey-Bear. Jericho, VT 05465. http://garyentsminger.com/ ecosim/index.html.