An Acad Bras Cienc (2018) 90 (2 Suppl. 1) Anais da Academia Brasileira de Ciências (2018) 90(2 Suppl. 1): 2359-2373
(Annals of the Brazilian Academy of Sciences)
Printed version ISSN 0001-3765 / Online version ISSN 1678-2690 http://dx.doi.org/10.1590/0001-3765201720170120
www.scielo.br/aabc | www.fb.com/aabcjournal
Assessment of the occurrence and richness of arbuscular mycorrhizal fungal spores
by direct analysis of field samples and trap culture – a comparative study
PATRÍCIA L. LEAL1,2
, TEOTONIO S. DE CARVALHO1
, JOSÉ OSWALDO SIQUEIRA1,3
and FATIMA M.S. MOREIRA1
1
Departamento de Ciência do Solo, Universidade Federal de Lavras, Av. Doutor Sylvio Menicucci, 1001, Bairro Kennedy, 37200-000 Lavras, MG, Brazil
2
Instituto Multidisciplinar em Saúde, Universidade Federal da Bahia, Rua Rio de Contas, 58, Quadra 17, Lote 58, Bairro Candeias, 45029-094 Vitória da Conquista, BA, Brazil
3
Instituto Tecnológico Vale para Desenvolvimento Sustentável, Rua Boaventura da Silva, 955, Nazaré, 66055-090 Belém, PA, Brazil
Manuscript received on February 20, 2017; accepted for publication on April 6, 2017
ABSTRACT
In this work, we hypothesized that two spore-based methods, direct analysis of field samples and trap
cultures, simultaneously used for assessment of occurrence and species richness of arbuscular mycorrhizal
fungi (AMF) may vary in their efficiency according to the environmental conditions and the total AMF
species richness of the evaluated ecosystem. The performance of both methods was analyzed based on two
datasets: 1) a complete site x species matrix compiled from two studies in different land uses in the Amazon using direct analysis of field samples and trap cultures. 2) Total number of AMF morphotypes detected by both methods in published manuscripts across several ecosystems. From dataset 1, direct analysis of field
samples revealed 57 morphotypes, whereas only 21 of these were detected by trap culture. Community
variation (beta diversity) analysis revealed that field samples are far more sensitive in detecting shifts in
AMF community composition among land uses than trap cultures in the Amazon region, with the combined
results of both methods being not better than that obtained only by direct analysis of field samples. Analysis of dataset 2 showed that the relative performance of trap cultures, using direct analysis of field sample as
reference, was inversely related to the total observed AMF species richness.
Key words: alpha and beta diversity, diversity assessment methods, Glomeromycota, spore counts, taxonomy.
Correspondence to: Fatima Maria de Souza Moreira E-mail: [email protected]
* Contribution to the centenary of the Brazilian Academy of Sciences.
INTRODUCTION
The highly specialized Glomeromycotan arbuscular mycorrhizal fungi (AMF) are important components of the belowground biodiversity because of the ubiquitous root symbiosis they
form with the vast majority of plant species occurring in most terrestrial ecosystems and because of their functional role in plant nutrition, growth, and community structure. Their presence is usually assessed by quantitative and qualitative assessments of mycorrhizal colonization and by spore counts and identification from field soils. The latter method provides the baseline to assess
An Acad Bras Cienc (2018) 90 (2 Suppl. 1)
2360 PATRÍCIA L. LEAL et al.
draw inferences about community composition. Taxonomic classification of AMF spores is usually evaluated by the analysis of morphological characters of AMF asexual spores (Schenck and Pérez 1988) and by molecular techniques targeting specific rRNA gene sequences (Liang et al. 2008). Although suitable protocols and primers (Helgason et al. 1998, Kruüger et al. 2012) have been developed to identify AMF species from field samples (Avio et al. 2009, Öpik et al. 2013), the use of molecular techniques is still limited because it yields DNA sequences that may or may not match traditional AMF morphospecies (Robinson-Boyer et al. 2009, Young 2012). Extraction and identification of spores either directly from field soil or from trap cultures are commonly used procedures in AMF ecological and applied research because spores are the ultimate fungal unit required to establish AMF in single cultures, which are then used for further evaluation of functional traits. Common constraints attributed to field collected spores are the low quantity of spores, parasitism by soil fauna and bacteria, and lack of all spores subcellular structures necessary to an accurate identification of species. Moreover, not all AMF in the community might be sporulating at the sampling time, what may underestimate diversity (Morton et al. 1995). Therefore, multiplication of the indigenous fungi in host plants under controlled conditions is an alternative for triggering sporulation of cryptic AMF species. This procedure is known as trap culture and has been widely used in AMF ecological studies (Bever et al. 1996, Stutz and Morton 1996, Stürmer 1998, Leal et al. 2009, Mergulhão et al. 2009). It usually gives large number of viable spores containing all morphological structures for an accurate identification and detection of non-sporulating AMF species.
These two spore-based methods (spores extracted directly from field soil and trap cultures) are believed to be complementary and
are frequently used together in the hope that they can give more accurate assessments of AMF communities, but this implies in at least doubling the total costs of the analysis, imposing restrictions on the sampling effort under a limited availability of resources. Furthermore, the extent to which the complementarity between these methods is true and its dependency on environmental conditions have not yet been explicitly addressed. Studies have demonstrated contrasting results on AMF richness obtained through spore analysis collected from field versus trap cultures (Stürmer 1998, Ferrol et al. 2004, Tchabi et al. 2008, Robinson-Boyer et al. 2009). Some studies recovered none or only few species exclusively in trap cultures (Bever et al. 1996, Melloni et al. 2003, Oehl et al. 2003) while others had detected a large number of species (Stutz and Morton 1996, Beauchamp et al. 2006).
An Acad Bras Cienc (2018) 90 (2 Suppl. 1)
ARBUSCULAR MYCORRHIZAL FUNGI DIVERSITY METHODS 2361
MATERIALS AND METHODS
DATASETS
Two datasets were used to assess the relative performance of the trap culture method (herein referred as trap) compared to field spore extraction (herein referred as field) in recovering AMF cryptic species. The first dataset is from of the project Conservation and Sustainable Management of Below-Ground Biodiversity, implemented through the Global Environment Facility. Data on AMF occurrence, abundance and species richness were recovered from field-collected spores (Stürmer and Siqueira 2011) and from trap cultures established with the same soil samples from field (Leal et al. 2009). Both studies include information on AMF diversity from soils collected at the same time, in the same sampling points from different land uses (pristine Amazon forest, old secondary forest, young secondary forest, agroforest systems, field crops and pasture) in the western Amazon region, Brazil. Detailed characterization of this area is found in Moreira et al. (2009), and methodologies for spore extraction, counts and identification, as well as trap cultures conditions are described in Stürmer and Siqueira (2011) and Leal et al. (2009).
The second dataset was compiled from a literature search (Web of Science database) on November 2015, using the strings “arbuscular mycorrizal fungi”, “diversity”, “field”, and “trap cultures”, resulting in a total of 24 publications from distinct continents and ecosystems (Table I) reporting assessment of AMF species richness from traps and field methods. From these publications data on total number of AMF species detected by each method (trap and field) and on the total richness were obtained for subsequent analysis.
For our purpose, relative trap performance was defined as the ratio of species richness detected by trap to that detected by field (trap/field) expressed as fraction or as its equivalent percentage. To compare field and trap methods, we used the recovery ratio of
trap/field and the equivalent percentage. In order to calculate the extrapolated species richness for each method, we applied the first-order Jackknife index, using the package Vegan in the R environment (R Development Core Team 2015). Confidence intervals were calculated from 1,000 resampling data.
To evaluate the association between AMF spores richness and diversity assessment method (trap and field), we used the A component of the equation for the indicator value index (IndVal) described by Dufrêne and Legendre (1997), for absence and presence data, as follows:
√(Apa) = √(np / n)
Where n is the number of times that a particular species occurs across all points; and np is the number of times that the same species occurs for a given group (sampling method). Only non rare AMF species (i.e., those recovered from more than two samples) were selected for this analysis. This analysis was performed using the Indicspecies package in the R environment (R Development Core Team 2015).
An
Acad Bras Cienc
(2018)
90
(2 Suppl. 1)
2362
P
A
TRÍCIA
L. LEAL
et al.
TABLE I
Number of AMF morphotypes recovered from field and traps from distinct ecosystem sand climate regions.
Reference Country Code
Number of AMF Morphotypes
Ecosystem/samples
number Trap species Climate
Field Trap Trap
Only
Field Only
Total in Both
Stürmer
(1998) USA 1
4 6 3 1 7 Revegetated Area/ND
Sorghum sudanense
Sub-Tropical
6 9 3 1 10 Grassland/ND Temperate
7 11 6 2 13 Maize field/ND Temperate
4 5 2 1 6 Old Mining Site/ND Temperate
Eom et al.
(2000) USA 2 16 9 1 8 17 Grassland/ND Sorghum bicolor Temperate
Antoniolli et
al. (2002) Australia 3 12 13 4 3 16 Pasture/43
L. perenne, T. subterraneum, P.
lanceolata and Sorghum sp.** Sub-tropical
Jansa et al.
(2002) Switzerland 4 15 16 3 2 18 Maize and wheet fields/30
Zea mays; Allium porrum;
Plantago lanceolata and
Helianthus annuus
Temperate
Klauberg Filho et al. (2002)
Brazil 5 9 21 12 0 21 Heavy metal contaminated
área/24 Brachiaria decumbes Tropical
Cousins et al.
(2003) USA 6 14 15 4 3 18 Urban ecosystem/20 Sorghum sudanese Sub-tropical
Liu and Wang
(2003) China 7
11 11 0 0 11 Forest/5*
Temperate Sub-tropical
15 15 0 0 15 Coal mining site/5*
Zea mays L., Nicotiana
tabacum L.,Trifolium repens
Lin and Potentilla anserina
L.**
5 5 0 0 5 Saline soil/5*
Oehl et al. (2003)
France, Germany
and Switzerland
8 22 23 4 22 45 Agricultural soils/32* Plantago lanceolata, Trifolium
pratense and Lolium perene*** Temperate
Oehl et al.
(2004) Switzerland 9 19 32 15 2 34 Crop/24*
Plantago lanceolata, Trifolium
pratense and Lolium perene*** Temperate
Ferrol et al.
(2004) Spain 10 1 5 4 0 5
Semi-arid under
desertification/27* P. lentiscusrepens*** e Trifolium Mediterranean
Oliveira et al.
(2005) Portugal 11 3 6 3 0 6
Area with industrial wastes/ND
Zea mays L. and Trifolium
An
Acad Bras Cienc
(2018)
90
(2 Suppl. 1)
ARBUSCULAR
MYCORRHIZAL
FUNGI
DIVERSITY
METHODS
2363
Reference Country Code
Number of AMF Morphotypes
Ecosystem/samples
number Trap species Climate
Field Trap Trap
Only
Field Only
Total in Both
Mathimaran et
al. (2005) Switzerland 12 8 5 1 4 9
Highlyfertilized (P) field/
ND
Crotalaria grahamiana, Allium
porrum L., Zea mays L. and
Helianthus annuus L.***
Temperate
Moreira et al.
(2007) Brazil 13
15 7 5 13 20 Araucaria Forest/15
Zea mays and Arachishy
pogaea** * and A.
angustifólia**
Sub-Tropical
13 8 4 9 17 Reforested área/15
Mathimaran et
al. (2007) Africa 14 10 16 8 2 18 Cropped área/16*
Crotalaria grahamiana, Allium
porrum L., Zea mays L. and
Helianthus annuus L.***
Tropical
Tchabi et al.
(2008) Africa 15 59 7 1 53 60 Savanna/24*
Stylosanthes guianensis e
Brachiaria humidicola*** Tropical
Bartz et al.
(2008) Brazil 16 20 14 5 9 23
Maize and soybean fields/
ND Brachiaria brizantha Sub-tropical
Wang et al.
(2008) China 17 16 18 14 12 30 Crop/40 P. lanceolata Sub-tropical
Cuenca and
Lovera (2010) Venezuela 18 50 12 2 40 52 Shrubland/3* Vignea luteola Tropical
Oehl et al. (2010)
Central
Europe 19 58 40 3 21 61
Intensively cropped área/64*
Lolium perenne, Trifolium
pratense e Plantago
lanceolata***
Temperate
Oehl et al.
(2011) Switzerland 20 28 17 0 11 28
Subalpine coniferous forest/28*
Plantago lanceolata, Lolium
perenne, Trifolium pratense
and Hieracium pilosella** *
Glacial
Chaturvedi et
al. (2012) India 21 24 9 1 16 25
Oat and Pine woodland, and cropped area/40
Sorghum bicolor, Vigna mungo,
Tagetus minuta and Zea mays
L.***
Tropical
Songachan and Kayang (2014)
India 22 68 33 3 38 71
Natural and cultivated sites of Flemingia vestita
(Fabaceae)/20.
Oryza sativa L., Paspalum
notatum Flugge, Trifolium
amadurece L. e Zea mays L.***
Tropical
Balázs et al.
(2015) Hungary 23 19 22 12 9 31 Semiarid sandy areas/30 Plantago lanceolata L Temperate
Säle et al.
(2015) Switzerland 24 48 33 5 30 53
Cropped area under conservation tillage and
organic farming/112
Plantago lanceolata, Lolium
perenne,Trifolium pratense
s.l. and Hieracium pilosella ***
Temperate
ND: No ‘determinated’; *Composite samples; **Separately; *** Consortium.
An Acad Bras Cienc (2018) 90 (2 Suppl. 1)
2364 PATRÍCIA L. LEAL et al.
LUSs was conducted within each method, using the Bonferroni correction to control Type-I error inflation. All analyses were performed using R.
The relationship between trap efficiency and total richness using published data was tested with a linear model, using the log-transformed trap efficiency as response variable and total richness as explanatory variable. It is important to stress that our work did not applied meta-analysis methods because measures of variability (standard error or standard deviation) for total species richness within studies are rarely reported.
RESULTS
AMAZON DATA
In soils from western Amazon, 62 AMF morphotypes were recovered from different land uses (LUs) by both methods. From this total, 43 morphotypes (70%) were identified to known species pertaining to families Acaulosporaceae, Glomeraceae, A r c h a e o s p o r a c e a e , D i v e r s i s p o r a c e a e , Paraglomeraceae, and Gigasporaceae. Field samples yielded 57 morphotypes, whereas 21 species were detected in trap cultures. From the total number of species, nine were of rare occurrence, defined as those occurring in less than two samples out of 98 total number of samples. From these, three were exclusive to trap (Gigaspora margarita, Glomus sp9, and Paraglomus occultum) and six were detected exclusively in field (Glomus magnicaule cf, Glomus nanolumen cf, Glomus tortuosum, Diversispora trimurales cf, Dentiscutata biornata, and Dentiscutata scutata).
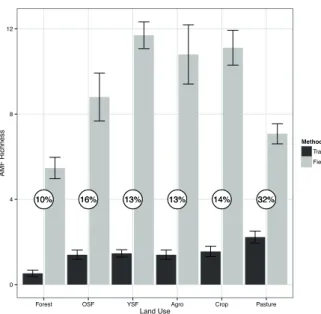
Mean species richness was 9.2 and 1.4 per sample in field and in trap cultures, respectively. The mean AMF species richness detected from field collected spores per sampling point (α-diversity) varied from 5.5 in forest to 11.7 in young secondary forest, whereas in traps it ranged from 0.5 in forest to 2.2 in pasture (Figure 1). Trap relative performance for AMF recovery ranged from 10 to
16% in most land uses, except at pasture where it was 32%. Number of AMF spores recovered from field was not correlated with number of spores detected in traps (Figure 2).
From the 20 samples with highest spore counts (those above the 0.8 quantile) for each method, i.e., those samples with more than 910 spores for trap and 150 for field, only four were above the 0.8 quantile for spore number in both field and trap culture simultaneously. Spore density varied with land use and, in contrast to morphotypes richness, it was much higher (3.28-fold higher) in traps than in field, with an average of 4,646 and 1,331 spores per sample, respectively. In the pristine forest, spore counts were very low by both methods (Table II). Acaulospora delicata and A. gedanensis were the most prolific sporulators in most land uses and in general the three species with highest relative abundance were not the same for traps and field (Table II).
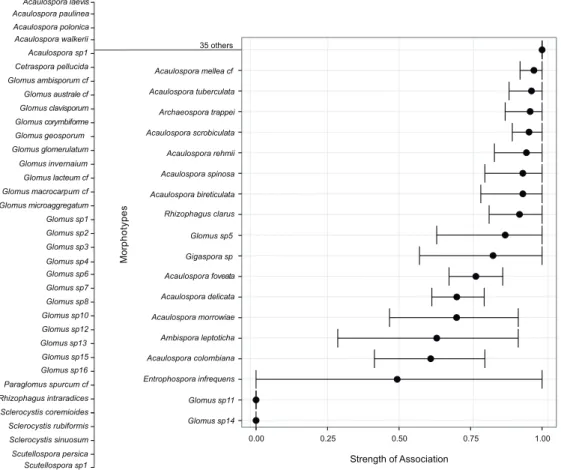
The strength of association between morphotype occurrence and detection method showed that the two methods differ in their ability to detect most of the morphotypes (Figure 3). The trap culture method primarily detected Glomus sp. 11 and Glomus sp, 14, which correspond to 9% of the total morphotypes richness detected from traps. Conversely, 35 morphotypes were detected only from field samples and they belonged to Acaulospora, Cetraspora, Glomus, Diversispora, Funneliformis, Rhizophagus, Sclerocystis, Racocetra, and Scutellospora. From the 28 Glomus morphotypes detected in this study, only Glomus sp5 was detected by both methods. From the 16 species detected by both methods, most pertained to Acaulospora (10). Other genera detected by both methods were Entrophospora, Gigaspora, Ambispora and Rhizophagus, although they were more efficiently detected in field (except for E. infrequens).
An Acad Bras Cienc (2018) 90 (2 Suppl. 1)
ARBUSCULAR MYCORRHIZAL FUNGI DIVERSITY METHODS 2365
10% 16% 13% 13% 14% 32% 10% 16% 13% 13% 14% 32%
0 4 8 12
Forest OSF YSF Agro Crop Pasture
Land Use AMF Richness Method Trap Field ● ● ● ● ● ● ● ● ● ● ● ● ● ● ● ● ● ● ● ● ● ● ● ● ● ● ● ● ● ● ● ● ● ● ● ● ● ● ● ● ● ● ● ● ● ● ● ● ● ● ● ● ● ● ● ● ● ● ● ● ● ● ● ● ● ● ● ● ● ● ● ● ● ● ● ● ● ● ● ● ● ● ● ● ● ● ● ● ● ● ● ● ● ● ● ● ● ● 0.8 quantile 0.8 quantile 0 1000 2000 3000
0 100 200 300 400
Spores in Field Samples
Spores in T
rap Samples
TABLE II
Total number of spores (in 50 mL soil) recovered in fi eld and traps and species with the highest relative abundance
(%) from distinct land uses in western Amazon.
Land use
Total Number of Spores (50
mL)
Morphotypes and spore abundance (%)
Field Traps Field Trap
Forest 370 242
Acaulospora delicata (46%)
Acaulospora delicata (54%)
Acaulospora gedanensis cf.
(17%)
Glomus sp11 (43%)
Acaulospora mellea (8%)
Gigaspora margarita (12%) Old Secondary Forest 764 2597 Glomus glomerulatum (29%)
Glomus sp11 (80%)
Archaeospora trappei (7%)
Acaulospora morrowiae
(14%) G.
corymbiforme, A. scrobiculata, A. walkerii (6%)
Acaulospora delicata (11%)
Young Secondary Forest 2351 13221 Acaulospora gedanensis cf. (19%) Acaulospora foveata (32%)
Acaulospora delicata (15%)
Glomus sp11 (21%)
Glomus corymbiforme
(11%)
Acaulospora delicata (20%)
Agroforestry 744 1855
Acaulospora gedanensis cf.
(28%)
Glomus sp.11 (39%)
Acaulospora delicata (27%)
Acaulospora delicata (28%)
Glomus corymbiforme
(6%)
Glomus sp14(18%)
Crop 2100 4398
Acaulospora delicata (31%)
Glomus sp.11 (58%)
Acaulospora gedanensis cf.
(17%)
Acaulospora delicata (28%)
Glomus sp5 (9%)
Acaulospora morrowiae
(10%)
Pasture 1657 5568
Acaulospora gedanensis cf.
(33%)
Glomus sp.11 (37%)
Glomus sp15 (21%)
Acaulospora foveata (30%)
Acaulospora colombiana (19%) Acaulospora colombiana (29%)
Mean 1331 4646
Figure 1 – Mean AMF species richness per sample detected by
spores recovered from fi eld (grey bars) or trap culture (black bars). The numbers inside white circles indicate the effi ciency
of trap culture (expressed as percentage) for detecting the
morphotypes recovered by fi eld sampling. Error bars represent
the standard error of the mean (n = 17 for Forest; n = 10 for OSF; n = 30 for YSF; n = 10 for Agroforestry; n = 18 for Crop; n = 13 for Pasture).
Figure 2 – Dispersion plot of AMF spore counts for samples
from fi eld and traps. Black lines indicate the 0.8 percentile
An Acad Bras Cienc (2018) 90 (2 Suppl. 1)
2366 PATRÍCIA L. LEAL et al.
richness for the whole area (γ-diversity) estimated by the Jackknife’s method indicated that field can recover up to 80% of the maximum estimated richness while trap cultures can recover only around 20%.
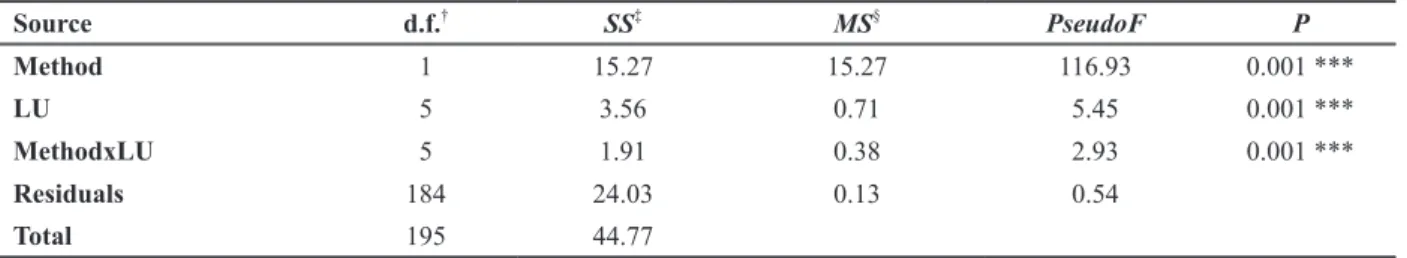
The ordination based on community composition dissimilarity (Jaccard index) revealed that AMF communities are mainly separated along the horizontal axis, relating to the effects of methods (Figure 4). They were also separated by land use, depending upon methods. Points belonging to different land uses were well separated in field, whereas in trap cultures they were clustered, indicating lower resolution power for detecting effects of land uses on AMF community in the trap method. Based on PERMANOVA, significant effects on community dissimilarity (Jaccard index) were found for method, land use, and the interaction method x land use (Table III). Multiple comparisons of land use within methods (Table IV) show that, for trap, significant differences among land uses occurred only when forest was compared to pasture, crop, or young secondary forest. In contrast, for direct analysis of field samples, most comparisons among land uses were highly significant. To test the hypothesis of complementarity of the two methods for revealing variability on AMF species composition among different sites (β-diversity), the matrices of community composition obtained by both methods were combined and the Jaccard index was calculated on it. Applying PERMANOVA on the resulting dissimilarity matrix resulted in a pseudo F5,92 for land use of 5.02, and the results of multiple comparisons were similar to those obtained by field alone.
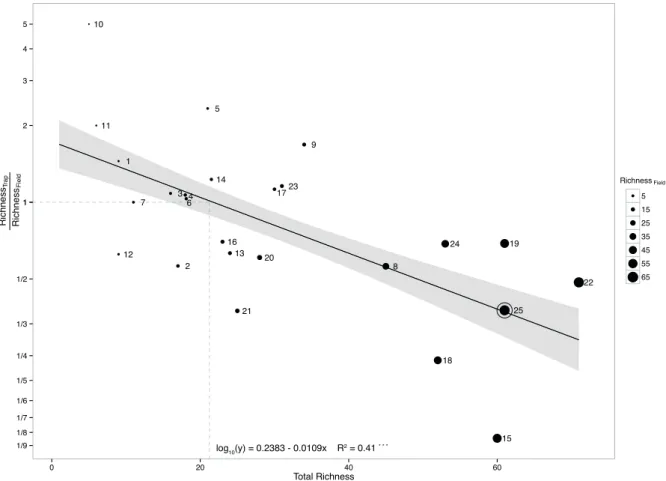
To address the question of whether method performance is related to total AMF species richness, the association between trap relative performance (trap to field richness ratio) and total AMF richness was analyzed (Figure 5). The estimated model was highly significant (F1,20 = 17, P < 0.001) with a negative relationship between
trap relative performance and total AMF species richness. In some studies, traps detected five times more AMF than direct analysis of field samples whereas in other studies traps detected only 1/8 of the richness found in field. Based on the estimated model, a total AMF richness of 21 was defined as the threshold for trap relative performance because at this value the estimated trap/field ratio equals one and, consequently, both methods performs equally well. Below that point, trap performs betters than field.
DISCUSSION
AMAZON DATA
An Acad Bras Cienc (2018) 90 (2 Suppl. 1)
ARBUSCULAR MYCORRHIZAL FUNGI DIVERSITY METHODS 2367
l
l
l
l l
l
l l
Glomus sp11
Glomus sp14 Entrophospora infrequens Acaulospora colombiana Ambispora leptoticha Acaulospora morrowiae Acaulospora delicata Acaulospora foveata Gigaspora sp Rhizophagus clarus Acaulospora bireticulata Acaulospora spinosa Acaulospora rehmii Acaulospora scrobiculata Archaeospora trappei Acaulospora tuberculata Acaulospora mellea cf
Glomus sp5
0.00 0.25 0.50 0.75 1.00
Strength of Association
M
o
rphotypes
Scutellospora persica Scutellospora sp1 Cetraspora pellucida
Paraglomus spurcum cf Glomus sp13
Sclerocystis sinuosum Sclerocystis rubiformis Glomus microaggregatum Glomus macrocarpum cf Glomus lacteum cf
Rhizophagus intraradices Glomus glomerulatum
Glomus invernaium
Sclerocystis coremioides Glomus clavisporum Glomus australe cf Glomus ambisporum cf
Glomus sp10 Glomus sp8 Glomus sp6 Glomus sp4
Glomus sp7
Glomus sp12 Glomus sp3 Glomus sp2
Glomus sp15 Glomus sp16 Glomus sp1 Glomus corymbiforme Glomus geosporum Acaulospora polonica Acaulospora paulinea Acaulospora laevis
Acaulospora walkerii
Acaulospora sp1 35 others
●
●
●
●
●
●
● ● ●
● ●
● ●
● ●
● ● ●
●
● ● ●
● ● ●
● ● ●
● ● ● ●
● ● ● ●
● ● ●
Stress = 0.19
−0.5
0.0
0.5
1.0
−1.0 −0.5 0.0 0.5 1.0
NMDS1
NMDS2
Land Use
● ●
●
●
● ●
● ●
●
● ● ●
Forest Old Secondary Forest Young Secondary Forest Agroforestry Crop Pasture
Method
●Field Trap
Figure 3 – Strength of association between occurrence of morphotypes from fi eld samples as revealed by
the “A” component of the indicator value index, varying from 0 to 1.0. The value 0 indicates no occurrence
of morphotypes in fi eld samples while 1.0 indicates exclusive occurrence in that method. Fourteen rare
morphotypes (occurring in less than two samples out of 98 samples) were not considered.
An Acad Bras Cienc (2018) 90 (2 Suppl. 1)
2368 PATRÍCIA L. LEAL et al.
TABLE IV
Multiple pairwise comparisons of community composition of FMA within trap culture (upper panel) and directly field
sampling (lower panel).
Land Use Forest OSF YSF Agro Crop Pasture
Forest - 4** 4** 7***
OSF 2**†
-YSF 4***
-Agroforestry 2** 2**
-Crop 2***
-Pasture 6*** 5*** 8*** 7*** 8***
-†
Pseudo F value – mean dissimilarity among groups / mean dissimilarity within groups – for each comparison followed by the
significance level: *
0.05; **
0.01; ***0.001. Non-significant values are not shown. Values in the upper diagonal (lightgrey) compare
land use within trap method whereas the values in the lower diagonal (dark grey) compare land use within directly field sampling
method.
TABLE III
PERMANOVA on Jaccard dissimilarity matrix for AMF communities sampled by two methods in six different land uses.
Source d.f.† SS‡ MS§ PseudoF P
Method 1 15.27 15.27 116.93 0.001 ***
LU 5 3.56 0.71 5.45 0.001 ***
MethodxLU 5 1.91 0.38 2.93 0.001 ***
Residuals 184 24.03 0.13 0.54
Total 195 44.77
†
Degrees freedom;
‡
Sum of squares;
§
Mean square;
***Significant at the 0.001 probability level.
able to quickly colonize and grow inside roots to achieve enough mycelium biomass to sporulate. These aspects may restrict morphotypes abundance and richness in trap cultures, reducing the number of species in traps relative to field conditions as reported in several studies from different ecosystems (Eom et al. 2000, Cuenca and Lovera 2010, Oehl et al. 2011, Silva et al. 2012, Stürmer and Bellei 1994). In fact, traps from Amazonian soils were able to recover only about one third of the total morphotype richness and the recovery efficiency of trap varied from as low as 10% in samples from forest to 32% in pasture samples.
Despite the fact that trap cultures acted as a filter for the majority of the sporulating
An Acad Bras Cienc (2018) 90 (2 Suppl. 1)
ARBUSCULAR MYCORRHIZAL FUNGI DIVERSITY METHODS 2369
●
● ● ●
●
● ●
● ●
●
●
● ●
●
● ●
●
●
●
●
●
● ●
●
● ●
1
2 3 4
5
6 7
8 9
10
11
12 13
14
15 16
17
18
19
20
21
22 23
24
25
5
4
3
2
1 1
1/2
1/3
1/4
1/5
1/6
1/7
1/8
1/9
0 20 40 60
Total Richness
● ●
● ●
● ● ● ● ● ●
● ●
● ●
5
15
25
35
45
55
65
Richness
T
rap
Richness
Field Richness Field
log10(y) = 0.2383 - 0.0109x R 2 = 0.41 * * *
predominance of k-strategists AMF species (low colonization ability, low sporulation in forest) to r-strategists (high sporulation, low spore dormancy, low hyphal growth habit, and low persistence in other land use systems) as suggested by Hart et al. (2001).
AMF community composition, dominant morphotypes, and species richness were also quite distinct between the two methods. The nonmetric multidimensional scaling analysis indicates that communities recovered by traps are quite similar among land uses in the Amazon, suggesting a uniform selective pressure upon indigenous AMF species in the trap environment. Analysis of Jaccard dissimilarity matrix, an indicator of
β-diversity, showed that variability in community composition is at the order of 20-fold higher for extraction method than for land use. Therefore, trap technique by itself performs poorly in assessing β-diversity in distinct land uses in this region because it may underestimate the impact of land use on AMF community composition, except under very contrasting environments like forest compared to pasture, crop and young secondary forest. Furthermore, in this study, the combined results of trap and direct analysis of fi eld samples did not improve the results obtained by the latter method alone, indicating no complementary eff ect of traps for assessing variations in AMF community composition (beta diversity) in this case.
Figure 5 – Trap relative performance as related to AMF richness detected by direct analysis of fi eld samples based on publications
1 to 24 (see Table I) and results of the present study (25). The estimated model (F1,20 = 17; P< 0.001) is shown at the bottom. The
An Acad Bras Cienc (2018) 90 (2 Suppl. 1)
2370 PATRÍCIA L. LEAL et al.
Literature survey
Data from distinct surveys published indicate that AMF species richness ranges from 1 to 61 in field samples and 5 to 40 in traps (Table I). Such variation makes it difficult to choose the right procedure to assess AMF spore abundance and richness, and little is known about the factors determining such variability. One of such factors could be the AMF species richness originally present in the soil. In some cases, trap performed well in relation to direct analysis of field samples in detecting AMF (Ferrol et al. 2004), while in others it performed poorly (Tchabi et al. 2008). Trejo-Aguilar et al. (2013) observed a reduction from 17 species, detected under field conditions, to only one species (Claroideoglomus etunicatum) after 13 successive cycles of trap cultures. Our results indicate a general trend of higher trap relative performance in soils with low AMF richness and lower trap relative performance when field soils have a high AMF richness. This negative relationship may be the result of traps exerting a high selective pressure upon AMF species favoring those with more environmental flexibility, i.e. those that sporulate more abundantly. Indeed, most of the spores recovered in traps cultures from published surveys belonged to Glomeraceae (data not shown), which harbors species known as good sporulators.
By using the fitted model (Figure 5), we can define that when the trap/field ratio equals one, these methods have similar performance and this happens when total richness is 21, a value that can be defined as a threshold for trap relative performance. Below that value, trap outperforms direct analysis of field samples in assessing AMF, while at higher richness direct analysis of field samples performs better. In western Amazon soils, we detected overall 61 AMF species and this may explain why trap method was not efficient in detecting cryptic species in that region. Trap cultures have been highly efficient to assess AMF richness in some
circumstances (Klauberg-Filho et al. 2002, Ferrol et al. 2004, Oliveira et al. 2005). This efficiency seems also to be dependent on the environment, with higher trap efficiency being found in stressful environments such as contaminated sites or in drier climates compared to more mesic conditions.
CONCLUSIONS
Trap technique does not always substantially improves the results obtained by direct analysis of field samples, especially in sites with high AMF species richness. In soils from western Amazon, it underestimated AMF species richness in distinct land uses and was highly selective for two Glomus
morphotypes. Considering the data from different environments, the relative performance of trap in detecting AMF species is inversely related to total AMF richness. Roughly, trap technique should not be used by itself to assess AMF communities when the AMF species richness is less than 21 species per site, whereas the sole use of direct analysis of field samples should be avoided if the total AMF richness is below that value.
ACKNOWLEDGMENTS
An Acad Bras Cienc (2018) 90 (2 Suppl. 1)
ARBUSCULAR MYCORRHIZAL FUNGI DIVERSITY METHODS 2371
Mexico, and Uganda. This project was coordinated by the Tropical Soil Biology and Fertility Institute of CIAT (TSBF-CIAT with co-financing from the Global Environmental Facility - GEF), and implementation support from the United Nations Environment Programme (UNEP). Views expressed in this publication are those of their authors and do not necessarily reflect those of the authors’ organization, the UNEP and the GEF.
REFERENCES
ANTONIOLLI ZI, FACELLI E, O’ CONNOR P, MILLER D, OPHEL-KELLER K AND SMITH S. 2002. Spore communities of arbuscular mycorrhizal fungi and mycorrhizal associations in different ecosystems, South Australia. R Bras Ci Solo 26: 627-635.
AVIO L, CRISTANI C, STRANI P AND GIOVANNETTI M. 2009. Genetic and phenotypic diversity of geographically different isolates of Glomus mosseae. Can J Microbiol 55: 242-253.
BALÁZS TK, BŁASZKOWSKI J, CHWAT G, GÓRALSKA
A, GÁSPÁR BK, LUKÁCS AF AND KOVÁCS GM. 2015. Spore-based study of arbuscular mycorrhizal fungi of semiarid sandy areas in Hungary, with Diversispora jakucsiae sp. nov. Mycol Progress 14: 1021.
BARTZ MLC, CARRENHO R, GOMES-DA-COSTA SM, COLOZZI FILHO A AND TORMENA CA. 2008. Comparação entre as técnicas de amostragem direta em campo e cultura-armadilha para mensuração da diversidade de espécies de fungos micorrízicos arbusculares. Hoehnea 35: 159-164.
BEAUCHAMP VB, STROMBERG JC AND STUTZ JC.
2006. Arbuscular mycorrhizal fungi associated with
Populus-Salix stands in a semiarid riparian ecosystem. New Phytol 170: 369-380.
BEVER JD, MORTON JB, ANTONOVICS J AND SCHULTZ
PA. 1996. Host dependent sporulation and species diversity
of arbuscular mycorrhizal fungi in a mown grassland. J
Ecol 84: 71-82.
CHATURVEDI S, TEWARI V, SHARMA S, OEHL F, WIEMKEN A, PRAKASH A AND SHARMA AK. 2012. Diversity of arbuscular mycorrhizal fungi in oak-pine forests and agricultural land prevalent in the Kumaon Himalayan Hills, Uttarakhand, India. Brit Microbiol Res
J 2: 82-96.
CLARKE KR, SOMERFIELD PJ AND CHAPMAN MG.
2006. On resemblance measures for ecological studies, including taxonomic dissimilarities and a zero-adjusted
Bray–Curtis coefficient for denuded assemblages. J Exp
Mar Biol Ecol 330: 55-80.
CORNELL H. 1993. Unsaturated patterns in species assemblages: the role of regional processes in setting local species richness. In: Ricklefs RE and Schluter D (Eds), Species Diversity in Ecological Communities. The University of Chicago Press, Chicago, p. 243-252.
COUSINS JR, HOPE D, GRIES C AND STUTZ JC. 2003.
Preliminary assessment of arbuscular mycorrhizal fungal diversity and community structure in an urban ecosystem. Mycorhiza 13: 319-326.
CUENCA G AND LOVERA M. 2010. Seasonal variation and distribution at different soil depths of arbuscular mycorrhizal fungi spores in a tropical sclerophyllous shrubland. Botany 88: 54-64.
DUFRÊNE M AND LEGENDRE P. 1997. Species
assemblages and indicator species: the need for a flexible
asymmetrical approach. Ecol Monogr 67: 345-366. EOM AH, HARTNETT DC AND WILSON GWT. 2000. Host
plant species effects on arbuscular mycorrhizal fungal communities in tallgrass prairie. Oecologia 122: 435-444.
FERROL N, CALVENTE R, CANO C, BAREA JM AND AZCÓN-AGUILAR C. 2004. Analyzing arbuscular
mycorrhizal fungal diversity in shrub-associated resource islands from a desertification-threatened semi-arid Mediterranean ecosystem. Appl Soil Ecol 25: 123-133. GAZEY C, ABBOTT LK AND ROBSON AD. 1992. The
rate of development of mycorrhizas affects the onset of sporulation and production of external hyphae by two species of Acaulospora. Mycol Res 96: 643-650.
HART MM, READER RJ AND KLIRONOMOS JN. 2001.
Life-history strategies of arbuscular mycorrhizal fungi in relation to their successional dynamics. Mycologia 6: 1186-1194.
HELGASON T, DANIELL TJ, HUSBAND R, FITTER AH AND YOUNG JPW. 1998. Ploughing up the wood-wide
web? Nature 394: 431.
JANSA J, MOZAFAR A, ANKEN T, RUH R, SANDERS IR
AND FROSSARD E. 2002. Diversity and structure of AMF communities as affected by tillage in a temperate soil. Mycorrhiza 12: 225-234.
KLAUBERG-FILHO O, SIQUEIRA JO AND MOREIRA
FMS. 2002. Fungos micorrízicos arbusculares em solos de área poluída com metais pesados. Rev Bras Ci Solo 26: 125-134.
KRUÜGER M, KRUÜGER C, WALKER C, STOCKINGER H AND SCHUÜßLER A. 2012. Phylogenetic reference data for systematics and phylotaxonomy of arbuscular mycorrhizal fungi from phylum to species level. New Phytol 193: 970-984.
An Acad Bras Cienc (2018) 90 (2 Suppl. 1)
2372 PATRÍCIA L. LEAL et al.
in trap cultures from soils under different land use systems
in the Amazon, Brazil. Braz J Microbiol 40: 111-121. LIANG Z, DRIJBER RA, LEE DJ, DWIEKAT IM, HARRIS
SD AND WEDIN DA. 2008. A DGGE-cloning method to characterize arbuscular mycorrhizal community structure in soil. Soil Biol Biochem 40: 956-966.
LIU R AND WANG F. 2003. Selection of appropriate host plants used in trap culture of arbuscular mycorrhizal fungi. Mycorrhiza 13: 123-127.
MATHIMARAN N, RUH R, JAMA B, VERCHOT L, FROSSARD E AND JANSA J. 2007. Impact of
agricultural management on arbuscular mycorrhizal fungal communities in Kenyan ferralsol. Ecosyst Environ 119: 22-32.
MATHIMARAN N, RUH R, VULLIOUD P, FROSSARD
E AND JANSA J. 2005. Glomus intraradices dominates arbuscular mycorrhizal communities in a heavy textured agricultural soil. Mycorrhiza 16: 61-66.
MELLONI R, SIQUEIRA JO AND MOREIRA FMS. 2003.
Fungos micorrízicos arbusculares em solos de área de mineração de bauxita em reabilitação. Pesq Agropecu Bras 38: 267-276.
MERGULHÃO ACES, FIGUEIREDO MVB, BURITY HA AND MAIA LC. 2009. Hospedeiros e ciclos sucessivos de multiplicação afetam a detecção de fungos micorrízicos arbusculares em áreas impactadas por mineração gesseira. Revista Árvore 33: 227-236.
MOREIRA FMS, NÓBREGA RSA, JESUS EC, FERREIRA
DF AND PÉREZ DV. 2009. Differentiation in the fertility of Inceptisols as related to land use in the upper Solimões river region, western Amazon. Sci Total Environ 408: 349-355.
MOREIRA M, NOGUEIRA MA, TSAI SM,
GOMES-DA-COSTA SM AND CARDOSO EJBN. 2007. Sporulation
and diversity of arbuscular mycorrhizal fungi in Brazil Pine in the field and in the greenhouse. Mycorrhiza 17: 519-526.
MORTON JB, BENTIVENGA SP AND BEVER JD. 1995.
Discovery, measurement, and interpretation of diversity in arbuscular endomycorrhizal fungi (Glomales,
Zygomycetes). Can J Bot 73: 25-32.
OEHL F, LACZKO E, BOGENRIEDER A, STAHR
K, BÖSCH R, VAN DER HEIJDENA M AND
SIEVERDING E. 2010. Soil type and land use intensity determine the composition of arbuscular mycorrhizal fungal communities. Soil Biol Biochem 42: 724-738. OEHL F, SCHNEIDER D, SIEVERDING E AND BURGA
CA. 2011. Succession of arbuscular mycorrhizal communities in the foreland of the retreating Morteratsch glacier in the Central Alps. Pedobiologia 54: 321- 331. OEHL F, SIEVERDING E, INEICHEN K, MADER P,
BOILER T AND WIEMKEN A. 2003. Impact of land use intensity on the species diversity of arbuscular mycorrhizal
fungi in agroecosystems of Central Europe. Appl Environ Microbiol 69: 2816-2824.
OEHL F, SIEVERDING E, MADER P, DUBOIS D, INEICHEN K, BOILER T AND WIEMKEN A. 2004. Impact of long-term conventional and organic farming on the diversity of arbuscular mycorrhizal fungi. Oecologia 138: 574-583.
OLIVEIRA RS, VOSÁTKA M, DODD JC AND
CASTRO PML. 2005. Studies on the diversity of arbuscular mycorrhizal fungi and the efficacy of two native isolates in a highly alkaline anthropogenic sediment. Mycorrhiza 16: 23-31.
ÖPIK M ET AL. 2013. Global sampling of plant roots
expands the described molecular diversity of arbuscular mycorrhizal fungi. Mycorrhiza 23: 411-430.
R DEVELOPMENT CORE TEAM. 2015. R: a language and environment for statistical computing. R Foundation for Statistical Computing, Vienna, Austria.
ROBINSON-BOYER L, GRZYB I AND JEFFRIES P.
2009. Shifting the balance from qualitative to quantitative analysis of arbuscular mycorrhizal communities in field soils. Fungal Ecol 2: 1-9.
SÄLE V, AGUILERA P, LACZKO E, MÄDER P, BERNER
A, ZIHLMANN U, VAN DER HEIJDEN MGA AND
OEHL F. 2014. Impact of conservation tillage and organic farming on the diversity of arbuscular mycorrhizal fungi. Soil Biol Biochem 84: 38-52.
SCHENCK NC AND PEREZ Y 1988. Manual for identification of vesicular-arbuscular mycorrhizal fungi. Gainesville, INVAM.
SILVA DKA, PEREIRA CMR, SOUZA RG, SILVA GA, OEHL F AND MAIA LC. 2012. Diversity of arbuscular mycorrhizal fungi in restinga and dunes areas in Brazilian Northeast. Biodivers Conserv 21: 2361-2373.
SONGACHAN LS AND KAYANG H. 2014. Diversity of arbuscular mycorrhizal fungi in field and trap cultures from rhizosphere soils of Flemingia vestita Benth. ex Baker., In: Kharwar RN, Upadhyay R, Dubey N and Raghuwanshi R (Eds), Microbial Diversity and Biotechnology in Food Security. Springer, India, p. 103-110.
STÜRMER SL. 1998. Characterization of diversity of fungi forming arbuscular endomycorrhizae in selected plant communities. Dissertation submitted to the College of Agriculture, Forestry and Consumer Sciences of West Virginia University in partial fulfillment of the requirements for the degree of Doctor in Philosophy. Morgantown, West Virginia, EUA.
STÜRMER SL AND BELLEI MM. 1994. Composition and seasonal variation of spore populations of arbuscular mycorrhical fungi in dune soils on the island of Santa
Catarina, Brazil. Can J Bot 72: 359-363.
STÜRMER SL AND SIQUEIRA JO. 2011. Species richness
An Acad Bras Cienc (2018) 90 (2 Suppl. 1)
ARBUSCULAR MYCORRHIZAL FUNGI DIVERSITY METHODS 2373
across distinct land uses in western Brazilian Amazon. Mycorrhiza 4: 255-267.
STUTZ JC AND MORTON JB. 1996. Sucessive pot cultures
reveal high species richness of arbuscular endomycorrhizal
fungi in arid ecosystems. Cann J Bot 74: 1883-1889. TCHABI A, COYNE D, HOUNTONDJI F, LAWOUIN
L, WIEMKEN A AND OEHL F. 2008. Arbuscular mycorrhizal fungal communities in sub-Saharan Savannas of Benin, West Africa, as affected by agricultural land use intensity and ecological zone. Mycorrhiza 18: 181-195.
TREJO-AGUILAR D, LARA-CAPISTRÁN L,
M A L D O N A D O M E N D O Z A I E , Z U L U E TA
-R O D -R Í G U E Z , -R , S A N G A B -R I E L - C O N D E W,
MANCERA-LÓPEZ ME, NEGRETE-YANKELEVICH
S AND BAROIS I. 2013. Loss of arbuscular mycorrhizal fungal diversity in trap cultures during long-term subculturing. IMA Fungus 14: 161-167.
YOUNG JPW. 2012. A molecular guide to the taxonomy of
arbuscular mycorrhizal fungi. New Phytol 193: 823-826. WANG YY, VESTBERG M, WALKER C, HURME T,
ZHANG X AND LINDSTRÖM K. 2008. Diversity and