www.ccarevista.ufc.br ISSN 1806-6690
Predicting body and carcase composition in Nellore heifers and their
cross-breeds
1Predição da composição corporal e da carcaça de novilhas Nelore e suas cruzas
Evaristo Jorge Oliveira de Souza2*, Sebastião Campos Valadares Filho3, Thaysa Rodrigues Torres2, Daniel Cézar da Silva4 and José Ricardo Coelho da Silva5
ABSTRACT -The aim of this study was to predict the body and carcase composition of Nellore heifers and their crosses with Angus and Simmental bulls. Sixty heifers from three genetic groups were used, 20 Nellore, 20 Nellore x Angus and 20 Nellore x Simmental; of these, 12 (four from each genetic group) were slaughtered at the beginning of the experiment (reference group). The heifers were randomly divided into nine treatments (completely randomised design), in a 3 x 3 factorial scheme of three genetic groups and three diets (30 and 50% of the dry matter of the concentrate feed, in addition to the maintenance group) in feedlot. Twelve heifers (four from each genetic group) were fed at maintenance level (1.1% of body weight in dry matter) with a diet containing 30% concentrate, and 36 heifers (12 animals from each genetic group) were fedad libitum, with 30% (six from each group) or 50% (six from each group) of the dry matter (DM) from the concentrate feed. After slaughtering, the right-side half-carcase was completely dissected, and the 9 th, 10 th and 11 th ribs removed, from the left-side half-carcase, were cut. The 9 th, 10 th and 11 th rib cut satisfactorily estimated the fat and bone content; however, the muscle content was underestimated by 5.32%. The 9 th, 10 th and 11 th rib cut also satisfactorily estimated the chemical composition of the body and carcase, but not the physical composition of the carcase of Nellore heifers or their crosses with Angus and Simmental. The chemical constituents of the empty body and carcase are adequately estimated from the 9 th, 10 th and 11 th rib cut when the equations proposed by Valadares Filho, Paulino and Magalhães (2006) are used. The percentage of macrominerals can be estimated from the rib cut, however, the levels of calcium, phosphorus and magnesium are the most accurate.
Key words: Physical constitution. Chemical constitution. Fat. Muscle.
RESUMO -O objetivo do presente estudo foi predizer a composição corporal e da carcaça de novilhas Nelore e suas cruzas com Angus e Simental. Foram utilizadas 60 novilhas de três grupos genéticos, sendo 20 Nelore, 20 Nelore x Angus e 20 Nelore x Simental, destas 12 (quatro de cada grupo genético) foram abatidas no início do experimento (grupo referência). As novilhas foram aleatoriamente distribuídas em nove tratamentos (delineamento inteiramente casualizado), em esquema fatorial 3 x 3, sendo três grupos genéticos e três dietas (30 e 50% da matéria seca da ração em concentrado, além de grupo em mantença) sob confinamento. Doze novilhas (quatro de cada grupo genético) foram alimentadas ao nível de mantença (1,1% do peso corporal em matéria seca) com ração contendo 30% de concentrado e 36 novilhas (12 animais de cada grupo genético) foram mantidas em sistema de alimentação à vontade com 30 (seis de cada grupo) ou 50% (seis de cada grupo) da matéria seca (MS) da ração em concentrado. Após o abate, procedeu-se à dissecação completa da carcaça direita e do corte das 9ª; 10ª; 11ª costelas, retiradas da carcaça esquerda. O corte das 9ª; 10ª; 11ª costelas estimou satisfatoriamente os teores de gordura e osso, no entanto, o teor de músculo foi subestimado em 5,32%. O corte das 9ª; 10ª; 11ª costelas estimou de modo satisfatório a composição química corporal e da carcaça, mas não estima, de modo satisfatório, a composição física da carcaça de novilhas Nelore e suas cruzas com Angus e Simental. Os teores dos constituintes químicos no corpo vazio e na carcaça são estimados de forma adequada pelo corte das 9ª; 10ª; 11ª costelas, quando forem utilizadas as equações propostos por Valadares Filho, Paulino e Magalhães (2006). Os percentuais dos macrominerais podem ser estimados pelo corte das costelas, no entanto, os teores de cálcio, fósforo e magnésio apresentam melhor precisão.
Palavras-chave: Constituição física. Constituição química. Gordura. Músculo.
DOI: 10.5935/1806-6690.20190018 *Author for correspondence
Received for publication in 03/08/2016; approved in 13/03/2018
1Parte da Tese de Doutorado do primeiro autor, apresentada na UFRPE no Programa de Doutorado Integrado em Zootecnia com período sanduíche
na Universidade Federal de Viçosa; Pesquisa financiada pela Fundação de Amparo à Pesquisa de Minas Gerais-FAPEMIG/Conselho Nacional de Pesquisa-CNPq
2Unidade Acadêmica de Serra Talhada, Universidade Federal Rural de Pernambuco, Avenida Gregório Ferraz Nogueira, s/n, bairro José Tomé de Souza
Ramos, Caixa Postal: 063, Serra Talhada-PE, Brasil, 56.909-535, [email protected] (ORCID ID 0000-0002-2206-414X), [email protected]
3Departamento de Zootecnia, Universidade Federal de Viçosa, avenida Peter Henry Rolfs, s/n, bairro Campus Universitário, Viçosa-MG,
Brasil, 36.570-900, [email protected]
4Instituto Federal de Educação, Ciência e Tecnologia da Paraíba,Campus Sousa/Unidade São Gonçalo, Avenida presidente Tancredo Neves, s/n, bairro
Jardim Sorrilandia, Sousa-PB, Brasil, 58.800-970, [email protected]
5Unidade Acadêmica de Garanhuns, Universidade Federal Rural de Pernambuco, Avenida Bom Pastor, s/n, bairro Boa Vista, Garanhuns-PE,
INTRODUCTION
The main body components of cattle are the muscles, fats, bones, organs and viscera, and all of these are composed of varying amounts of proteins, lipids, water and minerals. Determining body composition is fundamental for identifying changes in growth composition, and this is influenced by various factors such as race, age, sex and diet composition. In addition to identifying changes during the growth of the animals, characterising body composition is the first step in determining the nutritional requirements of cattle.
Knowledge of tissue growth patterns and nutritional requirements makes it possible to balance feed and supplement for specific levels of performance, as well as to estimate performance from balanced diets based on requirements.
Obtaining the composition of carcase tissue results in high experimental costs (COSTA et al., 2014; CUNHAet al., 2008; FERNANDESet al., 2008; FERNANDESet al., 2010), besides being an extremely laborious process, as directly obtaining carcase and/ or empty body composition requires the complete dissection of at least half of the carcase (BONILHA et al., 2011; COSTA; SILVA et al., 2013; CUNHA et al., 2008; MAIAet al., 2014; MITCHELL, 2007). Consequently, the use of indirect methods that might predict body and carcase composition is extremely useful (MORAIS et al., 2016), making it possible to evaluate the effect of any type of treatment the animals may have undergone, and to verify the impact on the carcase and empty body.
Several techniques are used; however, due to the low cost and because it is easy to apply, the rib-cut method developed by Hankins and Howe (1946) is widespread throughout the country. This technique was developed with taurine cattle, which present a different deposition pattern of body constituents, mainly fat, to patterns seen in zebu cattle and their crosses, which suggests the need to adjust the technique to improve its application under the conditions found in Brazil.
With the aim of adapting the cutting technique to conditions in the tropics, Valadares Filho, Paulino
and Magalhães (2006) and Valadares Filho et al.
(2010), compiling domestic data on Nellore cattle and their crosses with taurine cattle, developed models to predict body and carcase composition under Brazilian conditions.
The present study was developed with the aim of predicting the body and carcase composition of Nellore heifers and their crosses with Angus and Simmental.
MATERIAL AND METHODS
The experiment was carried out in the experimental feedlot of the Department of Animal Science at the Federal University of Viçosa, in Viçosa, in the State of Minas Gerais, Brazil. Sixty heifers from three genetic groups, 18 months of age, were used: 20 Nellore (NE), with a mean weight of 247.80 ± 16.71 kg; 20 F1 Nelore x Angus (NA), with a mean weight of 292.94 ± 17.85 kg; and 20 F1 Nelore x Simmental (NS), with a mean weight of 258.64 ± 34.06 kg, of which 12, belonging to the reference group (four from each genetic group), were slaughtered at the beginning of the experiment to estimate the initial body composition and initial empty body weight (EBW) of the remaining animals. Another 12 heifers (four from each genetic group) were fed at maintenance level (1.1% of body weight in dry matter) with a diet containing 30% concentrate, and 36 heifers (12 animals from each genetic group) were fedad libitum with 30% (six from each group) or 50% (six from each group) of the dry matter (DM) from the concentrate feed.
The heifers were randomly divided into nine treatments (completely randomised design), in a 3 x 3 factorial scheme of three genetic groups and three diets (low and high proportions of concentrate ad libitum, in addition to the animals kept at maintenance level), with six replications per treatment for the animals keptad libitum and four for those kept at maintenance level.
The experimental diets were composed of corn silage, cornmeal, soybean meal, cattle urea, sodium bicarbonate, magnesium oxide, mineral mix and sodium chloride; the chemical composition of the ingredients is shown in Table 1, and the proportion of ingredients and nutritional composition of the experimental diets are shown in Table 2.
The diets were offered twice a day (08:00 and 16:00) and adjusted daily to allow leftovers of around 5% of the amount supplied, with water permanently available to the animals. The experiment lasted 142 days, with 30 days for animal adaptation to the experimental conditions, and 112 days (four periods of 28 days) for data collection. Samples of the concentrates, corn silage and leftovers were proportionally grouped in each 28-day period, to make up composite samples, which were pre-dried in a forced-air oven at 65oC and ground in mill with
a 1 mm mesh sieve for later laboratory analysis (SILVA; QUEIROZ, 2002).
Table 1 - Chemical composition of the feed ingredients
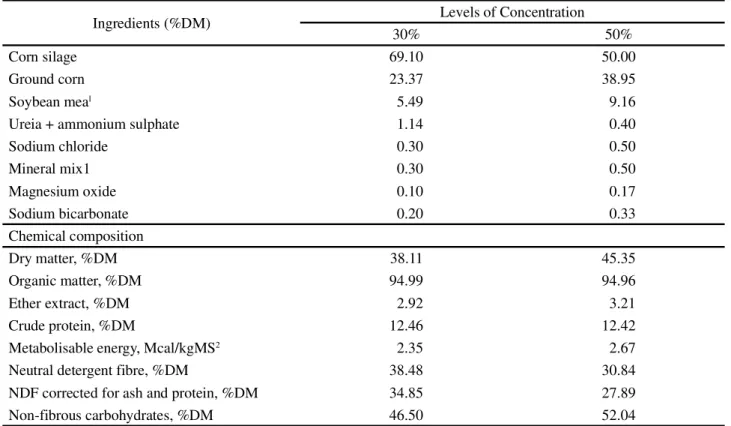
Table 2 - Percentage composition and chemical-bromatological composition of the experimental feeds
1Mineral mix: Ca - 24.0%; P - 17.4%; Co - 100.0 ppm; Cu - 1,250.0 ppm; Fe - 1,795.0 ppm; Mn - 2,000.0 ppm; Se - 15.0 ppm; Zn - 5,270.0 ppm; I
- 90.0 ppm. 2Estimated from the total digestible nutrient intake
The animals were not given solids for 16 hours prior to slaughter. Slaughter was carried out by desensitisation and jugular section to ensure total blood loss, followed by cleaning of the gastrointestinal tract (rumen, reticulum, omasum, abomasum and small and large intestines).
After slaughter, the gastrointestinal tract (rumen, reticulum, omasum, abomasum and small and large intestines) of each animal was emptied, washed and
weighed. The weights of the heart, lungs, liver, spleen, kidneys, internal fat, industrial meat (diaphragm), mesentery, tail and scraps (oesophagus, trachea and reproductive system), together with those of the washed gastrointestinal tract, were added to those of the other parts of the body (carcase, head, hide, feet and blood) to determine the empty body weight (EBW), calculated by subtracting the contents of the gastrointestinal tract from the body weight at slaughter (BWS-CGIT).
Nutrients (%DM) Feed
Corn Silage Ground Corn Soybean Meal
Dry matter 28.27 87.93 87.36
Organic matter 94.93 98.84 93.93
Crude protein 6.96 8.27 51.95
Ether extract 2.52 4.15 3.71
Neutral detergent fibre 50.82 10.83 15.18
NDF corrected for ash and protein 46.08 10.06 9.47
Non-fibrous carbohydrates 34.63 75.59 23.08
Ingredients (%DM) Levels of Concentration
30% 50%
Corn silage 69.10 50.00
Ground corn 23.37 38.95
Soybean meal 5.49 9.16
Ureia + ammonium sulphate 1.14 0.40
Sodium chloride 0.30 0.50
Mineral mix1 0.30 0.50
Magnesium oxide 0.10 0.17
Sodium bicarbonate 0.20 0.33
Chemical composition
Dry matter, %DM 38.11 45.35
Organic matter, %DM 94.99 94.96
Ether extract, %DM 2.92 3.21
Crude protein, %DM 12.46 12.42
Metabolisable energy, Mcal/kgMS2 2.35 2.67
Neutral detergent fibre, %DM 38.48 30.84
NDF corrected for ash and protein, %DM 34.85 27.89
The ratio between EBW and body weight (BW) in the reference animals was used to estimate the initial EBW of the animals that were still feeding. Within each treatment (genetic group and diet), two animals were randomly selected, and samples removed from the head and from one front and rear limb for later physical separation of the muscles, fat, bones and hide. The mean composition of the head and limbs of these animals was used to estimate the composition of the animals whose head and limbs were not sampled.
After slaughter, the carcase of each animal was divided into two half-carcases, which were weighed and then cooled in a cold room at 4 oC for 18 hours. After
this period, all the right-side half-carcases were initially separated into muscle, fat and bone, which were ground, and a sample taken for direct determination of the protein and fat content.
The rumen, reticulum, omasum, abomasum, small intestine, large intestine, internal fat, mesentery, liver, heart, kidneys, lungs, tongue, spleen, industrial meat and scraps were ground in an industrial cutter for 20 minutes so that a homogeneous sample of organs and viscera could be removed.
Blood samples were collected immediately after slaughter, packed in a glass container and placed in a forced-air oven at 65oC for 72 hours to determine the DM content,
and then ground in a ball mill and packed in containers for further analysis of the DM, ash (ASH), total nitrogen and ether extract (EE), as per a methodology described by Silva and Queiroz (2002); the crude protein content (CP) was obtained from the total nitrogen multiplied by a factor of 5.88, as suggested by Baldwin (1995).
With the exception of the blood, the samples of organs plus viscera, of muscles plus fat from the right-side half-carcase, of the hide and of the bones were lyophilised. The samples were later subjected to successive washes with petroleum ether, to obtain the pre-degreased dry matter (PDDM). The samples were then ground in a ball mill and the DM, ASH, total nitrogen and EE were determined as per a methodology described by Silva and Queiroz (2002); the CP content was obtained from the total nitrogen multiplied by a factor of 5.88, as suggested by Baldwin (1995).
From the left-side half-carcase, a sample corresponding to the 9 th, 10 th and 11 th rib cut was taken to predict the proportions of muscle, adipose and bony tissue in the carcase, according to the equations for females recommended by Hankins and Howe (1946): proportion of muscle tissue Y = 16.09 + 0.79X [1]; proportion of adipose tissue Y = 3.14 + 0.83X [2] and proportion of bone tissue Y = 6.88 + 0.44X [3], where X is the percentage of tissue in the cut.
The equations generated in Brazil and proposed by Valadares Filho, Paulino and Magalhães (2006) were tested for prediction of the chemical composition of the empty body: crude protein Y = 4.96 + 0.76X [4]; ether extract Y = 4.56 + 0.60X [5]; water Y = 31.42 + 0.51X [6]; ash Y = 2.54 + 0.39X [7] and the chemical composition of the carcase: crude protein Y = 4,05 + 0,78X [8]; ether extract Y = 4.96 + 0.54X [9]; water Y = 34.97 + 0.45X [10]; ash Y = 2.88 + 0.50X [11], where X equals the percentage of chemical constituents in the cut. The equations proposed by Hankins and Howe (1946) were also evaluated for prediction of the chemical composition of the carcase: crude protein Y = 5.64 + 0.69X [12]; ether extract Y = 2.73 + 0.78X [13]; water Y = 14.28 + 0.78X [14], where X equals the percentage of chemical constituents in the cut.
The equations proposed by Valadares Filho et al. (2010) were tested for estimation of the mineral composition of the empty body: calcium Y = 0.7334 + 0.5029X [15]; phosphorus Y = 0.3822 + 0.4241X [16]; sodium Y = 0.1111 + 0.2888X [17]; magnesium Y = 0.0096 + 0.626X [18]; potassium Y = 0.0357 + 0.6732X [19], where X is the percentage of macrominerals in the cut.
The percentage of tissue, chemical components and macrominerals seen in the empty body and in the carcase, and those estimated from the 9 th, 10 th and 11 th rib cut were compared by simple linear regression analysis using the SAS v 9.1 statistical analysis system, in such a way that the regression parameters were tested for the hypotheses: H0:b0=0; Ha:b0≠0; H0:b1=1 and Ha:b1≠1, considering a significance of 5%. When the intercept did not differ statistically, regression analysis was carried out passing through the origin, in which the intercept is adjusted to be equal to zero, estimating only the angular coefficient, where minus one is the tendency of the model to under- or overestimate the tissue and components seen in the carcase and the empty body.
To better verify the accuracy of the models in predicting the observed parameters, the concordance correlation coefficient (CCC) was evaluated as per Lawrence and Lin (1989), as well as the root mean square error (RMSE), calculated as follows: RMSE = 1/n ∑
(Predictedi - Observedi)2, as reported by Tedeschi (2006).
RESULTS AND DISCUSSION
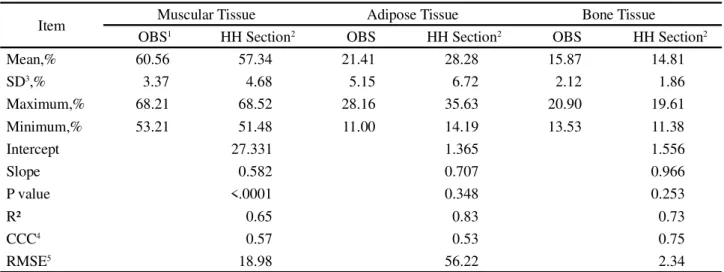
Table 3 - Observed and estimated values, and estimated regression parameters of the predicted and observed values for the muscle, adipose and bony tissue in the carcase
1Observed values. 2Estimated with the equations generated by Hankins e Howe (1946).3Standard deviation.4Concordance correlation coefficient.5Root
mean square error
Item Muscular Tissue Adipose Tissue Bone Tissue
OBS1 HH Section2 OBS HH Section2 OBS HH Section2
Mean,% 60.56 57.34 21.41 28.28 15.87 14.81
SD3,% 3.37 4.68 5.15 6.72 2.12 1.86
Maximum,% 68.21 68.52 28.16 35.63 20.90 19.61
Minimum,% 53.21 51.48 11.00 14.19 13.53 11.38
Intercept 27.331 1.365 1.556
Slope 0.582 0.707 0.966
P value <.0001 0.348 0.253
R² 0.65 0.83 0.73
CCC4 0.57 0.53 0.75
RMSE5 18.98 56.22 2.34
Table 4 - Observed and estimated values, and estimation of the regression parameters of the predicted and observed values for the different chemical constituents of the carcase
1Observed values.2Estimated with the equations generated by Valadares Filho, Paulino e Magalhães (2006).3Estimated by the equations generated by
Hankins e Howe (1946).4Standard deviation.5Concordance correlation coefficient.6Root mean square error
Item Crude protein Ether extract Water Ash
OBS1 BR-Corte2 HH Sectn3 OBS1 BR-Corte2 HH Sectn3 OBS1 BR-Corte2 HH Sectn3 OBS1 BR-Corte2
Mean,% 16.29 16.01 16.22 20.84 19.97 24.41 57.85 57.97 54.15 5.01 5.75
SD4,% 1.54 1.31 1.16 4.66 3.94 5.69 3.79 2.60 4.50 1.01 0.78
Mxximum,% 22.28 20.67 20.34 29.84 29.71 38.48 64.07 62.74 62.42 7.55 7.72 Minimum,% 12.35 13.43 13.94 12.05 11.57 12.28 43.91 48.15 37.13 2.00 3.77
Intercept 1.79 -0.30 -0.62 2.67 -12.0 20.19 -1.00
Slope 0.91 1.02 1.08 0.74 1.21 0.69 1.04
P value 0.33 0.89 0.68 0.05 0.12 <.0001 0.19
R² 0.60 0.60 0.83 0.83 0.67 0.67 0.63
CCC5 0.75 0.74 0.88 0.72 0.82 0.61 0.44
RMSE6 1.03 0.95 4.53 18.46 3.80 18.33 1.20
and bone) and nutrients (crude protein, ether extract, water and ash) in the empty body were not affected by the genetic groups (PEROTTO; ABRAHÃO; KROETZ, 2001; SOUZAet al., 2012).
As to the ability of the equations to predict the physical composition of the carcase from the rib cut, the result for bone tissue was the most accurate and precise, as can be seen by the high CCC and the low value for the RMSE, as shown in Table 3 and Figure 1.
Muscle tissue was the only tissue for which the null hypothesis for the physical characteristics of the carcase was
According to Valadares Filho, Paulino and Magalhães (2006), most of the work done in Brazil with the aim of validating the equations generated by Hankins and Howe (1946), overestimate the fat content. This is because the equations were generated from taurine cattle (Aberdeen Angus, Hereford, Shorthorn and their crosses). For Valadares Filho, Paulino and Magalhães (2006), due to variations in the composition of the EBW the empirical equations are more accurate than are those generated to predict body composition. Taurino cattle display different deposition patterns for chemical constituents than do zebu cattle, since British breeds, when compared to zebu cattle, mature earlier, which reflects in a greater accumulation of fat in the carcase and in the empty body.
Paulinoet al. (2005), working with Nellore cattle, found that the muscle, adipose and bone tissue content of the carcase was satisfactorily estimated by the equations generated by Hankins and Howe (1946). However, Marcondes et al. (2009) reported that under different
sexual conditions (entire males, castrated males and females) the rib cut did not give a good estimate for the tissue in the Nellore carcase.
The carcase is basically composed of bone, muscle and adipose tissue. The latter are strongly influenced by such factors as race and sexual condition, i.e. British breeds and their crosses compared to those of zebu breeds have a greater proportion of fat in the carcase, as do females in relation to males (GOULART et al., 2008). There is therefore an obvious need to provide equations for predicting the physical composition of bovine carcases under domestic conditions, since despite the equations used to predict the muscle and fat content of the carcase not being accurate (CCC and RMSE), the 9 th, 10 th and 11 th rib cut proved to be efficient in predicting the physical composition of the carcase in zebu cattle.
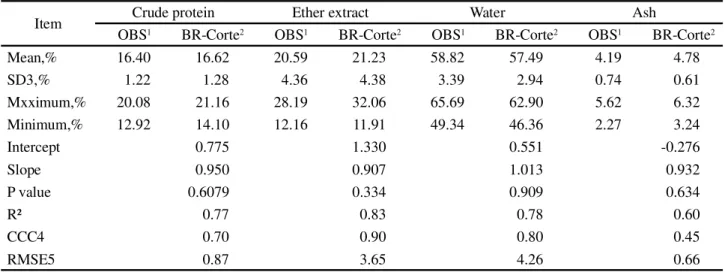
Table 5 - Observed and estimated values, and estimation of the regression parameters of the predicted and observed values for the different chemical constituents of the empty body
1Observed values.2Estimated with the equations generated by Valadares Filho, Paulino e Magalhães (2006).3Standard deviation.4Concordance correlation
coefficient.5Root mean square error
Item Crude protein Ether extract Water Ash
OBS1 BR-Corte2 OBS1 BR-Corte2 OBS1 BR-Corte2 OBS1 BR-Corte2
Mean,% 16.40 16.62 20.59 21.23 58.82 57.49 4.19 4.78
SD3,% 1.22 1.28 4.36 4.38 3.39 2.94 0.74 0.61
Mxximum,% 20.08 21.16 28.19 32.06 65.69 62.90 5.62 6.32
Minimum,% 12.92 14.10 12.16 11.91 49.34 46.36 2.27 3.24
Intercept 0.775 1.330 0.551 -0.276
Slope 0.950 0.907 1.013 0.932
P value 0.6079 0.334 0.909 0.634
R² 0.77 0.83 0.78 0.60
CCC4 0.70 0.90 0.80 0.45
RMSE5 0.87 3.65 4.26 0.66
resources. Although the equations suggested by Hankins and Howe (1946) were not generated in order to estimate the chemical composition of the carcase and the empty body, a high number of experiments on the nutritional requirements of cattle have been carried out in Brazil, where body composition was estimated through the use of these equations (ANDRADEet al., 2008; BONILHA et al., 2008; GALATIet al., 2007; MARCONDESet al., 2009; MARCONDESet al., 2012; PAULINOet al., 2005; VALADARES FILHOet al., 2010).
The closeness of the observed and estimated mean values, the statistical analysis of the regression equations, and the high values for CCC and low values for RMSE of the levels of crude protein, ether extract, water and mineral matter of the body and carcase predicted by the models developed under domestic conditions, demonstrate the accuracy of these models (Tables 4 and 5).
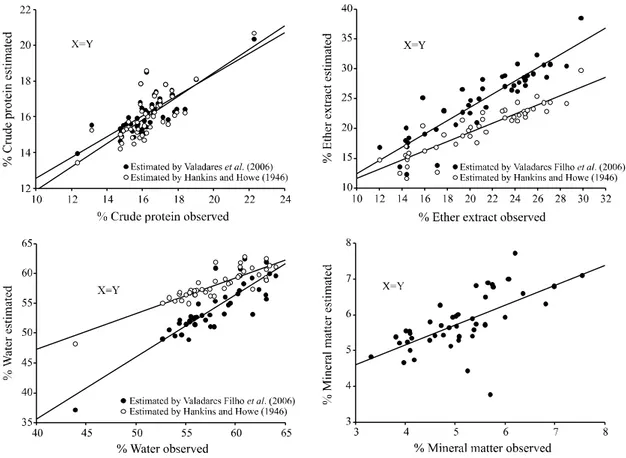
The accuracy of the model measures the ability of the model to predict actual values, and this can be measured by the CCC and RMSE, i.e. the smaller the RMSE and the closer to one the CCC, the more precise and accurate the model (LAWRENCE; LIN, 1989; TEDESCHI, 2006). The ratio of the chemical constituents seen in the carcase and in the empty body, and those estimated by the rib cut, can be better visualised along the equivalence line (Figures 2, 3).
The models developed by Hankins and Howe (1946) showed good precision in predicting the crude protein content of the carcase (CCC = 0.74; RMSE = 0.95). The models were less precise and accurate (CCC and
RMSE) for the percentage of ether extract and water in the carcase, in addition to generating predictions that cannot be accepted as true (Pvalue). The equations generated from the HH section do not include the EE or the water content of the bones; the prediction may therefore incur an error, which in some way affects the prediction of the energy requirement of the animal, depending on growth stage and bone development (MARCONDESet al., 2012). The rib cut overestimated the ether extract content by 15.2%, and underestimated the water content of the carcase by 6.6%.
According to the literature, using the equations proposed by Hankins and Howe (1946), the HH section (9 th, 10 th and 11 th rib cut), as estimator of the chemical composition of the body and carcase, overestimated the lipid content of the carcase and empty body in zebu cattle (MARCONDES et al., 2009; PAULINO et al., 2005). This behaviour is consistent, since the equations proposed by the above authors were developed for taurine cattle, which present greater fat accumulation in the carcase and empty body, and consequently greater levels of ether extract when compared to zebu cattle.
Figure 2 - Ratio between the percentage of chemical constituents seen in the carcase and estimated by the 9th, 10th and 11th rib cut
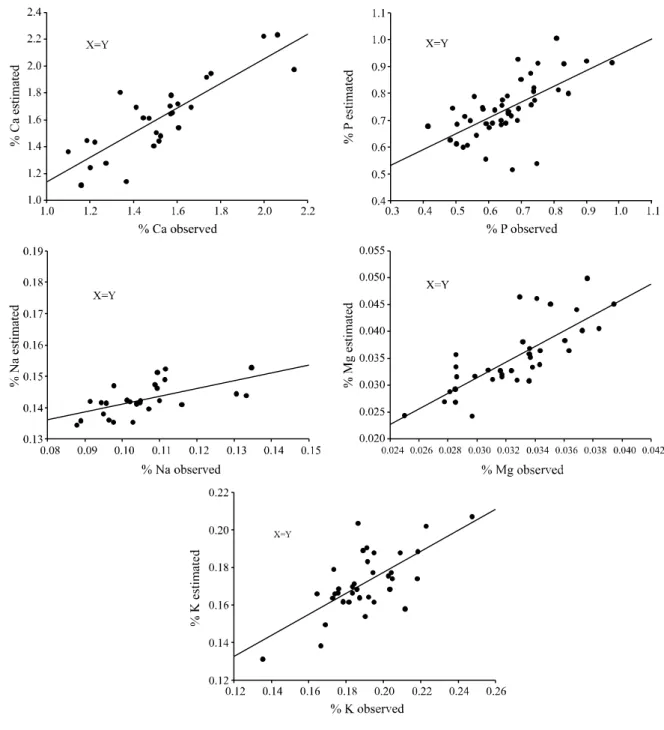
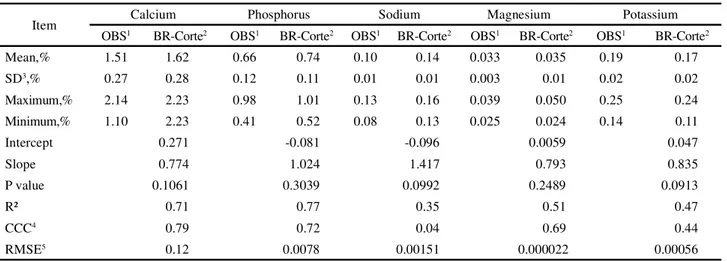
Figure 4 - Ratio between the percentage of macrominerals observed in the empty body and estimated by the 9th, 10th and 11th rib cut
The equations for predicting the percentage of macrominerals (calcium, phosphorus, sodium, magnesium and potassium) in the body of the animals can be accepted as true (P value); however, only those estimating the levels of calcium, phosphorus and magnesium displayed good accuracy and precision (CCC and RMSE) (Table 6 and Figure 4).
Paulino (2002), working with Nellore cattle under different sexual conditions (entire males, castrated males and females), reported that, except for calcium, the rib cut
1Observed values.2Estimated with the equations generated by Valadares Filho, Paulino e Magalhães (2006).3Standard deviation.4Concordance correlation
coefficient.5Root mean square error
Table 6 - Observed and estimated values, and estimation of the regression parameters of the predicted and observed values for macrominerals in the empty body
Item Calcium Phosphorus Sodium Magnesium Potassium
OBS1 BR-Corte2 OBS1 BR-Corte2 OBS1 BR-Corte2 OBS1 BR-Corte2 OBS1 BR-Corte2
Mean,% 1.51 1.62 0.66 0.74 0.10 0.14 0.033 0.035 0.19 0.17
SD3,% 0.27 0.28 0.12 0.11 0.01 0.01 0.003 0.01 0.02 0.02
Maximum,% 2.14 2.23 0.98 1.01 0.13 0.16 0.039 0.050 0.25 0.24
Minimum,% 1.10 2.23 0.41 0.52 0.08 0.13 0.025 0.024 0.14 0.11
Intercept 0.271 -0.081 -0.096 0.0059 0.047
Slope 0.774 1.024 1.417 0.793 0.835
P value 0.1061 0.3039 0.0992 0.2489 0.0913
R² 0.71 0.77 0.35 0.51 0.47
CCC4 0.79 0.72 0.04 0.69 0.44
RMSE5 0.12 0.0078 0.00151 0.000022 0.00056
CONCLUSION
Using the equations of Hankins and Howe, the 9 th, 10 th and 11 th rib cut did not satisfactorily estimate the physical composition of the carcase in Nellore heifers or their crosses with Angus and Simmental. When the models proposed by Valadares Filho are used, the levels of the chemical constituents of the empty body and the carcase are adequately estimated by the 9 th, 10 th and 11 th rib cut. The percentage of macrominerals can be estimated by the rib cut; however, the levels of calcium, phosphorus and magnesium display better precision.
REFERENCES
ANDRADE, D. K. B. deet al. Composição corporal e exigências líquidas de macrominerais para ganho de peso em bovinos 5/8 Holandês-Zebu em pastejo na Zona da Mata de Pernambuco. Revista Brasileira de Zootecnia, v. 37, n. 5, p. 913-918, 2008. BALDWIN, R. L. Modeling ruminant digestion and metabolism. London: Chapman and Hall, 1995. 592 p. BONILHA, S. F. M.et al. Chemical composition of whole body and carcase of Bos indicus and tropically adapted Bos taurus breeds.Journal of Animal Science, v. 89, n. 9, p. 2859-2866, 2011.
BONILHA, S. F. M.et al.Estimação da composição química do corpo vazio de animais Nelore e Caracu a partir das composições química e física do corte da 9ª; 10ª; 11ª costelas. Revista Brasileira de Zootecnia, v. 37, n. 12, p. 2206-2214, 2008. COSTA E SILVA, L. F.et al. Evaluation of equations to predict body composition in Nellore bulls.Livestock Science, v. 151, n. 1, p. 46-57, 2013.
COSTA, M. R. G. F. et al. Prediction of body chemical composition of Morada Nova ram lambs using the composition of ribs section between 9th; 11th.Semina: Ciências Agrárias, v. 35, n. 4, p. 2019-2032, 2014.
CUNHA, M. G. G.et al.Características quantitativas de carcaça de ovinos Santa Inês confinados alimentados com rações contendo diferentes níveis de caroço de algodão integral.Revista Brasileira de Zootecnia, v. 37, n. 6, p. 1112-1120, 2008. FERNANDES, H. J. et al. Determination of carcase and body fat compositions of grazing crossbred bulls using body measurements.Journal of Animal Science, v. 88, n. 4, p. 1442-1453, 2010.
FERNANDES, M. H. M. R. et al. Predicting the chemical composition of the body and the carcase of ¾ Boer × ¼ Saanen kids using body components.Small Ruminant Research, v. 75, n. 1, p. 90-98, 2008.
GALATI, R. L. et al. Equações de predição da composição química corporal a partir do corte. da 9ª; 10ª; 11ª costelas de bovinos castrados Nelore. Revista Brasileira de Zootecnia, v. 36, n. 2, p. 480-488, 2007.
GOULART, R. S. et al. Composição corporal e exigências líquidas de proteína e energia de bovinos de quatro grupos genéticos terminados em confinamento.Revista Brasileira de Zootecnia, v. 37, n. 5, p. 926-935, 2008.
HANKINS, O. G.; HOWE, P. E.Estimation of the composition of beef carcasees and cuts. Washington: United States Department of Agriculture, 1946. 19 p. (Technical Bulletin, 926).
de cordeiros Santa Inês alimentados com rações contendo diferentes níveis de energia.Semina: Ciências Agrárias, v. 35, n. 4, p. 2579-2596, 2014. Suplemento.
MARCONDES, M. I.et al. Predição da composição corporal e da carcaça a partir da seção entre a 9ª; 11ª costelas em bovinos Nelore.Revista Brasileira de Zootecnia, v. 38, n. 8, p. 1597-1604, 2009.
MARCONDES, M. I.et al. Prediction of physical and chemical body composition of purebred and crossbred Nellore cattle using the composition of a rib section.Journal of Animal Science, v. 90, n. 4, p. 1280-1290, 2012.
MITCHELL, A. D. Impact of research with cattle, pigs, and sheep on nutritional concepts: body composition and growth. The Journal of Nutrition, v. 137, n. 3, p. 711-7114, 2007. MORAIS, M. G.et al. Models predict the proportion of bone, muscle, and fat in ewe lamb carcasees from in vivo measurements of the 9th; 11th rib section and of the 12th rib.Semina: Ciências
Agrárias, v. 37, n. 2, p. 1081-1090, 2016.
PAULINO, P. V. R.et al. Validação das equações desenvolvidas por Hankins e Howe para predição da composição da carcaça de zebuínos e desenvolvimento de equações para estimativa da composição corporal.Revista Brasileira de Zootecnia, v. 34, n. 1, p. 327-339, 2005.
PAULINO, P. V. R. Exigências nutricionais e validação da seção HH para predição da composição corporal de zebuínos. 2002. 158 f. Dissertação (Mestrado em Zootecnia) - Universidade Federal de Viçosa, Viçosa, MG, 2002.
PEROTTO, D.; ABRAHÃO, J. J. S.; KROETZ, I. A. Produtividade à desmama de novilhas Nelore e F1 Bos taurus x Nelore e Bos indicus x Nelore.Revista Brasileira de Zootecnia, v. 30, n. 6, p. 1712-1719, 2001.
SILVA, D. J.; QUEIROZ, A. C.Análise de alimentos: métodos químicos e biológicos. 3. ed. Viçosa, MG: UFV, 2002. 235 p. SOUZA, E. J. O. deet al. Taxa de deposição de tecidos corporais de novilhas Nelore e suas cruzas com Angus e Simental.Revista Brasileira de Saúde e Produção Animal, v. 13, n. 2, p. 344-359, 2012.
TEDESCHI, L. O. Assessment of the adequacy of mathematical models.Agricultural Systems, v. 89, n. 4, p. 225-247, 2006. VALADARES FILHO, S. C.et al.Exigências nutricionais de zebuínos puros e cruzados BR CORTE. 2. ed. Viçosa: Suprema Gráfica , 2010. 193 p.
VALADARES FILHO, S. C.; PAULINO, P. V. R.; MAGALHÃES, K. A.Exigências nutricionais de zebuínos e tabelas de composição de alimentos BR CORTE. 1. ed. Viçosa: Suprema Gráfica, 2006. 142 p.