http://dx.doi.org/10.1590/1806-9061-2017-0571
Author(s)
Akoğlu ITI
Bıyıklı MI
Akoğlu AII
Kurhan ŞIII
I Abant İzzet Baysal University, Faculty of
Engineering and Architecture, Department of Food Engineering, Bolu, Turkey
II Abant İzzet Baysal University, School
of Tourism and Hotel Management, Department of Gastronomy and Culinary Arts, Bolu, Turkey
III Abant İzzet Baysal University, Innovative
Food Technologies Development Applica-tion and Research Center, Bolu, Turkey
Mail Address
Corresponding author e-mail address Aylin Akoğlu
Kıbrıs Sk., Merkez, Bolu - 14100 - Turkey Tel: (+90) 505 2205919
Email: [email protected]
Keywords
Sous vide (SV), Storage, Turkey cutlet, Cooking, Food preservation.
Submitted: 20/June/2017 Approved: 12/September/2017
ABSTRACT
The aim of this study was to determine the quality and shelf life of sous vide turkey cutlet stored at 4 and 12ºC. Samples were packaged under vacuum into polyamide-polypropylene pouches, cooked using sous vide technology (65ºC/40 min), chilled at 3ºC and stored at 4 and 12ºC for 5 weeks. Microbial (TMAB, lactic acid bacteria, Enterobacteriaceae, moulds and yeasts, Salmonella spp., L. monocytogenes, Cl. perfringens), physical–chemical (pH, water activity, TBARS, L*a*b* colour, texture profile analysis and shear force) and sensory (appearance, colour, odour, flavour, juiciness, chewiness and acceptance) parameters were determined. According to the results of mesophilic bacterial counts and sensory analysis, the shelf life of the sous vide turkey cutlet, cooked at 65ºC for 40 min, was determined as 28 days at 4ºC while 15 days at 12ºC. Salmonella spp., L. monocytogenes, Cl. perfringens were not detected in turkey cutlet samples during the storage period. It was detected that sous vide cooked provided convenient ready-to-eat foods and a long shelf life for turkey cutlet.
INTRODUCTION
Owing to the development of the technology, people’s changing lifestyles and the customers’ increase of expectation for food that is easy to prepare, high quality, maintains its fresh taste, the demand for food which is partially processed, contains low amount of additives, is unsterilized but has extended shelf-life and has been increasing in the food industry. While people are spending less time cooking meals in the kitchen, they prefer to consume fast food. However, due to the fact that fast food causes unhealthy nutrition habits and thus obesity, consumers are in quest for alternatives for food. On account of these reasons people tend to consume convenience and packaged food which maintains its nutritional value, is easily consumed and which contains few additives as possible. This change in consumer trends has been taken into consideration in the industrial area, thus; manufacturers have focused on the research about methods of food preparation and presentation and increased the production of ready to eat food (Aucoin 1997; Ergezer & Gökçe 2003; Mol & Özturan 2009). In particular new technologies are being investigated and many studies are being carried out in order to increase the quality and shelf life of the poultry meat products that attract great attention in ready to eat food industry. Sous vide (SV) is an alternative method that is able to meet all of these needs.
chefs since 1970s, it became popular in the mid-2000; thanks to its easy application and suitability for many products, a rapid increase in its use in the catering sector, restaurants, homes and industrial processes has been observed (Baldwin 2011). Fast food industry gives importance to this technique and is constantly studying how to improve it on the ground that with SV method by only heating and without microbiological contamination, a pre-cooked meal is served to the consumer, thus; it has an increased product shelf life and short service time (Jang et al. 2006; Roldan et al. 2013).
For the human nutrition, the importance of animal food is vital. Poultry meat in which also turkey takes place is preferred instead of red meat due to its low levels of cholesterol, high protein/calorie ratio and low fat content. Furthermore, turkey is rich in B group vitamins as thiamin (B1), riboflavin (B2), niacin (B3) and pyridoxine (B6), and the minerals potassium, calcium and phosphorus. Because of these features, turkey is preferred by conscious consumers. On the other hand, its being able to be grown to high body weight, carcass yield, high rate of edible meat give privilege to convert it into mass food production and meat products (Sipahi 2006; Çolak et al. 2011).
The significant level of microorganism contamination of poultry meat products especially during cutting operations is an important issue. This situation often leads to rapid contamination of meat and threaten the health of the consumer. It is stated that it leads to some food borne illnesses caused by the consumption of poultry meat, particularly salmonellosis. Therefore, processing the food or packaging with different kinds of methods, increasing the shelf life of the product and preventing contamination that may occur during these processes is of prime importance (Atasever et al. 2000; Çolak et al. 2011). Additionally, the physiological satisfaction borders in humans against poultry are very low due to the sensory quality of these meats. In other words, continuous consumption of it is unlikely. Saturation limits of poultry meat products can be increased by transforming it into various products with adding some ingredients (salt, spices, mono sodium glutamate) and as a result, more poultry meat products consumption can be realized (Atasever et al. 2000).
The shelf life of poultry meat products is based on the bacterial load of the product, characteristic of the storage environment and the degree of lipid oxidation on the product. Various methods carried out under these conditions have importance in increasing product shelf life (Wang et al. 2004). Since oxidation
is prevented thanks to vacuum packing in SV product, oxidation-induced bad taste and odor formation decreases, contamination which may occur during storage is prevented and the growth of aerobic bacteria is inhibited. Therefore, the shelf life of the product is prolonged. During cooking, aroma components and moisture’s remaining substantially in food, efficient transformation of heat from water into food, with the exposure of the whole product to a uniform temperature same crispness of food from outmost to the center also provide improvement in sensory properties of the product. Thus, with SV cooking a product that is both savory, nutritious also has longer shelf life compared to standard products (Baldwin 2011). Many studies (Wang et al. 2004; Diaz et al. 2008; Mol et al. 2012; Singh et al. 2016; Hernández
et al. 2017) have been carried out to determine the
shelf life of SV cooked products and studies showed that the shelf life can vary according to the properties of the product. Mol et al. (2012) showed that the shelf life of the SV bonito, cooked at 70ºC for 10 min, was 28 days at 4ºC while 15 days at 12ºC. In another research Diaz et al. (2008) stated that SV cooked pork loin was unacceptable after 10 weeks. It was seen that SV cooked and packaging provided a long shelf life for meat products. This agrees with other studies on SV meat-based meals (Simpson et al., 1994; Hansen et al., 1995; Nyati, 2000; Vaudagna et al., 2002; Wang et al., 2004). Within this context, putting turkey cutlet, which is acquired with the addition of spices, on fast food product industry processed by SV method will meet the consumer needs and also provide microbial safety of the product. By foreseeing that the products that are SV cooked have longer shelf life than the raw products in the markets, instead of raw turkey cutlets that have 8-day shelf life in the refrigerator on the market, it is aimed at developing an alternative product which is cooked, ready for use and has longer shelf life, thus; meeting the needs of consumers.
MATERIAL AND METHODS
Preparation of SV productssamples were stored at 4 and 12ºC. Three different packaged Turkey cutlet portions were cooked and analyzed in each analyzing day. Analyses were made at 0, 7, 14, 21, 28, 35 storage days for the storage of 4ºC and 0, 3, 6, 9, 12, 15, 18, 21 days for the storage of 12ºC.
Microbiological analyses
In the process of microbiological analyses of turkey cutlet samples, a 10 g sample taken under aseptic conditions was homogenized using 90 mL of 0.1% peptone water (Merck, 1.02239.0500, Germany). Decimal serial dilutions were prepared in 0.1% peptone water and appropriate dilutions were surface plated, in duplicate, onto agar dishes. Selective agar medium and incubation conditions are shown in Table 1. In addition, the presence of Listeria
monocytogenes and Salmonella spp. were investigated
in the samples.
The presence of L. monocytogenes was analyzed according to ISO method (ISO 11290, 1996). 25 g sample was aseptically transferred in 225 mL Half Fraser Broth (Lab M, LAB164, UK) for pre-enrichment and incubated at 30ºC for 24 h. 0.1 mL inoculum was transferred into 10 mL Fraser Broth (Lab M, LAB211, UK) and incubated at 37ºC for 24-48 h. A loopful sample from cultured enrichment medium were streaked on a plate of both Oxford Agar (Merck, 1.07004.0500, Germany) and PALCAM Agar (Merck, 1.11755, Germany) and incubated at 37ºC for 24-48 h. Greenish-grey colonies were picked up and further identification tests (Gram staining, catalase activity, motility, hemolysis activity and carbohydrate fermentation) were conducted. For the purposes of
Salmonella spp. isolation, 25 g sample was incubated
for 16-20 h at 35-37ºC by adding buffered peptone water (Merck 1.07228 Merck, Darmstadt, Germany) for pre-enrichment. One milliliter of the mixture was transferred to 10 mL Rappaport & Vassiliadis Broth (Merck 1.07700, Germany) and incubated for 24 h at 41.5ºC. Another 1 mL of the mixture was transferred
into 10 mL Muller–Kauffmann Tetrathionate/Novobio-cin Broth (Oxoid, CM1048, UK) and incubated for 24 h at 37ºC for selective enrichment. A loopful inoculum from both broths were separately transferred to Brilliant green Agar (Lab M, LAB34, UK) and XLD Agar (Lab M, LAB032, UK) which are used as selective agar medium. After incubation for 24 h at 37ºC, biochemical tests were performed for typical colonies (ISO 6579, 2002).
Physical-Chemical Analyses
Physical and chemical quality parameters like pH, water activity, thiobarbituric acid value, peroxide value, CIE L*, a*, b* color and instrumental texture were determined to evaluate SV cooked turkey cutlet spoilage. The pH was measured with a pH meter (Thermoscientific-Orionstar-A211, UK) (TSE, 1990) and water activity (aw) was measured using a water activity meter (Novasina Labmaster, UK) (Ensoy 2004). Oxidation was expressed as thiobarbituric acid reactive substances (TBARS) (expressed as mg malonaldehyde/ kg sample) using a Spectrophotometer (Tarladgis et al. 1960). Peroxide value was measured by titrating with Na2S2O3.5H2O using starch as indicator. Total acidity was determined as mq O2/kg oil (AOAC 1990). Color was measured on turkey cutlets using a Chroma meter (Minolta CR-300, UK) and results were expressed as CIE L*, a*, b* (Hunt et al. 1991).
Texture profile analysis (TPA) and Warner Bratzler shear force were measured using a texture analyser (TA.XT Plus Stable Micro Systems, UK) equipped with a load cell of 30 kg. For TPA 1.5 x 0.8 x 1.5 cm uniform portioned meat samples were used. The samples were compressed perpendicular to the muscle fibers with a 100 mm diameter cylindrical probe with two consecutive cycles of 65% compression. For each sample, nine cubes were obtained and texture variables hardness, cohesiveness, springiness, gumminess and chewiness were calculated. Shear force was measured in 1.5 x 1.5 x 5 cm meat samples. Each sample was cut perpendicular to the muscle fibers with a Warner– Bratzler shear. The testing conditions were: 20°C room
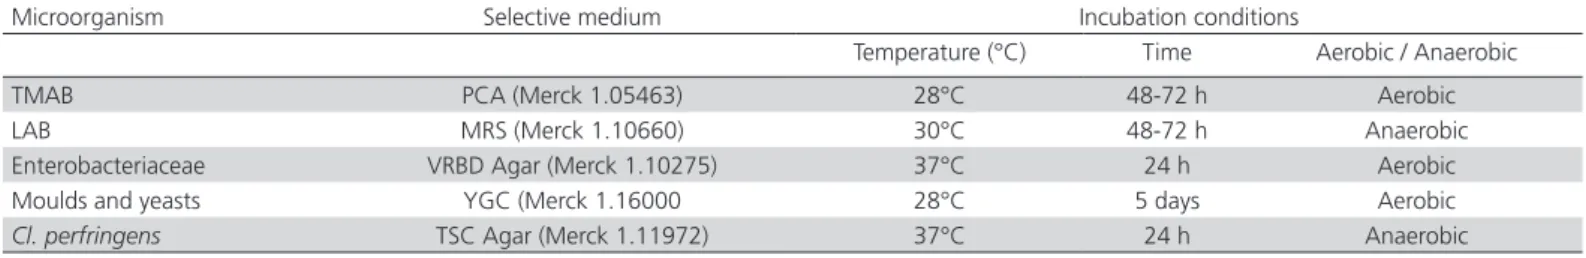
Table 1 – Selective media and incubation conditions in microbiological analyses of selected microorganism
Microorganism Selective medium Incubation conditions
Temperature (°C) Time Aerobic / Anaerobic
TMAB PCA (Merck 1.05463) 28°C 48-72 h Aerobic
LAB MRS (Merck 1.10660) 30°C 48-72 h Anaerobic
Enterobacteriaceae VRBD Agar (Merck 1.10275) 37°C 24 h Aerobic
Moulds and yeasts YGC (Merck 1.16000 28°C 5 days Aerobic
Cl. perfringens TSC Agar (Merck 1.11972) 37°C 24 h Anaerobic
temperature, pre-test speed of 2 mm/sec, test speed of 1 mm/sec and after-test speed of 10 mm/sec with 15 g trigger force. Six determinations were performed for each cooked sample. Texture profile calculations were done as described by Bourne (1978).
Sensory analyses
For the sensory analyses, samples were placed on glass plates labelled with random three digits and were heated 30 sec. with a microwave oven (Samsung M17-13, 600 W, 2450 MHz). The warmed samples were immediately presented to the 10 educated judges. Water was used between samples to cleanse the palate. SV cooked turkey cutlet was evaluated in terms of appearance, colour, juiciness, odor, chewiness, flavor and overall acceptance. Each sensory property was graded using a point scale ranging from 1 to 9. The scales used were: 1 (very dry appearance) to 9 (very juicy appearance) for appearance; 1 (very pale) to 9 (very bright) for color; 1 (very dry) to 9 (very juicy) for juiciness; (non-perceivable) to 9 (strong intensity) for odor, chewiness, flavor and overall acceptance (Kolsarıcı & Candoğan 1995). The mean score was calculated for each sample group and sample was accepted as “spoiled” or unacceptable if the score was determined as lower than four.
Statistical analyses
All parameters were analyzed by a one-way analysis of variance using the general linear models procedure of SPSS 16.0 (Analytical Software, New York, USA) and significant factors (p<0.05) between the groups were analyzed by using Duncan post hoc test.
RESULTS AND DISCUSSION
Microbiological AnalysesDuring the storage, the total mesophilic bacterial counts exceeded the permissible limit 5 log cfu/g, on the 35th and 21st days of storage at 4 and 12ºC,
respectively (Table 2). However, it was mentioned that the low temperature storage gave the SV processed product the enhanced storage stability but there may also be loss of sensory properties of the product during storage (Gonzalez-Fandos et al. 2005). For this reason, only the microbial limit prescribed for cooked foods cannot be an index for SV products. Some researchers showed that microbiological quality of cooked meat can be achieved with SV technology (Diaz et al. 2008). Similar to our results, Can & Harun (2015) reported that the TMAB count was below the limit of detection until day 42 in chicken meatballs samples were SV cooked at 90ºC for 20 min and stored at 2ºC. Nyati (2000) studied the microbiological quality of turkey breasts SV cooked at an internal temperature of 70ºC for 2 min and stored up to five weeks at 3ºC. Total plate counts of 3.31 logcfu/g were found after five weeks, showing similar counts to the raw material. On the other hand, no pathogens, such as L. monocytogenes, Salmonella
spp. and Cl. perfringens were found, and as well counts below 1 log cfu/g Enterobacteriaceae, lactic acid bacteria, mould and yeast were found during the storage. Shakila et al. (2009) informed that the absence of these microorganisms could be mainly because of the combination of vacuum packaging, cooking and low temperature storage and SV cooking has resulted in the destruction of these groups of bacteria. Our results are in agreement with those reported by Shakila et al. (2009), who did not detect viable lactic acid bacteria in SV fish-cakes samples during 16 weeks of storage and by Can & Harun (2015) who detected LAB number was below 1.0 logcfu/g in SV chicken meatballs samples during 10 weeks of storage.
Physical-Chemical Analyses
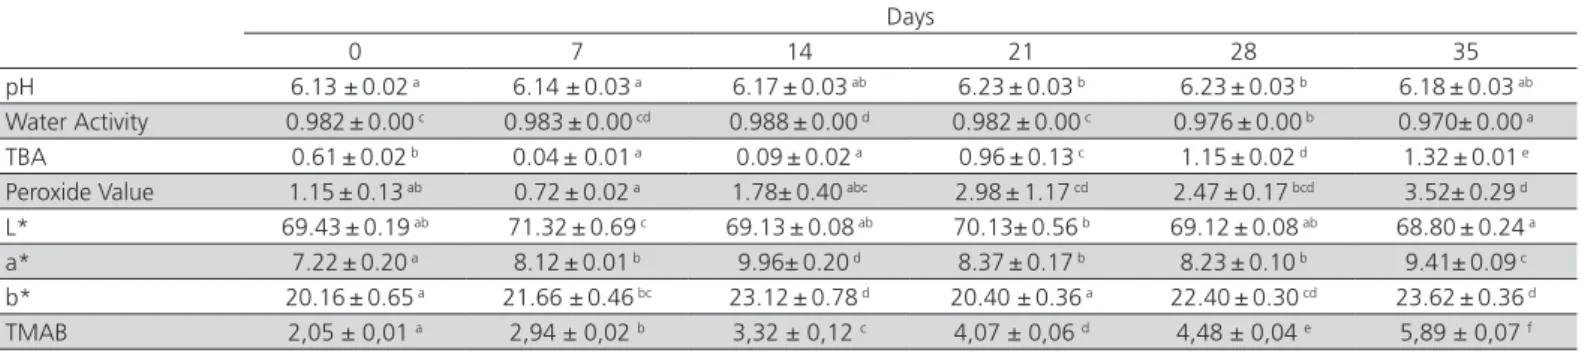
Table 2 and 3 show the mean values and standard deviations for the physical-chemical spoilage indices measured in SV cooked turkey cutlet stored at 4 and 12ºC. The highest pH value was determined as 6.22 at day 18 for 12ºC storage and 6.23 at day 21 and 28
Table 2 – Physical–chemical and microbiological results of SV cooked turkey cutlet stored at 4ºC
Days
0 7 14 21 28 35
pH 6.13 ±0.02 a 6.14 ±0.03 a 6.17±0.03 ab 6.23±0.03 b 6.23±0.03 b 6.18±0.03 ab
Water Activity 0.982±0.00 c 0.983±0.00 cd 0.988±0.00 d 0.982±0.00 c 0.976±0.00 b 0.970±0.00 a
TBA 0.61±0.02 b 0.04± 0.01 a 0.09±0.02 a 0.96±0.13 c 1.15±0.02 d 1.32±0.01 e
Peroxide Value 1.15±0.13 ab 0.72±0.02 a 1.78±0.40 abc 2.98±1.17 cd 2.47±0.17 bcd 3.52±0.29 d
L* 69.43±0.19 ab 71.32±0.69 c 69.13±0.08 ab 70.13±0.56 b 69.12±0.08 ab 68.80±0.24 a
a* 7.22±0.20 a 8.12±0.01 b 9.96±0.20 d 8.37±0.17 b 8.23±0.10 b 9.41±0.09 c
b* 20.16±0.65 a 21.66 ±0.46 bc 23.12±0.78 d 20.40 ±0.36 a 22.40±0.30 cd 23.62±0.36 d
TMAB 2,05 ± 0,01 a 2,94 ± 0,02 b 3,32 ± 0,12 c 4,07 ± 0,06 d 4,48 ± 0,04 e 5,89 ± 0,07 f
for 4ºC storage. Although during the storage the pH values of the samples stored at 4 and 12ºC increased, at the end of the storage the pH values decreased appreciably. These results can be interpreted as increase in pH with the precipitation of acid salts and decrease in pH with the precipitation of alkali salts in meat (Ergönül 2004). During the storage pH changes in turkey cutlets stored at 4ºC was found significant (p<0.05) but the changes in turkey cutlets stored at 12ºC was not found significant (p>0.05).
Water activity (aw) is a reference factor for spoilage in food (Diaz et al. 2011). During the storage period it was observed that the water activity values decrease gradually at each storage temperature. At the end of the storage while the samples stored at 4ºC have reached the water activity value of 0.970, the samples stored at 12ºC have reached the water activity value of 0.963. Due to the statistical analyses the changes in water activity values was found significant at each storage temperatures (p<0.05). The water activity results agree with the results in the study of Diaz et al. (2011) that the mean aw was higher than 0.9 and stable during storage. Stable aw values can be explained by polypropylene pouches presented good barrier properties to water vapor (Diaz et al. 2011).
The level of TBARS is related to the content of secondary lipid oxidation compounds, mainly aldehydes like malonaldehyde and it is important to identify the oxidation level of meat (Roldan et al. 2013). Oxidative rancidity cause off-flavor in poultry products during storage therefore TBARS values are used as an indicator to determine the level of oxidative deterioration of foods (Wang et al. 2004). Consumers are unlikely to detect these off-flavors in meat products at TBA values below a threshold of about 0.5 MDA/kg (Can & Harun 2015). The highest rate of TBARS value was determined as 1.32 mg malonaldehyde/kg sample at day 35 for 4ºC storage and 0.95 mg malonaldehyde/kg sample at day 12 for 12ºC storage. Due to the statistical analyses
the changes in TBARS values was found significant at each storage temperatures (p<0.05). This variability that occurred during storage is thought to be the result of the changes of oxidation reactions’ products. It was reported that when the TBARS value is below 1.0, oxidative rancidity usually cannot be detected by a sensory panel from chicken meat (Wang et al. 2004). In this study, the TBARS values of SV turkey cutlets were controlled on range of 0.61 to 1.32 during whole storage. Vacuum package is also an important factor to keep TBARS values under control. Similar to this result, Wang et al. (2004) reported that TBARS values of SV chicken wing parts ranged from 1.0-2.0 during 7 weeks storage.
Peroxide values of samples increased and decreased during the storage at each storage temperatures and the changes in peroxide values was found significant at each storage temperatures (p<0.05). The increases and decreases in peroxide values can be explained by the formation of malonaldehyde in the later stages of reaction and changes in the amount of the oxidation products (Roldan et al. 2014a). The samples stored at 4ºC as prescribed refrigerator temperature, reached highest peroxide value of 3.52 meq O2/kg oil at day 35. Turkey meat is rich in polyunsaturated fatty acid (PUFA), and this high PUFA content causes the development of oxidative rancidity (Kayaardi et al. 2005). Similar results were reported by Kayaardi et al. (2005) for the turkey meat doner kebab samples. They found that peroxide values increased with storage time when samples were stored at 4ºC. Alasnier et al. (2000) also found out that oxidative values increased in stored poultry meat.
L* values of samples increased during the storage but at the end of the storage L* values became close to their initial values. a* and b* values were found to increase during storage for each storage temperatures. Also due to the statistical analyses the changes in L*, a*, b* values were found significant at each storage temperatures (p<0.05). These results agrees with the
Table 3 – Average values and standard deviations for physical-chemical spoilage indices in SV cooked turkey cutlet stored at 12ºC
Days
0 3 6 9 12 15 18 21
pH 6.13±0.02 ab 6.17±0.01 ab 6.18±0.02 b 6.19± 0.05 ab 6.19±0.02 ab 6.20± 0.06 ab 6.22± 0.01 ab 6.10± 0.14 a
Water Activity 0.982±0.00 c 0.980±0.00 c 0.991±0.00 d 0.980±0.00 c 0.982±0.00 c 0.990±0.00 d 0.973±0.00 b 0.963±0.00 a
TBA 0.61±0.02 bc 0.68±0.02 bcd 0.31±0.00 a 0.48±0.12 abc 0.95±0.07 d 0.43±0.02 ab 0.74±0.11 cd 0.65±0.23 bc
Peroxide Value 1.15±0.13 a 1.26± 0.11 a 1.39± 0.31 a 2.85±0.56 b 2.87 ±0.38 b 1.36±0.24 a 1.66±0.32 a 3.63±0.34 b
L* 69.43±0.19 b 67.50±0.22 a 69.59±0.37 bc 69.08±0.40 b 70.30±0.02 c 69.36±0.10 b 69.46±0.40 b 69.16±0.28 b
a* 7.22±0.20 a 8.60±0.40 ab 8.41±1.08 ab 9.54±0.31 bc 8.64±0.59 ab 10.30±0.58 c 9.68±0.22 bc 8.39±0.27 ab
b* 20.16±0.65 a 21.73±1.76 ab 22.56±1.18 abc 24.15±0.84 bc 24.63±1.11 c 24.18±0.37 bc 23.23±0.11 bc 23.37±0.31 bc
TMAB 2,05±0,01 a 2,73±0,02 b 2,76 ± 0,03 b 3,24 ± 0,10 c 4,38 ± 0,04 d 5,47 ± 0,02 e 6,78 ± 0,10 f 7,15 ± 0,07 g
results from Pakula & Stamminger (2012), who have shown that the denaturing of myosin molecules causes visible changes in meat color opacity. Also at higher pH and ionic strengths myofibrillar muscle proteins swell, which alters light reflection, since a swollen muscle protein structure would permit a deeper penetration of light in the tissue, leading to a darker appearance (Roldan et al. 2013). These results can explaine the increase in a* and b* values at each storage temperatures.
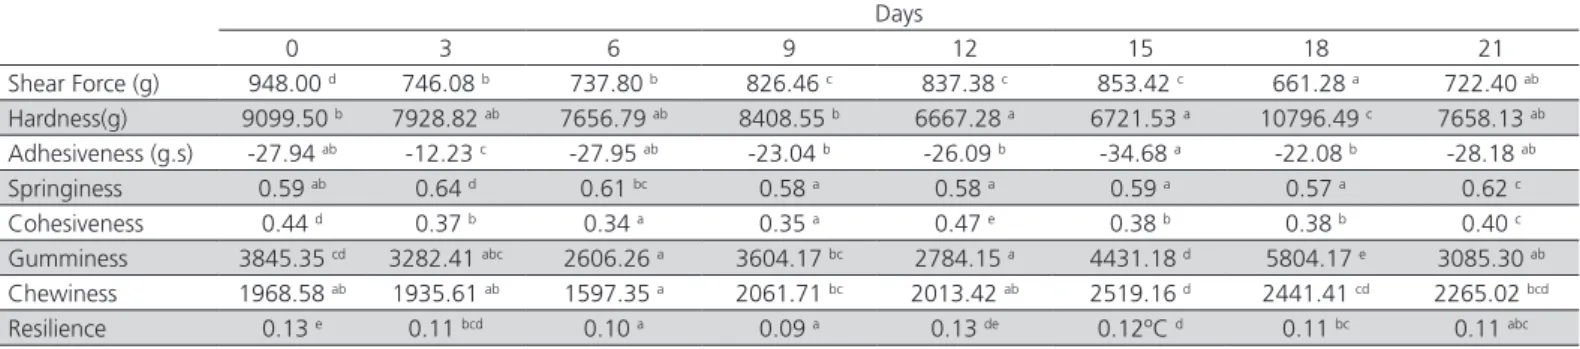
Textural Analyses
Table 4 and 5 shows the mean values and standard deviations for the textural analyses indices measured in SV cooked turkey cutlet stored at 4 and 12ºC. At the end of the storage for both temperature, it was seen that values of shear force, cohesiveness, gumminess and resilience decreased while values of chewiness increased as well as value of adhesiveness was stable. The changes in all texture profile analysis values was found significant at each storage temperatures (p<0.05). Softer and flakier appearance was observed in the samples during storage. Protein degradation due to chemical and enzymatic activity may be the reason for the samples to become softer and flakier in the storage. Although heating inactivates part of the muscle proteases, residual protease activity
continues in the refrigerated product (Diaz et al. 2008). According to Roldan et al. (2014b) the effect of the storage time on shear force was not clear, and only samples cooked at 60ºC for either 6 h or 24 h showed a significant effect, with a decrease during the first week of storage and steady values or slight increase thereafter. Wang et al. (2004) reported that there were no major changes in the shear values of sous vide cooked chicken wing parts during the 7 weeks of refrigerated storage.
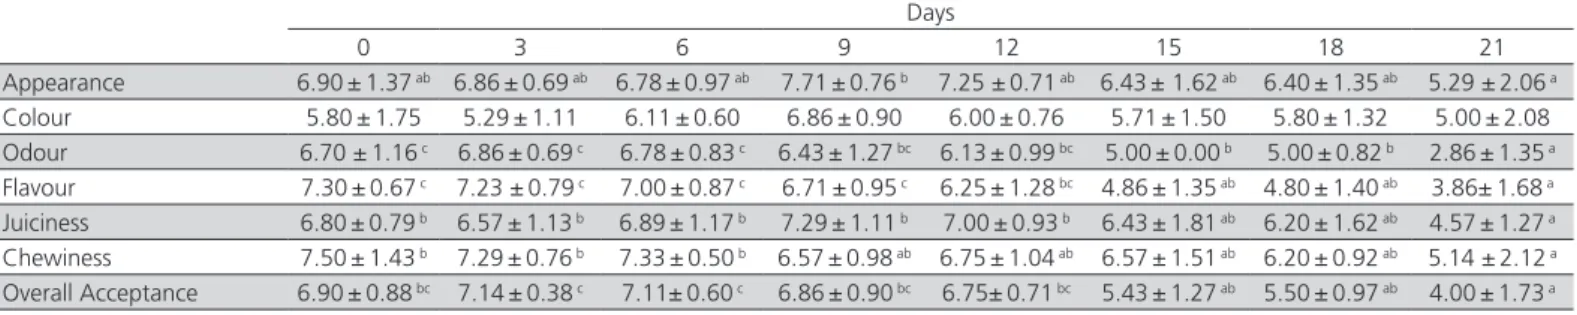
Sensory Analyses
Sensory analysis was crucial to detect the texture changes in the refrigerated SV cooked products. Levkane et al. (2010) informed that the shelf life of SV products ranges from 7 to 52 days depending on the food composition. Table 6 and 7 shows the mean values and standard deviations for the sensory spoilage indices measured in SV cooked turkey cutlet stored at 4 and 12ºC. While significant decrease the values of appearance, color and chewiness were not observed, there was found to be a significant decrease in the values of flavor, odor and overall acceptance in both storage temperatures. For 4ºC storage at day 35 and for 12ºC storage at day 21, odor and flavor values of the samples have dropped below 4 points determined as the consumption limit which has been proposed
Table 4 – Average values and standard deviations for textural spoilage indices in SV cooked turkey cutlet stored at 4ºC
Days
0 7 14 21 28 35
Shear Force (g) 948.00 d 857.14 cd 676.79 a 726.60 ab 806.14 bc 847.45 cd
Hardness (g) 9099.50 b 10438.38 b 7464.48 a 7560.77 a 10425.22 b 9790.46 b
Adhesiveness (g.s) -27.94 b -24.77 b -9.58 c -39.00 a -24.60 b -24.42 b
Springiness (cm) 0.59 ab 0.55 a 0.64 c 0.60 ab 0.62 bc 0.57 ab
Cohesiveness 0.44 c 0.48 d 0.39 b 0.37 ab 0.36 a 0.37 ab
Gumminess 3845.35 c 3266.40 ab 3009.16 a 3889.50 c 4517.88 d 3670.56 bc
Chewiness 1968.58 a 2195.87 a 1887.87 a 2019.25 a 2871.10 b 2592.85 b
Resilience 0.13 d 0.17 e 0.11 b 0.12 c 0.10 a 0.10 a
Means with different superscripts are significantly different (p<0.05).
Table 5 – Average values and standard deviations for textural spoilage indices in SV cooked turkey cutlet stored at 12ºC
Days
0 3 6 9 12 15 18 21
Shear Force (g) 948.00 d 746.08 b 737.80 b 826.46 c 837.38 c 853.42 c 661.28 a 722.40 ab
Hardness(g) 9099.50 b 7928.82 ab 7656.79 ab 8408.55 b 6667.28 a 6721.53 a 10796.49 c 7658.13 ab
Adhesiveness (g.s) -27.94 ab -12.23 c -27.95 ab -23.04 b -26.09 b -34.68 a -22.08 b -28.18 ab
Springiness 0.59 ab 0.64 d 0.61 bc 0.58 a 0.58 a 0.59 a 0.57 a 0.62 c
Cohesiveness 0.44 d 0.37 b 0.34 a 0.35 a 0.47 e 0.38 b 0.38 b 0.40 c
Gumminess 3845.35 cd 3282.41 abc 2606.26 a 3604.17 bc 2784.15 a 4431.18 d 5804.17 e 3085.30 ab
Chewiness 1968.58 ab 1935.61 ab 1597.35 a 2061.71 bc 2013.42 ab 2519.16 d 2441.41 cd 2265.02 bcd
Resilience 0.13 e 0.11 bcd 0.10 a 0.09 a 0.13 de 0.12ºC d 0.11 bc 0.11 abc
by Huss (1988). This result would be corresponded to protein degradation and lipid oxidation during the storage. Although heating at 70ºC inactivates part of the muscle proteases, residual protease activity continues in the refrigerated product (Diaz et al. 2008, Diaz et al. 2011).
CONCLUSION
For the termination of the storage besides the results of microbiological analysis, sensory analysis points primarily involved and when the flavor and odor points of the samples have dropped below 4 points, it was concluded that the samples have finished their shelf life. With the results of this study it was concluded that turkey cutlets which have cooked with SV method at 65ºC for 40 min protect their freshness for 28 days at 4ºC and 18 days at 12ºC. Considering that the raw turkey cutlet has a shelf life of 8 days, as reported by the producer company, SV cooked turkey cutlet will be more advantageous for the manufacturer and the consumer as well with its longer shelf life. Also product will be placed in the market in cooked and ready to eat forms so that the consumer’s preparation time at home will be shortened. SV cooked turkey cutlets satisfy the needs of individuals who are willing to prepare food in a shorter period and it will be an alternative product in our spread fast food consumer society.
ACKNOWLEDGEMENTS
This study was a part of a Master Thesis of Merve Bıyıklı (Abant Izzet Baysal University, Science Institute, Food Engineering Department) and also supported by Project Supporting Unit (BAP) of Abant Izzet Baysal University (Project Number: 2013.27.01.661).
REFERENCES
Alasnier C, Meynier A, Viau M, Gandemer G. Hydrolytic and oxidative changes in the lipids of chicken breast and thigh muscles during refrigerated storage. Journal of Food Science2000;65:9-13.
AOAC. Official methods of analysis. Arlington: Association of Official Analytical Chemists; 1990.
Atasever M, Keles A, Guner A, Tekinsen K. Salam üretiminde tavuk ve hindi eti kullanımı. Eurasian Journal of Veterian Science 2000;16(2):103-110.
Aucoin EJ. Nutritional and quality changes in a sous vide product pasteurized at various temperatures [master of science]. New Fooundland: Memorial University of New Foundland; 1997.
Baldwin DE. Sous vide cooking: a review. International Journal of Gastronomy and Food Science 2011;1:15-30.
Bourne MC. Texture profile analysis. Food Technology 1978;41:163-178.
Can ÖP, Harun F. Shelf life of chicken meat balls submitted to sous vide treatment. Brazilian Journal of Poultry Science 2015;17(2):137-144.
Çolak H, Uğurluay G, Nazli B, Bingöl EB. The effect of humidity absorbing filters used as packing material on the shelf life of turkey meat. İstanbul Üniversitesi Veterinerlik Fakültesi Dergisi 2011;37(2):107-116.
Diaz P, Garrido MD, Banon S. Spoilage of sous vide cooked salmon (salmo salar) stored under refrigeration. Food Science and Technology International 2011;17:31-37.
Table 6 – Average values and standard deviations for sensory spoilage indices in SV cooked turkey cutlet stored at 4ºC
Days
0 7 14 21 28 35
Appearance 6.90±1.37 7.00±0.87 7.00 ±0.89 5.86 ±1.77 6.25 ±1.28 5.67 ±1.75
Colour 5.80±1.75 6.11±1.45 5.67±1.21 5.29±1.89 5.63±1.51 5.17±1.17
Odour 6.70±1.16 b 6.78±0.83 b 5.50 ±1.22 ab 4.86±1.46 ab 5.13±1.64 ab 3.83±1.72 a
Flavour 7.30±0.67 c 7.00±0.87 c 5.83±1.17 bc 4.57±1.27 ab 5.00±0.93 b 3.17 ±1.17 a
Juiciness 6.80±0.79 bc 7.00±1.00 c 6.67±1.03 bc 5.43±0.53 abc 5.25±0.89 ab 4.83±2.14 a
Chewiness 7.50±1.43 c 7.33±0.87 bc 6.67±1.03 abc 5.43±0.79 ab 5.88±1.55 abc 5.33 ±1.75 a
Overall Acceptance 6.90±0.88 c 6.78±0.67 c 6.17±0.75 bc 5.00±1.41 ab 5.00±0.93 ab 4.17±1.47 a
Means with different superscripts are significantly different (p<0.05)
Table 7 – Average values and standard deviations for sensory spoilage indices in SV cooked turkey cutlet stored at 12ºC
Days
0 3 6 9 12 15 18 21
Appearance 6.90±1.37 ab 6.86±0.69 ab 6.78±0.97 ab 7.71±0.76 b 7.25 ±0.71 ab 6.43± 1.62 ab 6.40±1.35 ab 5.29 ±2.06 a
Colour 5.80±1.75 5.29±1.11 6.11±0.60 6.86±0.90 6.00±0.76 5.71±1.50 5.80±1.32 5.00±2.08 Odour 6.70 ±1.16 c 6.86±0.69 c 6.78±0.83 c 6.43±1.27 bc 6.13±0.99 bc 5.00±0.00 b 5.00±0.82 b 2.86±1.35 a
Flavour 7.30±0.67 c 7.23 ±0.79 c 7.00±0.87 c 6.71±0.95 c 6.25±1.28 bc 4.86±1.35 ab 4.80±1.40 ab 3.86±1.68 a
Juiciness 6.80±0.79 b 6.57±1.13 b 6.89±1.17 b 7.29±1.11 b 7.00±0.93 b 6.43±1.81 ab 6.20±1.62 ab 4.57±1.27 a
Chewiness 7.50±1.43 b 7.29±0.76 b 7.33±0.50 b 6.57±0.98 ab 6.75±1.04 ab 6.57±1.51 ab 6.20±0.92 ab 5.14 ±2.12 a
Overall Acceptance 6.90±0.88 bc 7.14±0.38 c 7.11±0.60 c 6.86±0.90 bc 6.75±0.71 bc 5.43±1.27 ab 5.50±0.97 ab 4.00±1.73 a
Diaz P, Nieto G, Garrido MD, Banon S. Microbial, physical-chemical and sensory spoilage during the refrigerated storage of cooked pork loin processed by the sous vide method. Meat Science 2008;80(2):287-292.
Ensoy Ü. The effects of using starter cultures and heating process on the characteristics of fermented turkey sausages [thesis]. Ankara (TUR): University; 2004.
Ergezer H, Gökçe R. The use of marination technique in poultry meat processing. Mühendislik Bilimleri Dergisi 2003;10(2):227-233.
Ergönül B. Dondurularak depolama süresinin çiğ hindi dönerlerinin kimyasal, mikrobiyolojik ve duyusal kalitesi üzerine etkisi [thesis]. Manisa (TUR): Celal Bayar University; 2004.
González-Fandos E, Villarino-Rodríguez A, García-Linares MC, Garcıa-Ariasb MT, Garcıa-Fernándezb MC. Microbiological safety and sensory characteristics of salmon slices processed by sous vide method. Food Control 2005;16:75-85.
Hansen TB, Kochel S, Juncher D, Bertelsen G. Storage characteristics of sous vide cooked roast beef. Journal Food Science Technology 1995;30:365–378.
Hunt MC, Acton JC, Benedict RC, Calkin CR, Cornforth DP, Jeremiah LE. Guidelines for meat colour evaluation. Proceedings of 44th Reciprocal
Meat Conference; 1991 June 9–12; Manhattan. Kan: American Meat Science Association; 1992.
Huss HH. Fresh fish quality and quality changes [fisheries series, 29]. Rome: Food and Agriculture Organization of the United Nations; 1988.
ISO 11290. Microbiology of food and animal feeding stuffs – horizontal method for the detection and enumeration of Listeria monocytogenes – part 1: detection method [cited 2014 Dec 12]. Geneva: International Organization for Standardization; 1996. Available from: http:// www.iso.org/iso/home/store/catalogue_tc/catalogue_detail. htm?csnumber=19268.
ISO 6579. Microbiology of food and animal feeding stuffs – horizontal method for the detection of Salmonella spp [cited 2014 Dec 12]. Geneva: International Organization for Standardization; 2012. Available from: http://www.iso.org/iso/catalogue_detail.htm?csnumber=29315.
Jang JD, Seo GH, Lyu ES, Yam KL, Lee DS. Hurdle effect of vinegar and sake on korean seasoned beef preserved by sous vide packaging. Food Control 2006;17(3):171-175.
Kayaardi S, Kundakçi A, Kayacier A, Gok V. Sensory and chemıcal analysıs of doner kebab made from turkey meat. Journal of Muscle Foods 2005;17:165-173.
Kolsarici N, Candoğan K. Effects of potasium sorbate and lactic acid on the shelf life of vacuum packaged chicken meats. Poultry Science 1995;74(11):1884-1893.
Levkane V, Muizniece-Brasava S, Dukalska L. Sous vide packaging technology application for salad with meat in mayonnaise shelf life extension. International Journal of Chemical and Biological Engineering 2010;3:110-114.
Mol S, Özturan S, Cosansu S. Determination of the quality and shelf life of sous vide packaged bonito (Sarda sarda, bloch, 1793) stored at 4 and 12C. Journal of Food Quality 2012;35:137–143.
Mol S, Özturan S. Sous vide technology and applications to the seafoods. Journal of Fisheries Sciences 2009;3(1):68-75.
Nyati H. An evaluation of the effect of storage and processing temperatures on the microbiological status of sous vide extended shelf-life products. Food Control 2000;11:471-476
Pakula C, Stamminger R. Measuring changes in internal meat colour, colour lightness and colour opacity as predictors of cooking time. Meat Science 2012;90:721-727.
Pino Hernández EJG, Carvalho Jr. RN, Peixoto Joele MRS, Araújo CS, Henriques Lourenço LF. Effects of modified atmosphere packing over the shelf life of sous vide from captive pirarucu (Arapaima gigas). Innovative Food Science & Emerging Technologies 2017;39:94-100.
Roldan M, Antequera T, Armenteros M, Ruiz J. Effect of different temperature-time combinations on lipid and protein oxidation of sous-vide cooked lamb loins. Food Chemistry 2013;149:129-136.
Roldan M, Antequera T, Hernveez A, Ruiz J. Physicochemical and microbiological changes during the refrigerated storage of lamb loins sous-vide cooked at different combinations of time and temperature. Food Science and Technology International 2014b;1:1-11.
Roldan M, Antequera T, Palacioz T, Ruiz J. Effect of added phosphate and type of cooking method on physico-chemical and sensory features of cooked lamb loins. Meat Science 2014a;97:69-75.
Shakila RJ, Jeyasekaran G, Vijayakumar A, Sukumar D. Microbiological quality of sous-vide cook chill fish cakes during chilled storage (3C). International Journal of Food Science and Technology 2009;44:2120– 2126.
Simpson MV, Smith JP, Simpson BK, Ramaswamy H, Dodds KL. Storage studies on a sous vide spaghetti and meat sauce product. Food Microbiology 1994;11:5–14.
Singh CB, Kumari N, Senapati SR, Lekshmi M, Nagalakshmi K, Balange AK, et al. Sous vide processed ready-to-cook seerfish steaks: Process optimization by response surface methodology and its quality evaluation. LWT - Food Science and Technology 2016;74:62-69.
Sipahi C. Türkiye’de hindi eti ve önemi. Veteriner Hekimler Derneği Dergisi 2006;77(4):16-21.
Tarladgis BG, Watts BM, Younathan MT, Dugan L. A distillation method for the quantitative determination of malonaldehyde in rancid foods. Journal of American Oil Chemist’ Society 1960;37:44-48.
TSE - Türk Standartları Enstitüsü. Et ve mamullerinde pH tayini. Referans Metot (TS 3136). Ankara;1990.