Cop
yright
© AE&M all rights r
eser
ved.
Metabolic syndrome components
are associated with oxidative stress
in overweight and obese patients
Nayara Rampazzo Morelli1, Bruna Miglioranza Scavuzzi1,
Lucia Helena da Silva Miglioranza2, Marcell Alysson Batisti Lozovoy3,
Andréa Name Colado Simão3, Isaias Dichi4
ABSTRACT
Objective: The aim of this study is to evaluate the influence of the body mass index (BMI) and the
metabolic syndrome (MetS) parameters on oxidative and nitrosative stress in overweight and obese subjects. Subjects and methods: Individuals were divided into three groups: the control group (G1, n = 131) with a BMI between 20 and 24.9 kg/m2, the overweight group (G2, n = 120) with a BMI between 25 and 29.9 kg/m2 and the obese group (G3, n = 79) with a BMI ≥ 30 kg/m2. Results: G3 presented higher advanced oxidation protein products (AOPPs) in relation to G1 and G2 (p = 0.001 and p = 0.011, respectively) whereas G2 and G3 had lower levels of nitric oxide (NO) (p = 0.009 and p = 0.048, respectively) compared to G1. Adjusted for the presence of MetS to evaluate its influence, the levels of AOPPs did not differ between the groups, whereas NO remained significantly lower. Data adjusted by the BMI showed that subjects with higher triacylglycerol levels had higher AOPPs (p = 0.001) and decreased total radical-trapping antioxidant parameter/uric Acid (p = 0.036). Subjects with lower high-density lipoprotein (HDL) levels and patients with higher blood pressure showed increased AOPPs (p = 0.001 and p = 0.034, respectively) and lower NO levels (p = 0.017 and p = 0.043, respectively). Subjects who presented insulin resistance had higher AOPPs (p = 0.024). Conclusions:
Nitrosative stress was related to BMI, and protein oxidation and nitrosative stress were related to metabolic changes and hypertension. MetS components were essential participants in oxidative and nitrosative stress in overweight and obese subjects. Arch Endocrinol Metab. 2018;62(3):309-18
Keywords
Overweight; obesity; metabolic syndrome; oxidative stress; nitrosative stress
1 Departamento de
Pós-Graduação em Ciências da Saúde, Universidade Estadual de Londrina (UEL), Londrina, PR, Brasil
2 Departamento de Ciência
e Tecnologia de Alimentos, Universidade Estadual de Londrina (UEL), Londrina, PR, Brasil
3 Departamento de Patologia,
Análises Clínicas e Toxicológicas, Universidade Estadual de Londrina (UEL), Londrina, PR, Brasil
4 Departamento de Medicina
Interna, Universidade Estadual de Londrina (UEL), Londrina, PR, Brasil
Correspondence to:
Isaias Dichi
Departamento de Medicina Interna, Universidade Estadual de Londrina Av. Robert Koch, 60
86038-440 – Londrina, PR, Brasil [email protected]
Received on May/3/2017 Accepted on Nov/15/2017
DOI: 10.20945/2359-3997000000036
INTRODUCTION
O
besity and overweight are chronic disorders of multifactorial origin, which can be defined as an increase in the accumulation of body fat (1). Changes in lifestyle and diet have resulted in an increased number of overweight and obese subjects in developed and developing countries (2). This trend has been verified in practically all ages, genders and ethnicities (2). Therefore, overweight and obesity have emerged as two of the largest public health problems worldwide. Excess body weight is associated with an increased risk of developing metabolic syndrome (MetS). MetS is a complex disorder that is represented by a cluster of cardiovascular risk factors that are associated with central fat deposition, abnormal plasma lipid levels, elevated blood pressure, insulin resistance and alow-grade inflammatory state. MetS has also been associated with increased oxidative and nitrosative stress (3).
Cop
yright
© AE&M all rights r
eser
ved.
Although markers of oxidative stress have been studied in obese and overweight patients with and without MetS, we are not aware to date of studies evaluating the influence of body weight on oxo-nitrosative stress in the other components of MetS.
In a previous study performed by our group, we verified that an increase in oxidative stress is mostly attributable to obesity in patients with MetS (8), but this is not the case in overweight subjects without MetS. It is therefore unclear whether metabolic changes of obesity, referred to as metabolic obesity, are independent risk factors for increased oxo-nitrosative stress than the other components of MetS. In order to extend the data of the mentioned study, the objective of the present study was to evaluate the influence of the body mass index (BMI) on oxidative and nitrosative stress in overweight and obese subjects and to verify whether the presence of the components of MetS would modify the results.
SUBJECTS AND MATERIALS
Subjects
Patients from the Internal Medicine Ambulatory of the University Hospital of Londrina, Paraná, Brazil were chosen to participate in this cross-sectional study. Three hundred and thirty patients agreed to participate in the study. Inclusion criteria were patients (both genders) aged from 18 to 65 years. Exclusion criteria were thyroid, renal, hepatic, gastrointestinal, infectious or oncological diseases and the use of lipid-lowering drugs, drugs for hyperglycemia, anti-inflammatory drugs, hormone replacement therapy, and antioxidant supplements. For ethical reasons, patients who were taking antihypertensive drugs were not excluded and were allowed to continue taking the same dose of the drugs.
The patients were divided into three groups: the control group included 131 subjects with a BMI between 20 and 24.9 kg/m2. The overweight group consisted of 120 subjects with a BMI between 25 and 29.9 kg/m2, and the group with obesity consisted of 79 subjects with a BMI ≥ 30. MetS was defined following the Adult Treatment Panel III criteria. A diagnosis of MetS was arrived at for subjects with at least three of the following five characteristics: (1) abdominal obesity, which was defined as a waist circumference (WC) ≥ 102 cm in men and ≥ 88 cm in women; (2)
hypertriglyceridemia, which was defined as triglycerides ≥ 150 mg/dL; (3) low levels of high-density lipoprotein (HDL) cholesterol, which was defined as HDL ≤ 40 mg/dL in men and ≤ 50 mg/dL in women; (4) high blood pressure, which was defined as blood pressure ≥ 130/85 mmHg; and (5) high-fasting glucose, which was defined as glucose ≥ 100 mg/dL.
Ethics, consent, health and safety
The research was conducted in an ethical and responsible manner and is in full compliance with all relevant codes of experimentation. In addition, the Ethical Committee of the University of Londrina – Paraná, Brazil – approved all procedures involving human participants (185/2013). This clinical investigation was conducted according to the principles expressed in the Declaration of Helsinki.
Written informed consent was obtained from all the participants, who acknowledged that they cannot be identified via the paper and that they are fully anonymized.
All mandatory laboratory health and safety procedures have been complied.
Anthropometric and blood pressure measurements
Anthropometric measurements and laboratorial parameters were assessed. Body weight was measured to the nearest 0.1 kg in the morning through the use of an electronic scale, with individuals wearing light clothing and no shoes; height was measured to the nearest 0.1 cm through the use of a stadiometer. BMI was calculated as weight (kg) divided by height (m) squared. WC was measured on standing subjects midway between the lowest rib and the iliac crest. Three blood pressure measurements taken with a 1-min interval after the participant had been seated were recorded on the left arm. The mean of these measurements was used in the analysis. We considered the current use of antihypertensive medication as an indication of high blood pressure.
Biochemical, immunological, and hematological biomarkers
Cop
yright
© AE&M all rights r
eser
ved.
lipoprotein (LDL), triacylglycerol (TG), glucose and uric acid (UA). Plasma insulin level was determined by chemiluminescence microparticule immunoassay (Architect, Abbott Laboratory, Abbott Park, IL, USA). The homeostasis model assessment insulin resistance (HOMA-IR) was used as a surrogate measurement of insulin sensitivity. HOMA-IR = fasting insulin (U/ml) x fasting glucose (mmol/L)/22.5. IR was considered when HOMA-IR ≥ 2.5 (9).
Oxidative and nitrosative stress measurements
Samples for evaluating oxidative stress and total antioxidant capacity were analyzed with e thylenediamine tetraacetic acid as an anticoagulant and antioxidant. All samples were centrifuged at 3,000 rpm for 15 minutes, and plasma aliquots were stored at -70ºC until assayed. All stress measurements were performed in triplicate.
Tert-butyl hydroperoxide-initiated chemiluminescence (CL-LOOH)
CL-LOOH in plasma was evaluated as described previously by Gonzales Flecha and cols. (10). CL-LOOH is considered to be much more sensitive and specific than the thiobarbituric acid reactive substances method, the usual method to determine lipid oxidation. For the CL measurement, reaction mixtures were placed in 20-mL scintillation vials (low-potassium glass) containing final concentrations of plasma (250 uL), 30 mM KH2PO4/K2HPO4 buffer (pH 7.4), and 120 mM KCl with 3 mM of LOOH in a final volume of 2 mL. CL-LOOH was measured in a Beckman LS 6000 liquid scintillation counter set to the out-of-coincidence mode, with a response of 300 to 620 nm. The vials were kept in the dark until the moment of assay, and determination was carried out in a dark room at 30°C. The results were expressed in counts per minute.
Determination of advanced oxidation protein products (AOPPs)
AOPPs were determined in the plasma using the semi-automated method described by Witko-Sarsat and cols. (11). AOPP concentrations were expressed as micromoles per liter (µmol/L) of chloramines-T equivalents.
Total radical-trapping antioxidant parameter (TRAP)
TRAP was determined as reported by Repetto and cols. (12). This method detects hydrosoluble and
liposoluble plasma antioxidants by measuring the chemiluminescence inhibition time induced by 2,2-azobis (2-amidinopropane). The system was calibrated with the vitamin E analog TROLOX, and the values of TRAP were expressed in the equivalent of μM Trolox/mg UA. TRAP measurements in conditions associated with hyperuricemia, such as MetS, may be inaccurate because the UA concentration accounts for 60% of the total plasma antioxidant capacity. Some reports have verified an unexpected increase in TRAP in MetS subjects (13). Thus, a correction of TRAP based on UA concentration was performed (13).
Determination of sulfhydryl (SH) groups of proteins
SH groups of proteins were evaluated in plasma samples through a spectrophotometric assay based on 2,2-dithiobisnitrobenzoic acid (DTNB), as reported previously (14), and the results are expressed in μM.
Evaluation of nitric oxide metabolites (NOx)
The NO concentration in a sample was estimated by measuring the NOx in nitrites (NO2-) and nitrates (NO3-) using cadmium beads for the reduction of nitrate to nitrite. The concentrations of these metabolites were later determined according to the method proposed by Griess (15). The values were expressed in µM.
Statistical analysis
Cop
yright
© AE&M all rights r
eser
ved.
RESULTS
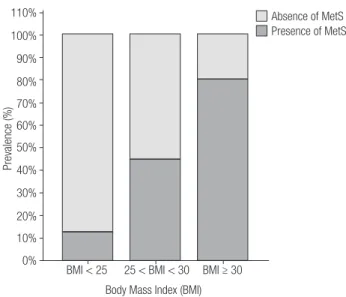
There was no statistically significant difference in ethnicity between the three groups (Table 1). Overweight (G2) and obese subjects (G3) did not differ regarding sex and age. However, the control group (G1) had a higher frequency of women compared to the subjects in G2 (p < 0.0001) and G3 (p < 0.05), and they were younger (p < 0.0001) than those in the G2 and G3 groups. The presence of MetS was higher (p < 0.0001) in G3 compared to G1 and G2 and in G2 compared to G1 (Table 1 and Figure 1). G3 presented higher WC (p < 0.0001, p < 0.0001), glucose (p < 0.0001, p < 0.05), insulin (p < 0.001, p < 0.001), HOMA-IR (p < 0.001, p < 0.001), and TG (p < 0.001, p < 0.01) and decreased HDL–cholesterol (p < 0.001, p < 0.05) levels compared to G1 and G2, respectively (Table 1). Meanwhile, G2 had higher WC (p < 0.0001), glucose (p < 0.001), insulin, HOMA-IR, and TG and decreased (p < 0.001) HDL-cholesterol levels compared to G1. G2 and G3 showed higher total cholesterol (p < 0.05) and LDL cholesterol (p < 0.01) levels compared to those of G1 (Table 1).
Table 2 shows the results of oxidative stress in the three studied groups with p values adjusted for sex and age. G3 presented higher AOPP values in relation to
Table 1. Clinical and laboratory characteristics of controls (G1), overweight (G2) and obese subjects (G3)
G1 (n = 131) G2 (n = 120) G3 (n = 79) G1 X G2 G1 X G3 G2 X G3
Gender (% men) 18 43 32 < 0.0001 < 0.05 0.1231
Ethnicity (% caucasians) 80 78 82 0.8420 0.8525 0.6180
MetS (Y/N) 12/119 65/55 72/7 < 0.0001 < 0.0001 < 0.0001
Age 32.0 (25.0-43.0) 43.0 (34.5-53.0) 43.0 (34.0-50.0) < 0.001 < 0.001 NS BMI (kg/m2) 22.04 (20.90-23.57) 27.12 (25.98-28.33) 32.25 (31.04-34.99) <0.001 < 0.001 < 0.001
WC (cm) 82.0 (77.0-88.0) 97.0 (91.0-101.0) 108.0 (103.0-115.0) < 0.0001 < 0.0001 < 0.0001
Fating glucose (mg/dL) 86.0 (83.0-92.0) 92.0 (85.0-98.0) 98.0 (88.0-107.0) < 0.001 < 0.001 < 0.05
Insulin (U/mL) 6.4 (4.65-8.80) 8.10 (5.90-12.90) 14.5 (10.9-17.4) < 0.001 < 0.001 < 0.001
HOMA-IR 1.338 (1,020-1,940) 1.989 (1.285-3.238) 3.234 (2.696-4.781) < 0.001 < 0.001 < 0.001
Total cholesterol (mg/dL) 186.0 (152.5-209,0) 197.0 (168.0-226.0) 198.0 (180.0-224.0) < 0.050 < 0.010 NS HDL-cholesterol (mg/dL) 56.5 (48.5-67.0) 46.5 (38.0-59.5) 42.0 (37.0-51.0) < 0.001 < 0.001 < 0.05
LDL-cholesterol (mg/dL) 109.8 (83.8-130.2) 121.0 (95.2-141.1) 125.3 (100.5-142.0) < 0.050 < 0.010 NS Triacylglycerol (mg/dL) 74.5 (48.5-107.5) 124.0 (90.0-183.0) 175.0 (127.0-231.0) < 0.001 < 0.001 < 0.01
MetS: metabolic syndrome; BMI: body mass index; WC: waist circumference; IR: insulin resistance; HOMA: homeostasis model assessment; HDL: high-density lipoprotein; LDL: low-density lipoprotein; NS: nonsignificant; WC: waist circumference.
Table 2. Oxidative stress evaluation in controls (G1), overweight (G2) and obese subjects (G3)
G1 (n = 131) G2 (n = 120) G3 (n = 79) G1 X G2* G1 X G3* G2 X G3*
Hydroperoxides (cpm) 13900 (10740-17010) 14120 (10950-17350) 13540 (10250-16260) NS NS NS
AOPP (µmol/L) 127.2 (98.2-174.4) 159.5 (124.7-230.3) 195.2 (157.3.257.1) NS 0.001 0.011
NO (μM) 25.67 (13.67-40.45) 13.83 (8.17-42.84) 12.10 (7.96-27.63) 0.009 0.048 NS TRAP/UA (μM Trolox/mg/dL) 177.1 (147.2-207.5) 158.8 (126.9-190.0) 138.0 (115.3-164.9) NS NS NS
AOPP: advanced oxidation protein products; NO: nitric oxide; TRAP: total radical-trapping antioxidant parameter; UA: uric acid; NS: nonsignificant.
* Adjusted p value for sex and age. AOPP was not significant after adjusting for the presence of MetS, whereas NO maintained its significance.
Figure 1. Prevalence of the metabolic syndrome across body mass index
categories. Normal weight, < 25 kg/m2; overweight, 25-30 kg/m2; and
obese, ≥ 30 kg/m2.
BMI < 25 110%
100%
90%
80%
70%
60%
50%
40%
30%
20%
10%
0%
25 < BMI < 30
Body Mass Index (BMI)
Absence of MetS Presence of MetS
Prevalence (%)
Cop
yright
© AE&M all rights r
eser
ved.
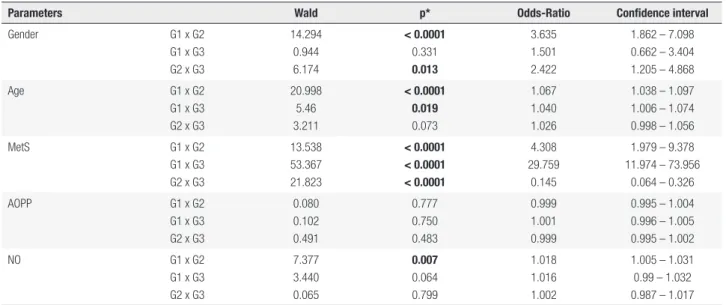
Table 3. Stepway analysis for oxidative stress evaluation in controls (G1), overweight (G2) and obese subjects (G3) BMI
Parameters Wald p* Odds-Ratio Confidence interval
Gender G1 x G2
G1 x G3 G2 x G3
14.294 0.944 6.174
< 0.0001
0.331
0.013
3.635 1.501 2.422
1.862 – 7.098 0.662 – 3.404 1.205 – 4.868
Age G1 x G2
G1 x G3 G2 x G3
20.998 5.46 3.211
< 0.0001 0.019
0.073
1.067 1.040 1.026
1.038 – 1.097 1.006 – 1.074 0.998 – 1.056
MetS G1 x G2
G1 x G3 G2 x G3
13.538 53.367 21.823
< 0.0001 < 0.0001 < 0.0001
4.308 29.759
0.145
1.979 – 9.378 11.974 – 73.956
0.064 – 0.326
AOPP G1 x G2
G1 x G3 G2 x G3
0.080 0.102 0.491
0.777 0.750 0.483
0.999 1.001 0.999
0.995 – 1.004 0.996 – 1.005 0.995 – 1.002
NO G1 x G2
G1 x G3 G2 x G3
7.377 3.440 0.065
0.007
0.064 0.799
1.018 1.016 1.002
1.005 – 1.031 0.99 – 1.032 0.987 – 1.017
MetS: metabolic syndrome; AOPP: advanced oxidation protein products; NO: nitric oxide. * Adjusted p value for sex, age and presence of MetS. AOPP was not significant after adjusting for sex and age, whereas NO maintained its significance when comparing controls and overweight subjects.
G1 and G2 (p = 0.001 and p = 0.011, respectively), whereas significantly lower NOx values were found in G2 and G3 when compared to those of G1 (p = 0.009 and p = 0.048, respectively). The groups were then adjusted for the presence of MetS to evaluate its influence on the results. In this new analysis, AOPPs did not differ between the groups, whereas significant lower NO maintained its significance. Lipid hydroperoxides and TRAP/UA did not have any significant change in the groups. Table 3 shows the results obtained after performing multiple regressive stepwise analyses to clarify the importance of body weight on oxidative and nitrosative stress; AOPPs were not significant after adjusting for sex, age and the presence of MetS when comparing controls and overweight, controls and obese and overweight and obese (0.777; 0.750; 0.483, respectively). NO maintained its significance when comparing controls and overweight subjects (0.007; 0.064; 0.799, respectively).
To verify the association between oxidative stress biomarkers and the presence of MetS, a binary logistic regression was performed and was adjusted for sex and age. The AOPP levels were directly associated with the presence of MetS (Wald = 16.039, df = 1, OR = 1.009, 95% CI = 1.005-1.009, p < 0.0001), and the NO values were inversely associated (Wald = 18.941, df = 1, OR = 0.958, 95% CI = 0.940-0.977, p < 0.0001) with the presence of MetS (data not shown).
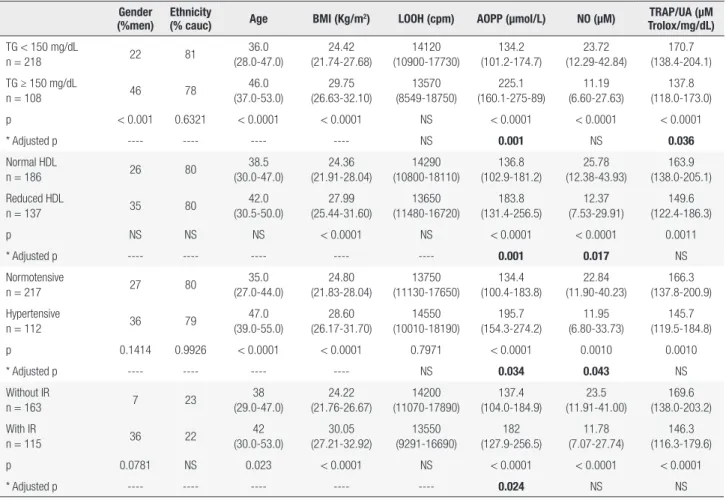
The association between the oxidative stress parameters and the individual components of MetS was measured, and the values were adjusted by BMI, sex, age
and ethnicity; the results are shown in Table 4. Subjects with higher TG levels had higher AOPPs (p = 0.001) and decreased TRAP/UA levels (p = 0.036) compared to individuals without hypertriacylglycerolemia. Subjects with lower HDL cholesterol and patients with higher blood pressure levels showed increased AOPPs (p = 0.001 and p = 0.034, respectively) and lower NO levels (p = 0.017 and p = 0.043, respectively) compared to individuals without low HDL-cholesterol levels and with normal blood pressure. Subjects who presented insulin resistance had higher AOPP levels (p = 0.024) compared to those without insulin resistance.
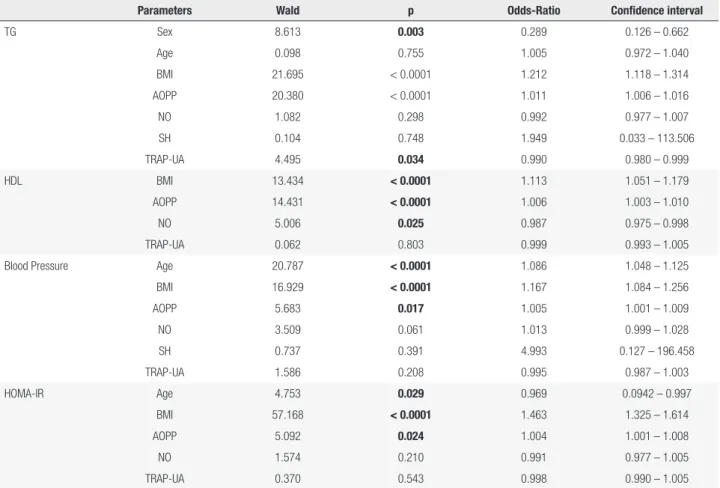
Multiple regressive stepwise analyses were performed (Table 5). After adjusting for sex, age and the presence of MetS, AOPPs maintained their significance for TG, HDL, blood pressure and HOMA-IR (< 0.0001, < 0.0001, 0.017, and 0.024, respectively); NO maintained its significance for HDL (0.025), and TRAP maintained its significance for TG (0.034).
DISCUSSION
Cop
yright
© AE&M all rights r
eser
ved.
Table 4. Oxidative stress evaluation according to the components of the metabolic syndrome
Gender (%men)
Ethnicity
(% cauc) Age BMI (Kg/m
2) LOOH (cpm) AOPP (µmol/L) NO (μM) TRAP/UA (μM
Trolox/mg/dL)
TG < 150 mg/dL
n = 218 22 81
36.0 (28.0-47.0) 24.42 (21.74-27.68) 14120 (10900-17730) 134.2 (101.2-174.7) 23.72 (12.29-42.84) 170.7 (138.4-204.1)
TG ≥ 150 mg/dL
n = 108 46 78
46.0 (37.0-53.0) 29.75 (26.63-32.10) 13570 (8549-18750) 225.1 (160.1-275-89) 11.19 (6.60-27.63) 137.8 (118.0-173.0)
p < 0.001 0.6321 < 0.0001 < 0.0001 NS < 0.0001 < 0.0001 < 0.0001
* Adjusted p ---- ---- ---- ---- NS 0.001 NS 0.036
Normal HDL
n = 186 26 80
38.5 (30.0-47.0) 24.36 (21.91-28.04) 14290 (10800-18110) 136.8 (102.9-181.2) 25.78 (12.38-43.93) 163.9 (138.0-205.1) Reduced HDL
n = 137 35 80
42.0 (30.5-50.0) 27.99 (25.44-31.60) 13650 (11480-16720) 183.8 (131.4-256.5) 12.37 (7.53-29.91) 149.6 (122.4-186.3)
p NS NS NS < 0.0001 NS < 0.0001 < 0.0001 0.0011
* Adjusted p ---- ---- ---- ---- ---- 0.001 0.017 NS
Normotensive
n = 217 27 80
35.0 (27.0-44.0) 24.80 (21.83-28.04) 13750 (11130-17650) 134.4 (100.4-183.8) 22.84 (11.90-40.23) 166.3 (137.8-200.9) Hypertensive
n = 112 36 79
47.0 (39.0-55.0) 28.60 (26.17-31.70) 14550 (10010-18190) 195.7 (154.3-274.2) 11.95 (6.80-33.73) 145.7 (119.5-184.8)
p 0.1414 0.9926 < 0.0001 < 0.0001 0.7971 < 0.0001 0.0010 0.0010
* Adjusted p ---- ---- ---- ---- NS 0.034 0.043 NS
Without IR
n = 163 7 23
38 (29.0-47.0) 24.22 (21.76-26.67) 14200 (11070-17890) 137.4 (104.0-184.9) 23.5 (11.91-41.00) 169.6 (138.0-203.2) With IR
n = 115 36 22
42 (30.0-53.0) 30.05 (27.21-32.92) 13550 (9291-16690) 182 (127.9-256.5) 11.78 (7.07-27.74) 146.3 (116.3-179.6)
p 0.0781 NS 0.023 < 0.0001 NS < 0.0001 < 0.0001 < 0.0001
* Adjusted p ---- ---- ---- ---- ---- 0.024 NS NS
Cauc: Caucasian; BMI: body mass index; IR: insulin resistance; LOOH: hydroperoxides; AOPP: advanced oxidation protein products; NO: nitric oxide; TRAP: total radical-trapping antioxidant parameter; UA: uric acid; TG: tryacylglycerols; NS: nonsignificant.
* Binary logistic regression adjusted for sex, age, ethnicity and BMI.
this study verified that protein oxidation was associated with several individual components of MetS, including insulin resistance.
The present data are partially in agreement with our previous study, which showed that increases in oxidative stress markers in overweight subjects were only verified in the presence of MetS (8). However, in that study, obese subjects and nitrosative stress were not evaluated, which differs from the conditions of the present study. Thus, the impact of this original work lays in the observation that only nitrosative stress was related to BMI, whereas protein oxidation was related to each component of MetS.
Although an increase in oxidative stress in patients with obesity is an undisputed issue and can be caused by several factors (16), the present study is in line with others, which pointed out the utmost importance of the presence of MetS to reinforce this association. Skalicky and cols. (17) verified in obese subjects and
Krzystek-Korpacka and cols. (18) verified in overweight and obese adolescents that oxidative stress seemed to be increased through a combination of risk factors associated with MetS rather than by obesity per se. Fujita and cols. (19) demonstrated that values of oxidative stress increased with the number of components of MetS. Taken together, these data suggest that – although weight gain or visceral fat may contribute, to some extent, to an increase in oxidative stress – the presence of MetS is fundamental in showing ROS augmentation in overweight and obese subjects.
Cop
yright
© AE&M all rights r
eser
ved.
Table 5. Multiple regressive stepwise analysis for oxidative stress evaluation in different components of the metabolic syndrome
Parameters Wald p Odds-Ratio Confidence interval
TG Sex 8.613 0.003 0.289 0.126 – 0.662
Age 0.098 0.755 1.005 0.972 – 1.040
BMI 21.695 < 0.0001 1.212 1.118 – 1.314
AOPP 20.380 < 0.0001 1.011 1.006 – 1.016
NO 1.082 0.298 0.992 0.977 – 1.007
SH 0.104 0.748 1.949 0.033 – 113.506
TRAP-UA 4.495 0.034 0.990 0.980 – 0.999
HDL BMI 13.434 < 0.0001 1.113 1.051 – 1.179
AOPP 14.431 < 0.0001 1.006 1.003 – 1.010
NO 5.006 0.025 0.987 0.975 – 0.998
TRAP-UA 0.062 0.803 0.999 0.993 – 1.005
Blood Pressure Age 20.787 < 0.0001 1.086 1.048 – 1.125
BMI 16.929 < 0.0001 1.167 1.084 – 1.256
AOPP 5.683 0.017 1.005 1.001 – 1.009
NO 3.509 0.061 1.013 0.999 – 1.028
SH 0.737 0.391 4.993 0.127 – 196.458
TRAP-UA 1.586 0.208 0.995 0.987 – 1.003
HOMA-IR Age 4.753 0.029 0.969 0.0942 – 0.997
BMI 57.168 < 0.0001 1.463 1.325 – 1.614
AOPP 5.092 0.024 1.004 1.001 – 1.008
NO 1.574 0.210 0.991 0.977 – 1.005
TRAP-UA 0.370 0.543 0.998 0.990 – 1.005
TG: triacylglycerol; HDL: high-density lipoprotein; HOMA-IR: homeostasis model assessment-insulin resistance; BMI: body mass index; AOPP: advanced oxidation protein products; NO: nitric oxide; Sulfhydryl (SH) groups of proteins; TRAP-UA: total radical-trapping antioxidant parameter-uric acid.
After adjusting for sex and age AOPP maintained its significance for TG, HDL, hypertension and HOMA-IR, NO maintained its significance for HDL and TRAP-AU maintained its significance for TG. Whereas the other oxidative and nitrosative stress markers lost significance.
is acquired, all the other components of MetS could be developed as a result (21,22). Hypertriacylglycerolemia and hypertension lead to an increased production of superoxide anion (O2-) via the nicotinamide adenosine diphosphate oxidase pathway. This anion reacts rapidly with NO to form peroxynitrite (ONOO-) – thus inactivating NO and leading to endothelial dysfunction, one of the mechanisms responsible for hypertension in these patients (23) – whereas HDL cholesterol antioxidant activity, a major mechanism mediating its cardioprotective effect, is impaired (20). Of note, in the current study, hypertriacylglycerolemia showed the highest degree of redox imbalance, as it was the only MetS component, and it concomitantly increased protein oxidation and decreased antioxidant capacity.
Our results show an association between the presence of insulin resistance and increased levels of protein oxidation. Although several reports have established the importance of insulin resistance and
Cop
yright
© AE&M all rights r
eser
ved.
the redox state in adipose tissue is a potentially useful therapeutic target for obesity-associated MetS. In addition, hydrogen peroxide impairs insulin signaling and inhibits glucose transport, two cardinal features of insulin resistance (27). On the other hand, insulin itself promotes hydrogen peroxide formation in human fat cells (4). Altogether, it is tempting to speculate that oxidative stress can be both cause and consequence of insulin resistance (16,28).
It has been suggested that AOPPs are an early marker of MetS and are the most appropriate parameter for the determination of oxidative stress in MetS patients (29). AOPPs are formed during oxidative stress through the action of chlorinated oxidants, mainly hypochlorous acid and chloramines, produced by myeloperoxidase in activated neutrophils (11). AOPPs are structurally similar to advanced glycation end products (AGEs) and exert similar biological activities to those of AGEs – i.e., induction of pro-inflammatory cytokines and adhesion molecules (11). The present study showing that AOPPs were associated with metabolic changes and hypertension is in line with the importance of protein oxidation in patients with these components of MetS, independent of BMI, and confirm our previous finding that protein oxidation is more related to MetS parameters than lipid oxidation (30). Of note, BMI does not participate in the definition of the MetS and does not have a robust association verified between WC and insulin resistance. Although some studies have reported an association between AOPPs and BMI (13,30), the current study only presented this finding when the groups were not adjusted for the presence of MetS.
Changes in NOx levels have been linked with disorders of metabolic and cardiovascular homeostasis that can culminate in obesity-induced IR and endothelial dysfunction. Serum NOx were shown to be increased in MetS and be associated with other metabolic components such as BP, BMI, waist-to-hip ratio, and fasting plasma glucose in cluster analyses (31). In addition to overproduced NO, reduced levels of NO may also be a risk factor for the development of cardiometabolic disease (32). Although endothelial dysfunction has been considered an important issue in patients with obesity, the results of studies on NOx levels have been contradictory. Whereas some reports have shown higher NO levels (33), others have found the opposite results, similarly to the present study (34). NO is synthesized in endothelial cells by
endothelial nitric oxide synthase (eNOS) activity, and it is responsible for vasodilatation and the maintenance of endothelial function; eNOS is expressed constitutively and synthesizes NO in only small amounts under basal conditions. In contrast, oxidative stress provokes inducible nitric oxide synthase (iNOS) expression even in low-grade inflammatory conditions, such as obesity, and consequently increases NO – which would be consumed in a reaction with superoxide anion, yielding peroxynitrite (35). This hypothesis is supported by some authors who demonstrated an increase in nitrotyrosine, a marker of endogenous peroxinitrite generation (36). Thus, the balance between eNOS and iNOS could explain NO increases or decreases in obese subjects. Although oxidative stress may induce NO production, the NO decrease associated with BMI found in the present study is probably related to higher NO consumption through oxidative stress, reducing NO bioavailability. Furthermore, previous investigations have shown that HDL induces a variety of signaling events – involving scavenger receptor B type I, cholesterol efflux and the stimulation of the phosphorylation of eNOS – that lead to the activation and increased expression of eNOS and the subsequent production of NO. Thus, the decreased NO levels in the present study may be related to the HDL cholesterol reduction (37,38).
Overweight is highly associated with arterial hypertension, independently from the occurrence of MetS, and a BMI of 25 kg/m2 or greater accounted for approximately 34% and 62% of hypertension in men and in women, respectively (35). NO plays a major role in regulating blood pressure, and its deficient bioactivity is an important component of hypertension (37). Hypertensive subjects have increased generation of ROS – which scavenge NO, thereby reducing NO bioavailability (23). This study confirms the well-established relationship between NO decreases and hypertension, independent of whether BMI is considered.
Cop
yright
© AE&M all rights r
eser
ved.
nitrosative stress would make our data more consistent. Nevertheless, the present study also has several strengths. First, to our knowledge, this is the first study to evaluate concomitantly oxidative and nitrosative stress in overweight and obese subjects. Second, we adjusted the results of oxidative stress measurements for the presence of MetS to evaluate its influence on the results.
In conclusion, only nitrosative stress was related to BMI, whereas protein oxidation was related to each component of MetS. In addition, both NO and advanced oxidative protein products were related to hypertension. In general, MetS components were essential participants in overweight and obese subjects, but hypertriacylglycerolemia was the parameter that showed the highest degree of redox imbalance. Although more studies are warranted to confirm the present data, this study reinforces the importance of concomitantly analyzing oxidative and nitrosative stress to obtain a more complete picture of overweight, obesity and associated conditions.
Disclosure: no potential conflict of interest relevant to this article was reported.
REFERENCES
1. Fernández-Sánchez A, Madrigal-Santillán E, Bautista M, Esquivel-Soto J, Morales-González A, Esquivel-Chirino C, et al. Inflamma-tion, oxidative stress, and obesity. Int J Mol Sci. 2011;12:3117-32. 2. Wang Y, Monteiro C, Popkin BM. Trends of obesity and
under-weight in older children and adolescents in the United States, Brazil, China, and Russia. Am J Clin Nutr. 2002;75:971-7. 3. Wildman RP, McGinn AP, Kim M, Muntner P, Wang D, Cohen HW,
et al. Empirical derivation to improve the definition of the Meta-bolic Syndrome in the evaluation of cardiovascular disease risk. Diabetes Care. 2011;34(3):746-8.
4. Ohmori K, Ebihara S, Kuriyama S, Ugajin T, Ogata M, Hozawa A, et al. The relationship between body mass index and plasma lipid peroxidation biomarker in an older, healthy Asian community. Ann Epidemiol. 2005;15:80-4.
5. Van Guilder GP, Hoetzer GL, Greiner JJ, Stauffer BL, Desouza CA. Influence of metabolic syndrome on biomarkers of oxidative stress and inflammation in obese adults. Obesity (Silver Spring). 2006;14:2127-31.
6. Ceriello A, Motz E. Is oxidative stress the pathogenic mechanism underlying insulin resistance, diabetes, and cardiovascular dis-ease? The common soil hypothesis revisited. Arterioscler Thromb Vasc Biol. 2004;24:816-23.
7. Singh VP, Aggarwal R, Singh S, Banik A, Ahmad T, Patnaik BR, et al. Metabolic syndrome is associated with increased oxo-nitrative stress and asthma-like changes in lungs. PLoS One. 2015;10(6):e0129850.
8. Venturini D, Simão ANC, Scripes NA, Bahls LD, Melo PA, Beli-netti FM, et al. Oxidative stress evaluation in overweight subjects with or without metabolic syndrome. Obesity (Silver Spring). 2012;20:2361-6.
9. Oliveira EP; Lima MD, Souza MLA. Síndrome metabólica, seus fenótipos e resistência à insulina pelo HOMA-RI. Arq Bras Endo-crinol Metab. 2007;51:1506-15.
10. Gonzalez Flecha B, Llesuy S, Boveris A. Hydroperoxide-initiated chemiluminescence: an assay for oxidative stress in biopsies of heart, liver, and muscle. Free Radic Biol Med. 1991;10:93-100. 11. Witko-Sarsat V, Friedlander M, Capeillère-Blandin C,
Nguyen-Khoa T, Nguyen AT, Zingraff J, et al. Advanced oxidation protein products as a novel marker of oxidative stress in uremia. Kidney Int. 1996;49:1304-13.
12. Repetto M, Reides C, Gomez Carretero ML, Costa M, Griemberg G, Llesuy S. Oxidative stress in blood of HIV infected patients. Clin Chim Acta. 1996;255:107-17.
13. Simão ANC, Dichi JB, Barbosa DS, Cecchini R, Dichi I. Influence of uric acid and gamma-glutamyltransferase on total antioxidant ca-pacity and oxidative stress in patients with metabolic syndrome. Nutrition. 2008;24:675-81.
14. Hu ML. Measurement of protein thiol groups and glutathione in plasma. In: Abelson JN, Simon MI, editors. Methods in enzymol-ogy. San Diego, CA: Academic Press; 1994. p. 380-2.
15. Navarro-Gonzálvez JA, García-Benayas C, Arenas J. Semiauto-mated measurement of nitrate in biological fluids. Clin Chem. 1998;44:679-81.
16. Simão ANC, Lovozoy MAB, Dichi I. Oxidative stress in overweight and obesity. In: Dichi I, Breganó JW, Simão ANC, Cecchini R (eds). Oxidative Stress in Chronic Diseases. Boca Raton: CRC Press; 2014. p. 121-36.
17. Skalicky J, Muzakova V, Kandar R, Meloun M, Rousar T, Palicka V. Evaluation of oxidative stress and inflammation in obese adults with metabolic syndrome. Clin Chem Lab Med. 2008;46:499-505. 18. Krzystek-Korpacka M, Patryn E, Boehm D, Berdowska I, Zielinski
B, Noczynska A. Advanced oxidation protein products (AOPPs) in juvenile overweight and obesity prior to and following weight reduction. Clin Biochem. 2008;41:943-9.
19. Fujita K, Nishizawa H, Funahashi T, Shimomura I, Shimabukuro M. Systemic oxidative stress is associated with visceral fat ac-cumulation and the metabolic syndrome. Circ J. 2006;70:1437-42. 20. Hansel B, Giral P, Nobecourt E, Chantepie S, Bruckert E, Chapman MJ, et al. Metabolic syndrome is associated with elevated oxida-tive stress and dysfunctional dense high-density lipoprotein par-ticles displaying impaired antioxidative activity. J Clin Endocrinol Metab. 2004;89:4963-71.
21. Barnard RJ, Roberts CK, Varon SM, Berger JJ. Diet-induced insu-lin resistance precedes other aspects of the metabolic syndrome. J Appl Physiol (1985). 1998;84(4):1311-5.
22. Simão ANC, Lozovoy MAB, Dichi I. Oxidative Stress in Metabolic Syndrome. Role of Oxidative Stress in Chronic Diseases, 1st ed., vol. 1. CRC Press; 2014. p. 246-59.
23. Simão ANC, Lozovoy MA, Bahls LD, Morimoto HK, Simão TN, Matsuo T, et al. Blood pressure decrease with ingestion of a soy product (kinako) or fish oil in women with metabolic syndrome: role of adiponectin and nitric oxide. Br J Nutr. 2012;108:1435-42. 24. Stern MP. Diabetes and cardiovascular disease. The “common
soil” hypothesis. Diabetes. 1995;44:369-74.
25. Kip KE, Marroquin OC, Kelley DE, Johnson BD, Kelsey SF, Shaw LJ, et al. Clinical importance of obesity versus the metabolic syndrome in cardiovascular risk in women. A report from the Women’s Ischemia Syndrome evaluation (WISE) Study. Circula-tion. 2004;109:706-13.
26. Furukawa S, Fujita T, Shimabukuro M, Iwaki M, Yamada Y, Naka-jima Y, et al. Increased oxidative stress in obesity and its impact on metabolic syndrome. J Clin Invest. 2004;114:1752-61. 27. Keaney JF Jr, Larson MG, Vasan RS, Wilson PW, Lipinska I, Corey
Cop
yright
© AE&M all rights r
eser
ved.
of oxidative stress in the Framingham Study. Arterioscler Thromb Vasc Biol. 2003;23:434-9.
28. Simão ANC, Lozovoy MA, Dichi I. Metabolic syndrome: new tar-gets for an old problem. Expert Opin Ther Tartar-gets. 2012;16:147-50.
29. Zurawska-Płaksej E, Grzebyk E, Marciniak D, Szymań
ska-Chabowska A, Piwowar A. Oxidatively modified forms of albumin in patients with risk factors of metabolic syndrome. J Endocrinol Invest. 2014;37:819-27.
30. Venturini D, Simão ANC, Dichi I. Advanced oxidation protein products are more related to metabolic syndrome components than biomarkers of lipid peroxidation. Nutr Res. 2015;35:759-65. 31. Zahedi Asl S, Ghasemi A, Azizi F. Serum nitric oxide metabolites in
subjects with metabolic syndrome. Clin Biochem. 2008;41:1342-7.
32. Bahadoran Z, Mirmiran P, Ghasemi A, Azizi F. Serum nitric oxide metabolites are associated with the risk of hypertriglyceridemic-waist phenotype in women: Tehran lipid and glucose study. Nitric Oxide. 2015;50:52-7.
33. Elizalde M, Rydén M, van Harmelen V, Eneroth P, Gyllenhammar H, Holm C, et al. Expression of nitric oxide synthases in subcuta-neous adipose tissue of nonobese and obese humans. J Lip Res. 2000;41:1244-51.
34. Esposito K, Ciotola M, Schisano B, Misso L, Giannetti G, Ceriello A, et al. Oxidative stress in the metabolic syndrome. J Endocrinol Invest. 2006;29:791-5.
35. Mineo C, Deguchi H, Griffin JH, Shaul PW. Endothelial and anti-thrombotic actions of HDL. Circ Res. 2006;98:1352-64.
36. Wilson PW, D’Agostino RB, Sullivan L, Parise H, Kannel WB. Over-weight and obesity as determinants of cardiovascular risk: the Framingham experience. Arch Intern Med. 2002;162:1867-72. 37. Hermann M, Flammer A, Lüscher TF. Nitric oxide in hypertension.
J Clin Hypertens (Greenwich). 2006;8:17-29.