Printed version ISSN 0001-3765 / Online version ISSN 1678-2690 http://dx.doi.org/10.1590/0001-3765201720150611
www.scielo.br/aabc | www.fb.com/aabcjournal
Evaluation of cell proliferation and endometrial thickness
of bitches in different periods of diestrus
VANESSA S.A. GOSSLER1
, FRANCISLAINE A.G. SANTOS2
, ALINE R. DE AZEVEDO1
, PRISCILA C. GONÇALVES1, HUGO A. RIGOLO1, CLEONICE TREVISAN1, ANA PAULA B. MASSENO3, ANA
PAULA M.M. CARDOSO1
, PAULA C. PAPA2
, CALIÊ CASTILHO1
and INES C. GIOMETTI1
1
Faculdade de Ciências Agrárias, Universidade do Oeste Paulista/UNOESTE, Campus II, Rod. Raposo Tavares, Km 572, Limoeiro, 19067-175 Presidente Prudente, SP, Brazil 2
Setor de Anatomia, Departamento de Cirurgia, Faculdade de Medicina Veterinária e Zootecnia, Universidade de São Paulo/USP, Av. Prof. Dr. Orlando Marques Paiva, 87, 05508-270 São Paulo, SP, Brazil 3
Faculdade de Ensino Superior e Formação Integral/FAEF, Rodovia Comandante João Ribeiro de Barros, Km 420, Campus Rosa Dourada, 17400-000 Garça, SP, Brazil
Manuscript received on September 3, 2015; accepted for publication on April 15, 2016
ABSTRACT
This study aimed to determine the histological features of the endometrium of bitches, as well as the cell
proliferation at specific moments of diestrus, 10, 20, 30, 40, 50 and 60 days post ovulation, correlating the
endometrial thickness with the uterine cell proliferation and the metabolic state (weight, blood glucose and plasma cholesterol) of the animals. Therefore, the right and left uterine horns of 26 clinically healthy bitches submitted to ovariohysterectomy were histologically analyzed 10, 20, 30, 40, 50 and 60 days post ovulation. The hematoxylin-eosin and AgNOR staining techniques were performed. All parameters were evaluated by ANOVA and post-hoc Tukey test (p<0.05). The correlation between endometrial thickness and uterine cell proliferation, weight, blood glucose and plasma cholesterol of animals was observed using
the Pearson method (p<0.05). In the present study, it is concluded that endometrial thickness does not differ at any of the moments analyzed in diestrus. The endometrial thickness is not influenced by hormones,
weight, blood glucose or serum cholesterol of bitches in this phase of the estrous cycle. However, there is greater cell proliferation in the endometrium at day 40 compared to day 60 post ovulation under the
influence of the endocrine profile.
Key words: AgNOR, dogs, hematoxylin-eosin, uterus.
Correspondence to: Ines Cristina Giometti
E-mail: [email protected] INTRODUCTION
The phases of the canine estrous cycle are divided
into anestrus, proestrus, estrus and diestrus. The
end of the characteristic behavior of estrus marks the beginning of diestrus. This luteal phase in bitchesis longer than other animals, which lasts about 55 to 75 days and average 65 days (Concannon 2011), reason of the choice of this phase for this study.
The diestrus phase in bitches is characterized
by increases in progesterone (P4) in the first half and fluctuations in estradiol (E2) in the second half.
in the peripheral blood (30-35 ng/ml) occurs between the 15th and 25th day post ovulation and then gradually decreases to levels <1 ng/ml (Concannon 1993, Hoffmann et al. 2004). E2 presents variable concentrations and intermediate values from 15 to 30 pg/ ml, which are highest in the middle of diestrus, around day 40, after which
they decline (Concannon 2009, Papa and Hoffmann
2011).
The endocrine hormonal changes mark
different moments in diestrus, well characterized by
Fonseca et al. (2012), in which there is a moderate concentration of E2 and P4 at 10 days post ovulation with a gradual increase of both hormones since this moment. As a consequence of this gradual increase, the peak of P4 occurs at 20 days followed by its decline. At 30 days, P4 production is moderate and E2 is increasing (Fonseca et al. 2012). At 40 days, there is the highest concentration of E2 after estrus, with decreasing level of P4. The 50 days are marked by a gradual decrease of E2 and P4, culminating with low concentrations of both 60 days (Fonseca et al. 2012). No studies were found in the literature that characterized the endometrial thickness and uterine cell proliferation in each of these moments of hormonal change after estrus.
During the estrous cycle, the endometrium of the bitch undergoes morphological and biochemical alterations that are associated with proliferation,
apoptosis and cellular differentiation (Cruz 2011), these alterations are under the influence of P4 and
E2 (De Bosschere et al. 2001). The endometrium/ myometrium ratio is high in the proestrus, due to edema and hyperplasia of the endometrium, this ratio decreases strongly in the estrus and then during diestrus a slight increase is observed (De Bosschere et al. 2001).
In early diestrus (12 -42 days), apoptosis was demonstrated through TUNEL staining; in the basal glandular epithelial cells and endothelial cells
of blood capillaries; in very few of the superficial
glandular epithelial cells and stromal cells; and not
in the luminal epithelial cells, coinciding with the
plasma progesterone profile (Chu et al. 2006).
De Bosschere et al. (2002) demonstrated in their study that cystic endometrial hyperplasia-mucometra is associated with a higher score
of the estrogen-α receptor and progesterone
receptor in bitches in diestrus. In normal canines,
P4 causes a down regulation of the estrogen-α
receptor (Vermeirsch et al. 1999). However, in bitches with cystic endometrial hyperplasia this mechanism fails to reduce the expression of the estrogen receptor and, as a consequence, there is proliferation of endometrial glands even with low levels of estrogen (De Cock et al. 1997). Closed pyometra was associated with a higher expression of progesterone receptor in bitches in diestrus (Volpato et al. 2012).
Although some studies in bitches report endometrial histological alterations at different moments of the cycle and pathological or hormone induced alterations, no studies were found relating
the specific phases of the major hormonal alterations
of E2 and P4 during diestrus, described by Fonseca et al. (2012) and Concannon (2011), with the morphological and physiological characteristics of the endometrium and its cell proliferation. Knowledge about the morphological changes and proliferation of endometrial cells during the diestrus phase in bitches is important to better comprehend the physiology and endocrinology of canines. Moreover, this knowledge could improve the reproductive biotechnologies and indicate the best moment to manipulate these female animals.
In a study by Monteiro et al. (2009), it was
verified that in nulliparous and multiparous bitches,
The objective of this study was to determine the histological characteristics of the endometrium in bitches, as well as the cell proliferation at
specific moments of diestrus, 10, 20, 30, 40, 50 and
60 days post ovulation, correlating the endometrial thickness with the uterine cell proliferation and the metabolic state (weight, blood glucose and plasma cholesterol) of the animals. This aim tests the hypothesis that cell proliferation of the endometrium of bitches varies during the diestrus phase.
MATERIALS AND METHODS
This study was approved by the Institutional Ethics Committee on Animal Use (CEUA) (protocol number: 2265). In this study, the right and left uterine horns of 26 clinically healthy bitches of different ages and with no defined breed were analyzed histologically. However, the dogs had similar body condition scores of 3 to 6, according to the description of dog scores by Laflamme
(2006) and no significant average age difference was observed between the different groups.
The uteri (two uterine horns) of the bitches were obtained by elective ovarysalpingohysterectomy (OSH) surgery in private practice, 10 (n=10), 20 (n=8), 30 (n=8), 40 (n=8), 50 (n=8) and 60 days (n=10) after ovulation, thus forming the six sample groups in the present study. To establish the exact moment of ovulation, the bitches were monitored prior to setting the day for OSH surgery. The monitoring occurred through serial blood sampling, every other day, after the onset of signs of estrus, for serum dosage of P4. Ovulation day (day 0)
was defined as the day that the concentration of
peripheral P4 was 5 ng/ml (Concannon et al. 1989).
The anesthetic protocol used for carrying out the OSH was pre-anesthetic medication with acepromazine 0.05 mg/kg + tramadol 2 mg/kg, intramuscularly, induction with ketamine 0.1mg/
kg + diazepam 0.5 mg/kg + propofol 3 mg/kg
intravenously and maintained with isoflurane, via
inhalation.
The surgical procedures were performed through incisions large enough to manipulate the ovaries and cervix, in the ventral midline, from the caudal to the umbilical scar, exposing the abdominal cavity. The uterine horn was retracted to the rupture of the suspensory ligament, allowing the externalization of the ovary. After ligation of the ovarian pedicles, the pedicles were cross-sectioned to release the ovaries. Cranial traction was applied to the uterus and the uterine body was sutured cranial to the cervix, promoting the transection of the uterine body and removal of the uterus with the fallopian tubes and ovaries. The uterine stump was replaced in the abdomen, and the abdominal wall closed in three layers (fascia/ linea alba, subcutaneous tissue and skin).
On the day of the OSH, after 8 hours of fasting, the bitches were weighed and blood was collected by cephalic venipuncture, in tubes without anticoagulant for measuring the cholesterol and
in tubes containing EDTA and potassium fluoride
for measuring the glucose. In the laboratory, the blood samples were centrifuged at 3000 rpm for 10 min. The total cholesterol was determined in the serum and the plasma was used for determination of glucose. Biochemical analyzes were performed through spectrophotometry using the system CobasC111®, manufacturer Roche Diagnostics Ltd, Switzerland, via enzymatic-colorimetric assay kits from the same equipment.
The uterine horns were harvested and stored in Davidson solution and after 24 hours, washed in water and stored in 75º alcohol until the inclusion
of samples in paraffin. After embedding in paraffin, 5μm thick cuts were obtained and slides were
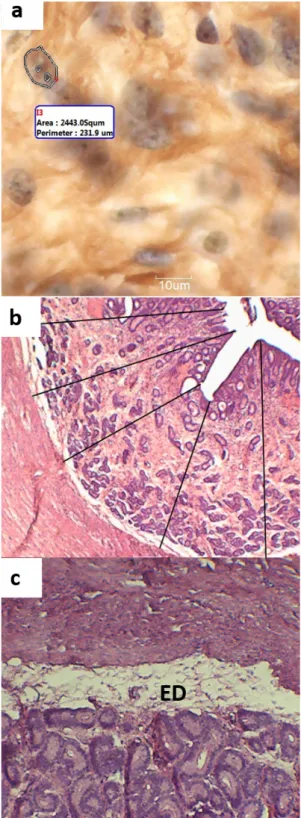
to hematoxylin-eosin staining. Subsequently they were photographed using a camera attached to an optical microscope at an objective of 4x. The endometrial thickness of the bitches was assessed using the average of 20 endometrial height measurements per slide using the software MOTIC Imageplus 2.0® (Figure 2b).
Staining using the AgNOR method was also performed (“Argyrophilic Nuclear Organizer Regions”); a slide was made for the right and left
horns of each dog. The slides were deparaffinized,
hydrated in deionized water and subsequently placed in a 2% gelatin and 1% formic acid solution in deionized water and 50% silver nitrate solution at a ratio of 1:2. The slides were immersed in this solution for 45 minutes in an oven at 37°C. Next, they were washed in deionized water for 1 minute, dehydrated, clarified and mounted with synthetic resin (Kravis et al. 1996, Simoes et al.
1994, Vajdovich et al. 2004). To define the area
of AgNOR, the slides were photographed using a camera attached to the optical microscope at 100x objective with the help of immersion oil. The areas of nucleolar organizer regions (NORs), stained with silver nitrate and visualized in brownish tones, were
labeled and quantified using the software MOTIC Imageplus 2.0®, in ten different fields on each slide; 10 nuclei were measured in each field. This method
constitutes a resource to analyze cell proliferation, since the stained structures are related to the level of nuclear and cellular activity. In proliferating cells, the number of NORs increases, permitting a relationship between the area of NORs and cell proliferation (Crocker 1996, Derenzini 2000).
All parameters were evaluated using the Shapiro-Wilk normality presupposition, considering data normal when p>0.01. The samples were then subjected to ANOVA followed by Tukey test (p<0.05). The correlation between endometrial thickness and uterine cell proliferation, weight, blood glucose and plasma cholesterol of animals
was verified using the Pearson method (p <0.05).
The software used was BioEstat® version 5.0.
RESULTS AND DISCUSSION
Diestrus is the period of the estrous cycle in which the endometrium reaches its greatest thickness and cell density (Cruz 2011, Rehm et al. 2007), and the endometrium is at its thickest at the start of diestrus (Cruz 2011). In the present study, only the
diestrus was evaluated and no statistical differences were found in endometrial thickness at different
moments of diestrus, 10, 20, 30, 40, 50 and 60 days after ovulation (Figure 1 and Figure 2b). This
difference between studies is due to the fact that the first measurement of the endometrium in the
present study was on the 10th day of ovulation and the difference found by Cruz (2011) was in the early days of diestrus, days 0 to 10; none of the bitches in the present study were within this period.
As the endometrial thickness was not significantly different between the groups, a correlation analysis was performed between endometrial thickness and the weight of the animals, blood glucose and plasma cholesterol. No correlation was found between the body weight, blood glucose or plasma cholesterol and endometrial thickness (Table I).
1999, Kim et al. 2003). The metabolic status of the animal acts on endocrinology and reproduction, so this study examined the concentration of blood glucose and cholesterol at the time of OSH. However, all animals of this experiment were normoglycemic (90.89 ± 23.67 mg/dL) and had normal serum cholesterol concentration (223.69 ± 56.15 mg/dL) and these data were not correlated with the endometrium thickness.
It was expected that different hormone concentrations at 10, 20, 30, 40, 50 and 60 days could change the thickness of the endometrium,
TABLE I
Pearson correlation coefficient (r) for association between endometrial thickness and body weight (n = 24), blood glucose (n = 23) and plasma cholesterol (n = 23) of bitches,
average area of nucleolar organizer regions - NORs
(n=24) and number of NORs (n=24), data estimated by point and interval with 95% confidence (CI95%) and statistical significance (p) of the t test, Presidente
Prudente, 2014.
Endometrial thickness (μm)
r IC 95% p
Body weight (Kg) 0.1693 -0.25 a 0.54 0.4291 Glucose (mg/dL) -0.2026 -0.57 a 0.23 0.3537 Total cholesterol (mg/dL) 0.1606 -0.27 a 0.54 0.4642
Area of NORs (μm) -0.0181 -0.40 a 0.37 0.9301
Number of NORs -0.2045 -0.55 a 0.20 0.3162
Figure 1 - Mean and standard error of the endometrial
thickness (μm) of the uterine horns in bitches of different
groups: 10 (n=10); 20 (n=8); 30 (n=8); 40 (n=8); 50 (n=6); and 60 (n=10) days post ovulation, p>0.05.
appearance and the nuclei of epithelial cells of the
crypts weakly basophilic. Edema was verified in all
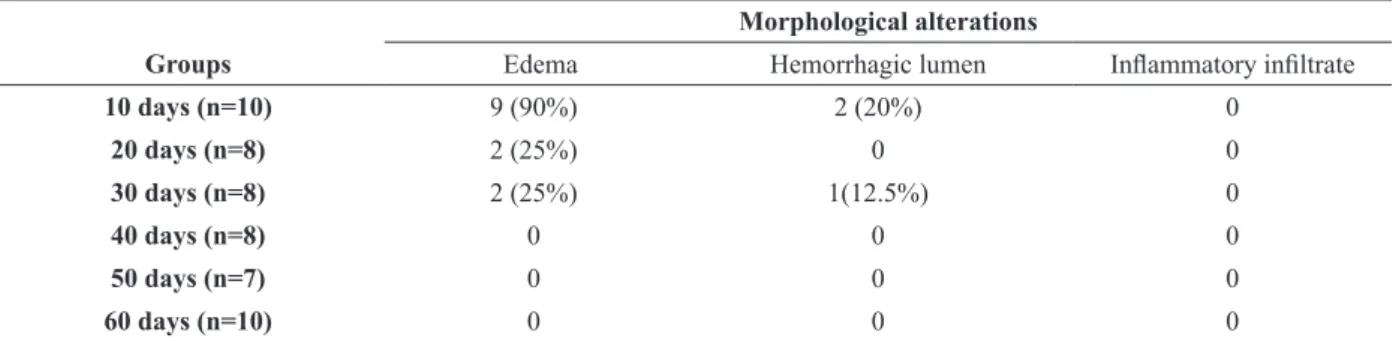
the bitches at 10 days post ovulation, either mild (n = 4) or severe (n = 1) with hemorrhagic lumen. Only one of them did not present edema in both uterine horns (Table II). This result is consistent with that described in the literature which states that in early diestrus there is still edema characteristic of proestrus and estrus which reduces with the advancing diestrus phase (Chandra and Adler 2008, Rehm et al. 2007). In the other periods evaluated, the percentage of horns presenting edema was well below that of the 10 days post ovulation group. Therefore, we can assume that the higher percentage of uterine horns with edema in the group evaluated at 10 days after ovulation was due to the proximity of this period to the estrus period.
No bitch presented edema at 40 to 60 days post ovulation. Therefore, the best period for performing OSH in dogs is during the diestrus (after day 40 post ovulation) as the occurrence of edema in the uterine horn and blood vasculature is lower in this phase, decreasing the risk to the patient.
As for cell proliferation analyzed by the number of NORs (nucleolus organizer regions),
the results were statistically significant (p <0.05)
in the bitches undergoing OSH at 40 and 60 days
after ovulation. There was no statistical difference
between these periods and the others evaluated. Cell proliferation was greater at 40 days than at 60 days after ovulation (Figure 3 and Figure 4). There was no correlation between the number of NORs and the endometrial thickness in the bitches (p> 0.05); the results are presented in Table I.
The number and area of NORs represent parameters that reflect the level of proliferative activity of cells (Santos et al. 2011). Santos et al. (2011), in a study on canine transmissible venereal tumor (TVT), demonstrated that the greater the number of small NORs, the greater the proliferative activity of cells, with tumors in the growth phase but this was not observed in the present study. The
diestrus phase in dogs is characterized by increases
in P4 in the first half and fluctuations in E2 in the
second half. During the pre-ovulatory phase, the E2 reaches peaks of very high concentrations, but after ovulation a rapid fall occurs in this concentration which then turns, rising from the 25th day post ovulation, peaking at 45 days (Fonseca et al. 2012). E2 presents varying concentrations and intermediate values from 15 to 30 pg/mL, being found at concentrations of approximately 12 pg/ mL 10 days after ovulation and rising to 40 days, after which it begins to show a decline, returning to the concentration of the 10th day 60 days post ovulation (Concannon 2009, Fonseca et al. 2012,
Papa and Hoffmann 2011).
The highest plasmatic concentrations of P4 (30 to 35 ng/mL) are found in the first half
of diestrus, specifically between 11 and 30 days
after ovulation, peaking at 20 days post ovulation (Concannon 1993, Cruz 2011, Fonseca et al. 2012,
Hoffmann et al. 2004). At 30 days, P4 is found at
a concentration of 5 ng/mL (equal to 10 days post ovulation) and the concentration continues to fall in the following days due to the regression of the corpus luteum, until returning to baseline (<0.5 ng/ mL) in anestrus (Cruz 2011, Fonseca et al. 2012). Despite the well-marked alterations in hormonal plasmatic concentrations in the days analyzed in the
present study, this was not reflected in a difference
in endometrial thickness.
The production of P4 of a follicular origin begins at the end of proestrus before ovulation, reaching peripheral plasma levels of approximately 5ng/mL at the time of ovulation (Concannon et al. 1989).
demonstrating a higher average number of NORs within the nucleus, than regressive TVTs.
In a study of granulosa cells of secondary follicles in rats, Silva et al. (2003) observed that in the secondary follicles with two to three layers
of granulosa cells, the NORs were large and present in low numbers. In the more developed secondary follicles with greater cell proliferation,
the granulosa cells presented generally small NORs, dispersed throughout the nucleus and in
significantly higher numbers, thus demonstrating
TABLE II
Classifications of morphological alterations found in the endometrium of bitches 10, 20, 30, 40, 50 and 60 days post ovulation. The presented values correspond to the numerical value (percentage) of uterine horns in which morphological
alterations in histology staining with hematoxylin-eosin were found. Morphological alterations
Groups Edema Hemorrhagic lumen Inflammatory infiltrate
10 days (n=10) 9 (90%) 2 (20%) 0
20 days (n=8) 2 (25%) 0 0
30 days (n=8) 2 (25%) 1(12.5%) 0
40 days (n=8) 0 0 0
50 days (n=7) 0 0 0
60 days (n=10) 0 0 0
Data were presented by frequency of morphological alterations; no statistical analysis was realized.
Figure 3 - Mean and standard error of the number of nucleolar organizer regions (NORs), the largest numbers of NORs are indicative of greater cell proliferation of the endometrium of the horns of the bitches at 10 (n=10), 20 (n=7), 30 (n=8), 40
(n=8), 50 (n=6) and 60 (n=9) days post ovulation. Different letters indicate statistically significant differences (p <0.05).
Figure 4 - Mean and standard error of the ratio between the total areas of the cell nuclei and the total areas of the nucleolus organizer regions (NORs), higher ratios are indicative of greater cell proliferation of the endometrium of the horns of the bitches at 10 (n=10), 20 (n=7), 30 (n=8), 40 (n=8), 50 (n=6)
and 60 (n=9) days post ovulation. Different letters indicate statistically significant differences (p <0.05).
that NORs with larger areas and low quantities indicate less cellular proliferation, while smaller
NORs in greater quantities indicate increased cell proliferation.
As E2 is responsible for cell proliferation in
the endometrial cells (Van Cruchten et al. 2004), a positive correlation can be established between E2 levels and cell proliferation; the periods in
al. 2012, Papa and Hoffmann 2011). In the period
in which the lowest proliferation occurs, at 60 days after ovulation, the lowest production of E2 throughout the diestrus period also occurs. Van Cruchten et al. (2004) described similar results in
his study, where cell proliferation in the superficial
epithelium, stroma, blood vessels and crypts of the uterus was positively correlated with E2 levels in
different phases of the canine estrous cycle.
An increase in the number of epithelial cells in proliferation was observed in cultures of endometrial cells treated with estradiol, as an increased expression of estrogen receptors was verified by immunohistochemistry analysis of cultures stimulated by E2, associated with an increased number of proliferating cells (Cruz 2011, Vermeirsch et al. 1999).
It is concluded in the present study that
endometrial thickness does not differ at any of the
moments analyzed in diestrus. The endometrial
thickness is not influenced by hormones, weight,
blood glucose or serum cholesterol of bitches in this phase of the estrous cycle. However, there is greater cell proliferation in the endometrium at day 40 compared to day 60 post ovulation under the
influence of the endocrine profile.
ACKNOWLEDGMENTS
The authors would like to thank the Universidade
do Oeste Paulista (UNOESTE) for their financial
support in the form of materials and PROBIC grants
for Scientific Initiation as well as all the structural
support provided during the study.
REFERENCES
CHANDRA SA AND ADLER RR. 2008. Frequency of different estrous stages in purpose-bred beagles: a retrospective study. Toxicol Pathol 36: 944-949.
C H U P Y, L E E C S A N D W R I G H T P J . 2 0 0 6 . Degeneration and apoptosis of endometrial cells in the bitch. Theriogenology 66: 1545-1549.
CONCANNON PW. 1993. Biology of gonadotrophin secretion in adult and prepubertal female dogs. J Reprod Fertil Suppl 47: 3-27.
CONCANNON PW. 2009. Endocrinologic control of normal canine ovarian function. Reprod Domest Anim 2: 3-15. CONCANNON PW. 2011. Reproductive cycles of the
domestic bitch. Anim Reprod Sci 124: 200-210.
CONCANNON PW, MCCANN JP AND TEMPLE M. 1989. Biology and endocrinology of ovulation, pregnancy and parturition in the dog. J Reprod Fertil Suppl 39: 3-25. CROCKER J. 1996. Molecular and biochemical aspects of
interphase nucleolar organiser regions. Clin Mol Pathol 49: M8-M11.
CRUZ SAF. 2011. Proliferação e apoptose celular no endométrio da cadela. Dissertação de Mestrado. Universidade Técnica de Lisboa, Faculdade de Medicina Veterinária, Lisboa, 71 p. (Unpublished).
DE BOSSCHERE H, DUCATELLE R, VERMEIRSCH H, SIMOENS P AND CORYN M. 2002. Estrogen-alpha and progesterone receptor expression in cystic endometrial hyperplasia and pyometra in the bitch. Anim Reprod Sci 70: 251-259.
DE BOSSCHERE H, DUCATELLE R, VERMEIRSCH H, VAN DEN BROECK W AND CORYN M. 2001. Cystic endometrial hyperplasia-pyometra complex in the bitch: should the two entities be disconnected? Theriogenology 55: 1509-1519.
DE COCK H, VERMEIRSCH H, DUCATELLE R AND DE SCHEPPER J. 1997. Immunohistochemical analysis of estrogen receptors in cystic-endometritis–pyometra complex in the bitch. Theriogenology 48: 1035-1047. DERENZINI M. 2000. The AgNORs. Micron 31: 117-120. FONSECA VU, PAPA PC AND CAMPOS DB. 2012.
Potencial envolvimento da adiponectina e seus receptores na modulação da esteroidogênese em corpo lúteo de cadelas ao longo do diestro. Pesq Vet Bras 32: 1055-1060. HOENIG M, ALEXANDER S, HOLSON J AND FERGUSON DC. 2002. Influence of glucose dosage on interpretation of intravenous glucose tolerance tests in lean and obese cats. J Vet Intern Med 16: 529-532.
HOFFMANN B, BÜSGES F, ENGEL E, KOWALEWSKI MP AND PAPA P. 2004. Regulation of corpus luteum-function in the bitch. Reprod Domest Anim 39: 232-240.
JEUSETTE IC, LHOEST ET, ISTASSE LP AND DIEZ MO. 2005. Influence of obesity on plasma lipid and lipoprotein concentrations in dogs. Am J Vet Res 66: 81-86.
KAIYALA KJ, PRIGEON RL, KAHN SE, WOODS SC, PORTE D AND SCHWARTZ MW. 1999. Reduced beta-cell function contributes to impaired glucose tolerance in dogs made obese by high-fat feeding. Am J Physiol 277: E659-E667.
Resistance in the Development of the Metabolic Syndrome Induced by an Isocaloric Moderate-Fat Diet in the Dog. Diabetes 52: 2453-2460.
KRAVIS LD, VAIL DM, KISSEBERTH WC, OGILVIE GK AND VOLK LM. 1996. Frequency of argyrophilic nucleolar organizer regions in fine-needle aspirates and biopsy specimens from mast cell tumors in dogs. J Am Vet Med Assoc 209: 1418-1420.
LAFLAMME DP. 2006. Understanding and Managing Obesity in Dogs and Cats. Veterinary Clinics of North America - Small Animal Practice, Vet Clin North Am Small Anim Pract 36: 1283-1295.
MONTEIRO CMR, PERRI SHV, CARVALHO RG AND KOIVISTO MB. 2009. Histologia e morfometria em cornos uterinos de cadelas nulíparas, multíparas e tratadas com contraceptivos. Pesq Vet Bras 29: 847-851.
PAPA PC AND HOFFMANN B. 2011. The Corpus Luteum of the Dog: Source and Target of Steroid Hormones? Reprod Domest Anim 46: 750-756.
REHM S, STANISLAUS DJ AND WILLIAMS AM. 2007. Estrous cycle-dependent histology and review of sex steroid receptor expression in dog reproductive tissues and mammary gland and associated hormone levels. Birth Defects Res B Dev Reprod Toxicol 80: 233-245.
SANTOS FGA, MORO L, CASSALI GD, PAIXÃO TA, CAMPOS PP, SILVA SS AND VASCONCELOS AC. 2011. Cell proliferation markers in the transplanted canine transmissible venereal tumor. Arq Bras Med Vet Zootec 63: 1345-1352.
SILVA CM, SERAKIDES R, NASCIMENTO EF, NUNES VA, RIBEIRO AFC AND OCARINA NM. 2003.
Quantificação das regiões organizadoras de nucléolo (NORs) como parâmetro para avaliar a proliferação das células da granulosa. Arq Bras Med Vet Zootec 55: 113-116.
SIMOES JPC, SCHONING P AND BUTINE M. 1994. Prognosis of Canine Mast Cell Tumors: A Comparison of Three Methods. Vet Pathol 31: 637-647.
VAJDOVICH P, PSÁDER R, TÓTH ZA AND PERGE E. 2004. Use of the argyrophilic nucleolar region method for cytologic and histologic examination of the lymph nodes in dogs. Vet Pathol 41: 338-345.
VA N C R U C H T E N S , VA N D E N B R O E C K W, D’HAESELEER M AND SIMOENS P. 2004. Proliferation patterns in the canine endometrium during the estrous cycle. Theriogenology 62: 631-641.
VERMEIRSCH H, SIMOENS P, LAUWERS H AND CORYN M. 1999. Immunohistochemical detection of estrogen receptors in the canine uterus and their relation to sex steroid hormone levels. Theriogenology 51: 729-743. VERWAERDE P, SÉNARD JM, GALINIER M, ROUGÉ
P, MASSABUAU P, GALITZKY J, BERLAN M, LAFONTAN M AND MONTASTRUC JL. 1999. Changes in short-term variability of blood pressure and heart rate during the development of obesity-associated hypertension in high-fat fed dogs. J Hypertens 17: 1135-1143.