Maria João Andrade Correia
Licenciada em Bioquímica
S
-thiolated protein profile to assess the
redox-modulation effects of
antiretroviral drugs
Dissertação para obtenção do Grau de Mestre em
Genética Molecular e Biomedicina
Orientador: Sofia de Azeredo Pereira, Professora Auxiliar
NOVA Medical School, UNL
Co-orientador: Lucília Neves Diogo, Professora
Auxiliar Convidada, NOVA Medical School, UNL
Júri:
Presidente: Prof. Doutora Ilda Maria Barros dos Santos Gomes Sanches
Arguente: Prof. Doutora Sónia Alexandra Teixeira Fraga
Vogal: Prof. Doutora Sofia de Azeredo Gaspar Pereira
iii S-thiolated protein plasma profile to assess the redox-modulation effects of antiretroviral drugs
Copyright Maria João Andrade Correia, FCT/UNL, UNL
v The results discussed in this thesis originated:
Publications in international scientific journals:
2016 Grilo NM, Correia MJ, Sequeira C, Harjivan SG, Caixas U, Diogo LN, Marques MM,
Monteiro EC, Antunes AMM, Pereira SA. Efavirenz biotransformation as an up-stream event of mood changes in HIV-infected patients. Toxicol Lett 260:28-35
2016 Grilo NM, Correia MJ, Miranda J, Cipriano M, Serpa J, Marques MM, Monteiro EC,
Antunes AMM, Diogo LN, Pereira SA. Unmasking efavirenz neurotoxicity: time matters for its underling mechanism. (submitted)
Oral communications in national meetings:
2016 Correia MJ, Diogo LN, Pereira SA. New insights on the mechanism of
Efavirenz-induced neurotocixity. Jornadas Intercalares das Dissertações Anuais dos Mestrados. Faculdade de Ciências e Tecnologia – Universidade Nova de Lisboa, Lisboa, Portugal.
2016 Grilo NM, Correia MJ, Sequeira C, Harjivan SG, Caixas U, Marques MM, Monteiro
EC, Antunes AMM, Pereira SA. Efavirenz biotransformation at the onset of mood changes in HIV-infected male patients. XLVI Reunião Anual da Sociedade Portuguesa de Farmacologia/ XXXIV Reunião de Farmacologia Clínica/ XIV Reunião de Toxicologia, Porto, Portugal.
International conferences proceendings:
2016 Correia MJ, Dias CG, Caixas U, Grilo NM, Lemos AR, Trigo D, Pacheco P, Monteiro
EC, Soto K, Diogo LN, Pereira SA. S-protein thiol-omics to assess the redox-modulation effects of antiretroviral drugs. HIV Drug Therapy Glasgow Congress 2016 (in press)
2016 Grilo NM, Correia MJ, Sequeira C, Harjivan SG, Caixas U, Diogo LN, Marques MM,
vii
Acknowledgment
A realização deste trabalho não teria sido possível sem a contribuição de inúmeras pessoas a quem aqui expresso o meu sincero agradecimento.
À Professora Doutora Sofia de Azeredo Pereira e à Professora Doutora Lucília Diogo por me terem apresentado ao grandioso mundo da investigação, pela motivação e voto de confiança que depositaram em mim ao longo deste último ano. Agradeço ainda pela partilha de conhecimento, pela amizade, pelo apoio e acompanhamento permanente ao longo deste projecto.
Gostaria também de agradecer à Professora Doutora Emília Monteiro por ter permitido a minha integração no Departamento de Farmacologia, pela receptibilidade e simpatia.
À Professora Doutora Matilde Marques e à Professora Doutora Alexandra Antunes por toda a disponibilidade em transmitirem preciosos conhecimentos.
Não posso deixar de agradecer ao grupo do Laboratório de Farmacologia pela forma calorosa como me receberam, pelo companheirismo e entreajuda. À Nádia, a minha
“co-co-orientadora” e mentora da parte animal, um muito obrigada pela partilha de conhecimentos, pela boa disposição, pelo ânimo incutido nos momentos mais difíceis e pela amizade. À Clara, minha mentora da estatística, pela ajuda e paciência, pela amizade e boa disposição. À Rita (Sis) pelo companheirismo, pela ajuda e pelos momentos de brincadeira. Ao Nuno, aquele que tem como principal hobbie tirar-me do sério mas que está sempre pronto a
ajudar. À Catarina, a “faz tudo” no laboratório, um muito obrigada pelos ensinamentos, pela ajuda
e simpatia sempre demonstrados. À Joana e à Bernardete pelos bons momentos passados no biotério.
A todos os meus amigos, em especial à Silvy Alves, Emanuel Sousa, Inês Vilaça, Alexandre Sousa e Filipa Rito que apesar da distância se mantiveram sempre presentes. Obrigada pela amizade, pelos incentivos, pela força transmitida. À Sara Pestana, um obrigada pelas tardes passadas de volta da escrita da tese.
ix
Abstract
Efavirenz (EFV) is an anti-HIV drug that has been associated to neurotoxicity. The 8-hydroxy-efavirenz metabolite has been described as the responsible for its long-term neurotoxic effects. Upon bioactivation this metabolite is able to generate electrophilic species, forming protein adducts and eliciting oxidative stress. S-thiolation of proteins (e.g. S-glutathionylation) has
been suggested as a mechanism of protein regulation by the redox status. The present study is aimed to investigate if S-thiolated proteins plasma profile (RSSP) is associated with
EFV-neurotoxicity.
The RSSP was assessed in an animal model of EFV-induced neurotoxicity. The animal RSSP was compared to the one obtained in a cohort of HIV-infected patients on EFV. The dependence on 8-hydroxy-efavirenz generation and the influence of infection in RSSP profile were also assessed in the clinical study. This profile was also compared to the one obtained in patients on nevirapine (NVP), a non-neurotoxic antiretroviral of the same class of EFV.
The same RSSP was found in animal model and patients on EFV. This profile is characterized by increased S-glutathionylation and decreased S-cysteinylation of proteins. This
is mainly observed in patients that form higher 8-hydroxy-efavirenz, which is in accordance with higher risk of neurotoxicity. RSSP of patients on NVP was the opposite of the one observed for EFV. This might explain why EFV is mostly metabolized by liver, but is barely hepatotoxic. No influence of HIV-infection in RSSP was found.
Summing up, we conclude that RSSP profile might be associated with EFV-induced neurotoxicity, suggesting that it is a suitable tool for therapeutic drug monitoring aimed at managing toxic events. Moreover, as EFV and NVP presented a different RSSP signature, this tool might be used for assessing antiretroviral redox-modulation effects and quantification of drug-induced oxidative stress. This knowledge might have important implications for toxicity risk assessment, antiretroviral prescription and drug development
.
Keywords: efavirenz, neutoxicity, nevirapine, S-glutathionylation, S-thiolated proteins, oxidative
xi
Resumo
O efavirenz (EFV) é um fármaco antiretroviral, comummente usado na infecção por VIH, e cuja neurotoxicidade associada se encontra convenientemente documentada. Em concreto, o seu metabolito, 8-hidroxi-efavirenz, tem sido descrito como sendo responsável pelos seus efeitos neurotóxicos a longo prazo. Após bioactivação, este metabolito gera espécies electrofílicas, formando aductos de proteína e originando stress oxidativo. A S-tiolação de proteínas, de que é
exemplo a S-glutationização, tem sido sugerida como um importante mecanismo de regulação
de proteínas pelo estado redox. Com o presente estudo pretende-se investigar se o perfil
plasmático das proteínas S-tioladas (PSSR) está associado com a neurotoxicidade associada ao
EFV.
O perfil acima mencionado (PSSR) foi avaliado num modelo animal de neurotoxicidade induzida pelo EFV e, posteriormente, comparado com o perfil obtido num estudo de coorte de doentes infectados por VIH e tratados com EFV. O impacto da produção de 8-hidroxi-efavirenz, bem como, a influência da infecção no perfil PSSR foram também objeto de análise neste estudo clínico. Adicionalmente, este perfil plasmático foi comparado com o perfil obtido em doentes tratados com nevirapina (NVP), um antiretroviral da mesma classe do EFV, ao qual não é atribuído potencial neurotóxico.
Os nossos resultados revelaram que o perfil PSSR obtido no modelo animal é sobreponível ao observado nos doentes com EFV. Este perfil caracteriza-se por um aumento da S
-glutationização e um decréscimo da S-cisteinilização de proteínas, maioritariamente observados
em doentes com elevada formação de 8-hidroxi-efavirenz, o que é consistente com o seu maior risco de neurotoxicidade. O PSSR de doentes tratados com NVP foi o oposto do observado nos doentes com EFV, o que pode justificar o facto do EFV, não obstante de ser predominantemente metabolizado no fígado, ser pouco hepatotóxico. Por outro lado, a infecção por VIH não exerceu qualquer tipo de influência no PSSR.
Em conclusão, o perfil PSSR parece estar associado à neurotoxicidade inerente ao EFV, sugerindo a sua relevância enquanto ferramenta útil para a monitorização terapêutica de fármacos, tendo em vista a minimização de eventos tóxicos. Adicionalmente, o facto do EFV e da NVP terem evidenciado um perfil PSSR diferente possibilita a utilização desta ferramenta para a avaliação dos efeitos dos antiretrovirais na modulação do estado redox. Os dados resultantes
do presente trabalho poderão revelar-se de extrema importância no contexto da avaliação do risco de toxicidade, na prescrição de antiretrovirais e no desenvolvimento de fármacos.
Palavras-Chave: efavirenz, neurotoxicidade, nevirapina, S-glutationização, S-tiolação de
xiii
Table of contents
Acknowledgments ...vii
Abstract ...ix
Resumo ...xi
Table of contents ...xiii
Index of figures ...xv
Index of tables ...xvii
Abbreviations ...xix
1. Introduction... 1
1.1
Human immunodeficiency virus-infection and the combined antiretroviral therapy ... 3
1.2
Efavirenz biotransformation, oxidative stress generation and its neurotoxicity
mechanism... ... 4
1.3
Nevirapine biotransformation, oxidative stress generation and its hepatotoxicity
mechanism... ... 6
1.4
Plasma
S
-thiolated proteins as a tool for oxidative stress and neurotoxicity risk
biomonitoring ... 8
1.5
Rational, working hypothesis and specific aims ... 10
2. Materials and Methods ... 13
2.1
Study design ... 15
2.1.1 Animal study ... 15
2.1.2
Clinical study ... 16
2.2
Quantification of
S
-
thiolated proteins
profile in plasma ... 16
2.3.
Quantification of efavirenz, nevirapine and their main phase I metabolites plasma
concentration ... 17
2.3.1.
Efavirenz and 8-hydroxy-efavirenz ... 17
2.3.1.1.
Method validation ... 17
2.3.1.2.
Standard operating procedure ... 18
2.3.2. Nevirapine and 12-hydroxy-nevirapine…..………...…….……….18
2.4. Statistical analysis... ………...…….………...19
3.Results ... Erro! Marcador não definido.
3.1
Validation of the method for efavirenz and 8-hydroxy-efavirenz quantification ... 23
xiv
3.1.2
Lower limit of quantification (LLOQ) ... 23
3.1.3
Accuracy... 23
3.1.4 Intra- and inter-assay precision ... 23
3.1.5
Carryover ... 24
3.1.6
Stability ... 24
3.1.7 Recovery ... 24
3.2
Animal study ... 24
3.2.1
Animals ... 24
3.2.2
S
-
thiolated proteins plasma profile upon animal’s exposure to efavirenz
... 25
3.3
Clinical study ... 25
3.3.1
Anthropometric and clinical data of study groups ... 25
3.3.2
S
-thiolated proteins plasma profile of patients on efavirenz ... 26
3.3.3
Effect of 8-hydroxy-efavirenz on
S
-thiolated proteins plasma profile ... 27
3.3.4
Effect of HIV-infection on
S
-thiolated proteins plasma profile ... 28
3.3.5
S
-thiolated proteins plasma profile of efavirenz vs. nevirapine ... 30
3.3.6
Effect of 12-hydroxy-nevirapine on
S
-thiolated proteins plasma profile ... 31
4. Discussion ... 33
xv
Index of figures
Figure 1.1 Schematic representation of the events preceding mood changes upon EFV exposure
... 5
Figure 1.2 Nevirapine biotransformation, disposition and proposed bioactivation pathways... 7 Figure 2.1 Representative chromatogram of a standard sample with 10 mg/L of EFV (41 min)
and 8-OH-EFV (30 min)………...18
Figure 3.1 A. S-glutathionylated (GSSP) and B. S-cysteinylated (CysSSP) proteins plasma
concentrations in patients on cART-containing EFV ... 26
Figure 3.2 Correlation between S-glutathionylated (GSSP) and S-cysteinylated (CysSSP)
proteins in patients on efavirenz... 27
Figure 3.3 Association between the ratio 8-hydroxy-efavirenz/efavirenz (8-OH-EFV/EFV) on A.
S-glutathionylated (GSSP) and B. S-cysteinylated (CysSSP) proteins profile ... 28
Figure 3.4 Comparison between efavirenz (n=83), naïve (n=22) and non-HIV (n= 64) groups of
A. S-glutathionylated (GSSP) and B. S-cysteinylated (CysSSP) proteins profile ... 28
Figure 3.5 A. S-glutathionylated (GSSP) and B. S-cysteinylated (CysSSP) proteins on
cART-containing EFV patients with B vs. non-B HIV-subtype. (Unpaired t-test). ... 29
Figure 3.6 Association between CD4+ T-cell count in naïve patients (n=22) and A. S-glutathionylated (GSSP) and B. S-cysteinylated (CysSSP) proteins profile ... 30
Figure 3.7 Association between viral load in naïve patients (n=22) and A. S-glutathionylated
(GSSP) and B. S-cysteinylated (CysSSP) proteins profile. ... 30
Figure 3.8 Comparison between efavirenz (EFV) (n=83) and nevirapine (NVP) (n=66) groups on
A. S-glutathionylated (GSSP) and B. S-cysteinylated (CysSSP) proteins profile ... 31
Figure 3.9 Influence of the ratio 12-hydroxy-nevirapine/nevirapine (12-OH-NVP/NVP) on A.
xvii
Index of tables
Table 1.1 Efavirenz and nevirapine comparison: oxidative stress and toxicity mechanism. ... 10
Table 3.1 Animal weight and age at the beginning of the experiments ... 24
Table 3.2S-thiolated proteins plasma profile at 10 and 36 days of efavirenz exposure ... 25
Table 3.3 Anthropometric and clinical data of the study groups ... 26
Table 3.4 Efavirenz and 8-hydroxy-efavirenz concentrations ... 27
xix
Abbreviations
8,14-diOH-EFV 8-dihydroxy-efavirenz 7-OH-EFV 7-hydroxy-efavirenz 8-OH-EFV 8-hydroxy-efavirenz
7-OH-EFV-gln 7-hydroxy-efavirenz-glucuronide 8-OH-EFV-gln 8-hydroxy-efavirenz-glucuronide 7-OH-EFV-sulf 7-hydroxy-efavirenz-sulfate 8-OH-EFV-sulf 8-hydroxy-efavirenz-sulfate 2-OH-NVP 2-hydroxy-nevirapine 3-OH-NVP 3-hydroxy-nevirapine 4-COOH-NVP 4-carboxy-nevirapine 8-OH-NVP 8-hydroxy-nevirapine 12-OH-NVP 12-hydroxy-nevirapine 12-sulfoxi-NVP 12-sulfoxi-nevirapine
AIDS Acquired immunodeficiency syndrome ARV Antiretroviral drugs
BQL Bellow quantification limit cART Combined antiretroviral therapy CD4 Cluster differentiation 4
CNS Central nervous system CV Variation coefficient CYP450 Cytochrome P450
Cys Cysteine
CysSSP S-cysteinylated protein
DNA Deoxyribonucleic acid
EDTA Ethylenediaminetetra-acetic acid
EFV Efavirenz
EFV-gln Efavirenz-glucuronide
FDA US Food and Drug Administration
GSH Glutathione
GSSP S-Glutathionylated protein
Hcy Homocysteine
HDL High-density lipoprotein
HIV Human immunodeficiency virus HIV-1 Human immunodeficiency virus type 1
xx HPLC-FD High-performance liquid chromatography with fluorescence detection
HPLC-UV High-performance liquid chromatography with ultraviolet detector LLOQ Lower limit of quantification
LMWT Low-molecular weight thiols
na not applicable
Na2B4O7 Sodium tetraborate
NaOH Sodium hydroxide
n-B Human immunodeficiency virus type 1 non subtype B
nd not determined
ns not significant
NNRTI Non-nucleoside reverse transcriptase inhibitor
NVP Nevirapine
PSSP Protein disulfides QC Quality control
ROS Reactive oxygen species RSSP S-thiolated protein
SD Standard deviation
SH Sulfhydryl group
SULT Sulfotransferases TCA Trichloroacetic acid
TCEP Tris(2-carboxyethyl)phosphine hydrochloride UGT UDP-glucoronosyltranferase
1
3
1.1
Human immunodeficiency virus-infection and the combined
antiretroviral therapy
At the end of 2015, 33.3 million people are living with the human immunodeficiency virus (HIV) infection, the cause of immunodeficiency syndrome (AIDS) (WHO, 2016).
The HIV infects and depletes cells of immune system resulting in immunodeficiency, which if left untreated, has a high rate of morbidity and mortality (Tohyama et al., 2009). Nowadays, HIV-infected
patients are treated with combined antiretroviral therapy (cART). The first-line cART comprises several alternatives of antiretroviral combinations, adapted to each patient, and includes at least three
antiretroviral drugs (AIDSinfo, 2016). The cART was introduced in 1996, allowing a victorious control
of the HIV-infection and leading to dramatic improvements in morbidity and lifespan (Heaton et al., 2011;
Deeks, 2009). The success of cART changed dramatically the prognosis of this infection, which is currently perceived as a chronic disease (Mehellou and De Clercq, 2010). The number of people receiving cART has been expanded rapidly, with more than 17 million people on antiretroviral therapy by the end of 2015 (WHO, 2016). Consequently, the HIV-infected population now lives longer (Deeks, 2009). However, in treated patients the persistent infection/inflammation, residual viremia, compromised immune system, co-infections (e.g. hepatitis and tuberculosis), polimedication and drug-drug interactions, along with antiretroviral toxicity put HIV-infected patients at high risk of premature aging (Deeks and Phillips, 2009). In fact, treated patients are at increased risk of developing several complications, which are classically associated with the normal aging process, including cancer, cardiovascular, neurocognitive and bone diseases (Deeks and Phillips, 2009). However, they occur at an earlier age in HIV-infected persons (Deeks and Phillips, 2009) and antiretroviral toxicity has a role in this context.
There are about thirty approved antiretroviral drugs targeting the different steps of the HIV replication cycle (Zhan et al., 2016). These drugs are divided into six main classes, according to their
mechanism of action in the HIV replication cycle. Despite the introduction of several antiretroviral drugs in the last three decades, the HIV therapies still have a wide range of problems, such as severe adverse reactions associated with long-term use of cART. For that reason, the search for new molecules with antiretroviral activity and novel therapeutic targets is still ongoing (Zhan et al., 2016). An alternative
strategy is to understand the mechanisms of antiretroviral toxicity and find mechanistically-oriented biomarkers which allow preventive and management strategies to optimize the response to therapy (Grilo et al., 2016a). In this context, important advancement has been obtained for the class of
non-nucleoside reverse transcriptase inhibitors (NNRTI) (Pereira et al. 2012a; Pereira et al. 2012b). NNRTIs,
4
1.2
Efavirenz biotransformation, oxidative stress generation and its
neurotoxicity mechanism
Efavirenz (EFV) was approved for the treatment of HIV-1 in 1998, by the U.S Food and Drug Administration (FDA) (WHO, 2010). EFV availability as generic drug and low cost (EMA, 2011) are its major advantages. Also, this antiretroviral is the first-line option during the treatment with rifampicin for tuberculosis (WHO, 2010). EFV has a long half-life, allowing once-daily administration and has a good penetration in HIV-reservoirs including brain tissue and testicles (Smith et al., 2001). In adults, 600 mg
of EFV are used once-daily, which optimally results in steady state plasma concentrations within the therapeutic window 1-4 mg/L. This drug is highly protein bound (>99%), particularly to albumin (Usach
et al., 2013).
Despite the benefits that arise from the use of EFV in HIV-1 therapy, this drug is associated to central nervous system (CNS) adverse reactions that are recognized as a main reason for discontinuing EFV use (Apostolova et al., 2015b; Fumaz et al., 2005). There is a panoply of neuro-adverse reactions
associated to EFV that include among others dizziness, abnormal dreams, insomnia, mood changes, irritability, depression, suicidal ideation and hallucinations (Apostolova et al., 2015b; Naidoo et al., 2014).
The majority of efavirenz-induced CNS effects appears soon after the beginning and disappears within the first 4 weeks of therapy. In some cases, these effects can persist for much longer periods and require a treatment switch (Apostolova et al., 2015b; Cespedes and Aberg, 2006). Importantly, there is a high
prevalence of neurocognitive disorders associated with efavirenz use that emerge in apparently asymptomatic HIV+ individuals (Ciccarelli et al., 2011). These consequences of long-term efavirenz use
represent a major concern, particularly in children.
Although, is a common clinical evidence, the knowledge of the mechanisms underlying EFV neurotoxicity is slowly becoming to be understood (Grilo et al., 2016a; Apostolova et al., 2015b; Funes et al., 2015) and related to EFV biotransformation. EFV is predominantly metabolized by cytochrome
P450, primarily by CYP2B6 (Ward et al., 2003). The isoforms CYP3A4, CYP3A5, CYP1A2 and CYP2A6
have a minor participation (Ogburn et al., 2010; Bélanger et al., 2009; di Iulio et al., 2009; Ward et al.,
2003). CYP2B6 is responsible for the hydroxylation of EFV to the metabolites 8-OH-EFV (8-hydroxy-efavirenz; major) and 8,14-dihydroxy-efavirenz (8,14-diOH-EFV; minor) (Ward et al., 2003).This isoform
also mediates the metabolism of EFV to 7-hydroxy-efavirenz (7-OH-EFV), however this metabolic pathway has minor significance (Ogburn et al., 2010).The hydroxylated metabolites are subsequently
glucuronidated by UGT2B7 (Bae et al., 2011; Bélanger et al., 2009) that seems to have a minimal
influence on EFV clearance (Cho et al., 2011). Additionally, EFV can be directly conjugated to form
efavirenz-N-glucuronide (Bélanger et al., 2009). Both 8-OH-EFV and 7-OH-EFV metabolites can also
suffer another phase II reaction via sulfatation (Aouri et al., 2016). The metabolites of EFV (mainly
8-OH-EFV) are excreted predominantly in urine and bile (Ward et al., 2003; Mouly et al., 2002). Less than
5 EFV is thought to enhance its own metabolism, via induction of CYP2B6 and CYP3A4 (Ngaimisi
et al., 2010). This auto-induction is known to be concentration and time dependent (Ngaimisi et al.,
2010).
Recent non-clinical studies (Harjivan et al., 2014; Brandmann et al., 2013; Tovar-y-Romo et al.,
2012; Ward et al., 2003) have implied EFV biotransformation, namely the generation of
8-hydroxy-efavirenz (8-OH-EFV), in this context (Figure 1.1). This metabolite is able to damage neurons
and is known to be, at least an order of magnitude, more toxic than EFV itself and other of EFV phase I metabolites, the 7-hydroxy-efavirenz (Tovar-y-Romo et al., 2012). Furthermore, 8-OH-EFV has the
ability to damage astrocytes and neurons in a dose-dependent manner (Brandmann et al., 2013;
Tovar-y-Romo et al., 2012). Our group has recently given the first clinical evidence of the association of
8-OH-EFV concentrations and mood changes in HIV-infected patients (Grilo et al., 2016a) (Figure 1.1).
Figure 1.1 Schematic representation of the events preceding mood changes upon EFV exposure
(in Grilo et al., 2016a).
Upstream events: in the liver, EFV is mainly metabolized via CYP2B6 to 8-OH-EFV, to a slight degree to 7-OH-EFV via CYP2A6 and barely conjugated by UGT2B7 to EFV-N-gln. The 8-OH-EFV and 7-OH-EFV are subjected to phase II metabolism through glucuronidation (major) and sulfatation (minor). EFV is an inducer of CYP2B6 and a strong inhibitor of several UGT. Comparatively to the liver, in brain CYP2B6 is expressed into lesser extent and CYP 2A6 expression as well as phase II reactions are quite lower. Thus, an accumulation of 8-OH-EFV is expected in this organ. Further oxidation of 8-OH-EFV originates a reactive metabolite that might be involved in the genesis of mood changes and other CNS side effects observed in patients receiving EFV.
EFV: efavirenz; 8-OH-EFV: 8-hydroxy-efavirenz; 7-OH-EFV: 7-hydroxy-efavirenz; EFV-gln: efavirenz-glucuronide;
8-OH-EFV-gln: 8-hydroxy-efavirenz-glucuronide; 7-OH-EFV-gln: 7-hydroxy-efavirenz-glucuronide;
6 The bioactivation upon oxidation of 8-OH-EFV generates highly reactive electrophilic species, such as quinone and quinoneimine (Harjivan et al., 2014). The toxicological value of quinone and
quinoneimine is widely recognized, and is assigned to their ability to generate reactive oxygen species and capacity of yielding covalent adducts with proteins (Monks and Jones, 2002; Bolton et al., 2000). In
fact, EFV has been associated to enhanced oxidative stress (Weiß et al., 2016; Gomez-Sucerquia et al., 2012; Apostolova et al., 2010; Hulgan et al., 2003) which underlies the mechanisms of its
neuro-adverse reactions (Brown et al., 2014). In addition, the formation of adducts could in turn
adversely impact the function of proteins, interfering with the energy metabolism, axonal transport or pre-synaptic neurotransmitter release (Lopachin and Decaprio, 2005; Asanuma et al., 2003).
1.3
Nevirapine biotransformation, oxidative stress generation and its
hepatotoxicity mechanism
Nevirapine (NVP) was the first NNRTI approved by the American Food and Drug Administration (FDA) in 1996 for the treatment of HIV-1 infection, as part of cART (FDA, 1996).Partly due to its low cost, NVP remains the most prescribed NNRTI worldwide (Lockman et al., 2007; Ades et al., 2000).
Actually, NVP presents several advantages when compared with other antiretroviral drugs. One of the most significant benefits of this drug is its efficacy in the prevention of mother-to-child transmission of the virus, being NVP one of the most commonly prescribed antiretroviral drug to pregnant women and their children (Medrano et al., 2008; Ades et al., 2000). Unlike EFV, NVP presents low incidence of
adverse drug reactions in central nervous system (Medrano et al., 2008), allowing its use in the context
of psychiatric disorders or drug dependence. The favorable metabolic profile is another important advantage of NVP (Srivanich et al., 2010; Clotet et al., 2003; Ruiz et al., 2001) rendering it suitable for
use in patients with diabetes, dyslipidemia or metabolic syndrome.
Concerning its pharmacokinetic properties, NVP is rapidly absorbed after oral administration, being its bioavailability higher than 90% (Usach et al., 2013). NVP binds approximately 60% to plasma
proteins, easily crosses the blood-brain barrier and placenta and has been found in breast milk (Elias et al., 2013; Mirochnick et al., 2000).
Nevirapine is extensively metabolized by cytochrome P450 (CYP) into five phase I metabolites: 2-hydroxy-nevirapine (2-OH-NVP), 3-hydroxy-nevirapine (3-OH-NVP), 8-hydroxy-nevirapine (8-OH-NVP), 12-hydroxy-nevirapine (12-OH-NVP) and 4-carboxynevirapine (4-COOH-NVP) (Erickson
et al., 1999; Riska et al., 1999a; Riska et al., 1999b).The phase I reactions of NVP involves several
CYP isoforms (Erickson et al., 1999). The hydroxylation into 2-OH-NVP is mediated by CYP3A, while
7 by secondary oxidation of 12-OH-NVP (Chen et al., 2008; Erickson et al., 1999; Riska et al., 1999b;
Riska et al., 1999a). These hydroxylated metabolites suffer subsequent phase II biotransformation,
mainly by glucuronidation (Riska et al., 1999a).
Similarly to EFV, NVP induces its own metabolism, through an inductor effect on CYP3A4 and CYP2B6 (Lamson et al., 1999; Riska et al., 1999a).
The treatment with NVP has been associated with idiosyncratic hepatotoxicity and/or skin rash (De Lazzari et al., 2008; Medrano et al., 2008; Taiwo, 2006). Women seem to be at higher risk than men
of developing these adverse reactions (De Lazzari et al., 2008; Medrano et al., 2008; Antinori et al.,
2001; Ho et al., 1998), which justifies the recommendation that the drug should be initiated in
cART-naïve-women with a CD4+ cell count below 250 cells/mm3 and below 400 cells/mm3 in men (Thompson et al., 2010; Clotet, 2008). Despite the molecular mechanisms of NVP-induced toxic events are not yet
fully understood, current evidences are unanimous in attribute to NVP bioactivation a key role in this context. Several approaches involving in vitro (Antunes et al., 2008; Antunes et al., 2010a; Antunes et al., 2010b), ex vivo (Pinheiro et al., 2016; Pinheiro et al., 2015), and animal models (Chen et al., 2008;
Shenton et al., 2003), as well as, clinical trials (Marinho et al., 2014b; Meng et al., 2013; Caixas et al.,
2012) have suggested that the bioactivation of phase-I NVP metabolite 12-OH-NVP to 12-sulfoxy-NVP and the formation of NVP quinone methide from NVP, 12-OH-NVP and 12-sulfoxy-NVP are closely involved in the mechanism of NVP-related hepatotoxicity (Figure 1.2). Concretely, in the last years,
Antunes and colleagues have extensively showed the in vitro reactivity of 12-sulfoxy-NVP with several
amino acids (Antunes et al., 2010a), human serum albumin, hemoglobin (Antunes et al., 2010b) and
also with nucleosides and DNA (Antunes et al., 2008). Furthermore, while 12-sulfoxy-NVP has been
proposed to be involved in NVP-induced hepatotoxicity (Sharma et al., 2012), NVP quinone methide
has been associated with skin rash (Sharma et al., 2013).
8
(Marinho et al., 2014b).
NVP is metabolized by several isoforms of cytochrome P450 (CYP) generating several phase I metabolites: 2-OH-NVP, 3-OH-2-OH-NVP, 8-OH-NVP and 12- OH-NVP. The 12-OH-NVP metabolite is further oxidized by CYP450 yielding 4-carboxynevirapine (4-COOH-NVP). The phase I NVP metabolites undergo extensive glucuronidation, which represents a major pathway of NVP elimination. The bioactivation of OH-NVP by SULTs can generate 12-sulfoxy-NVP, which is a reactive metabolite that can bind covalently to proteins and DNA. The formation of adducts with proteins could explain the NVP-associated adverse reactions, hepatotoxicity and skin rash.
NVP: nevirapine; 2-OH-NVP: 2-hydroxy-nevirapine; 3-OH-NVP: 3-hydroxy-nevirapine; 8-OH-NVP: 8-hydroxy-nevirapine; 12- OH-NVP: 12-hydroxy-nevirapine; 4-COOH-NVP: 4-carboxynevirapine; UGT: UDP-glucuronosyltransferase; SULT: sulfotransferase.
Nevirapine also induces oxidative stress (Pinheiro et al., 2016; Adaramoye et al., 2012), which is
a common feature of hepatotoxicity (Elias et al., 2013; Kashou and Agarwal, 2011; Yamamoto et al.,
2005).
All together these findings suggest that the formation of adducts with key proteins and generation of oxidative stress might be a plausible explanation for the onset of NVP-related toxicity (Russmann et al., 2009).
1.4
Plasma
S
-thiolated proteins as a tool for oxidative stress and
neurotoxicity risk biomonitoring
Neurotoxicity studies in man are limited by the inaccessibility to the target tissues. Hence, there is a demand for suitable models to obtain further insights into the mechanisms of toxicity and to find molecular biomarkers in peripheral tissues that can be easily and ethically obtained in humans. EFV clearly illustrates these circumstances. It is infeasible to routinely measure 8-OH-EFV concentrations in cerebrospinal fluid, as a surrogate of brain tissue concentration. Until now, the pharmacokinetic targets that are upstream events of EFV neurotoxicity have been explored through CYP2B6 activity and pharmacogenetics or 8-OH-EFV plasma concentrations. A plausible way for the identification of biomarkers is to evaluate markers of response.
There is increasing awareness of the ubiquitous role of oxidative stress in neurotoxicty (Sayre et al., 2008). The perturbations in antioxidant defense systems and the subsequent redox-imbalance are
present in many tissues of HIV-infected patients, including the brain (Sharma, 2014; Aquaro et al., 2008).
The oxidation of thiol -SH groups is one of the first observable events during reactive oxygen species (ROS)-mediated damage (Grant et al., 1999). Among the major roles in metabolism and
9 of proteins’ and low molecular weight thiols (LMWT) are frequently measured as biomarkers of oxidative stress (Colombo et al., 2015; Giustarini et al., 2012). Many proteins and enzymes contain cysteine
residues which have a sulfhydryl group (-SH) (Lepedda et al., 2013). The redox status of cysteine
residues is involved in both structure and function of several enzymes, receptors and transcription factors (Grant et al., 1999). However, cysteine residues are one of the most easily oxidized residues in
proteins (Dean et al., 1997; Coan et al., 1992). The oxidation of -SH groups can lead to the formation of
protein disulfides (PSSP) or mixed disulfides, by binding between protein-SH groups and LMWT, as a whole referred to as S-thiolated proteins (RSSP) (Rossi et al., 2009; Giustarini et al., 2006; Seres et al.,
1996). The largest pool of LMWT in human plasma is the cysteine/cystine redox couple followed by cysteinylglycine, being glutathione the minor component (Rossi et al., 2009). Glutathione is the thiol
most abundant in cells and its present mainly in the reduced form (Rossi et al., 2009; Moriarty-Craige
and Jones, 2004). Thus, intracellular proteins are predominantly S-glutathionylated, while extracellular
proteins are predominantly S-cysteinylated (Rossi et al., 2009; Dalle-Donne et al., 2008). Protein S
-glutathionylation arises from the glutathione reaction with the free thiol group in certain cysteine residues of proteins (Xiong et al., 2011). This post-translational reaction represents an important redox signaling
mechanism regulating the normal function of proteins (Xiong et al., 2011). Moreover, deregulated protein S-glutathionylation was associated with chronic diseases, such as diabetes mellitus, neurodegeneration
or cancer (Hill and Bhatnagar, 2012).
Plasma is poor in glutathione content and the extent of protein S-glutathionylation (GSSP, ranges
from 0.8 to 1.4 μM) is low comparatively to thiolation by compounds such as S-cysteinylation (CysSSP,
from 150 to 180 μM) (Rossi et al., 2009; Dalle-Donne et al., 2008; Giustarini et al., 2006). The pool of
plasmatic thiols is mainly constituted by free thiol groups of proteins, whose concentration is mostly due to the single free thiol at Cys34 of albumin (Oettl and Stauber, 2007). Reduced albumin is a very abundant and important circulating antioxidant (Roche et al., 2008; Gutteridge, 1986), representing an
important defense against oxidative stress. At physiological pH, the sulfhydryl group of Cys34 of albumin exists is highly reactive (Turell et al., 2013; Roche et al., 2008). Together with the lack of thiol reducing
systems in plasma, this might explain the fact that Cys34 is S-thiolated in about one-half of the plasma
albumin molecules, forming RSSP (Oettl and Stauber, 2007). Thus, albumin is a regulator of thiol levels and this feature seems to compensate the lack of GSH recycling in plasma (Di Simplicio et al., 2005),
showing the relevance of S-glutathionylation of plasma proteins.
Plasma protein S-thiolation has been considered as an adaptive response to protect protein thiol
groups from losing their biological activity by irreversible oxidation (Colombo et al., 2015; Lepedda et al., 2013; Biswas et al., 2006). Additionally, this post-translational modification modulates the activity of
many enzymes, structural proteins and nuclear factors (Di Simplicio et al., 2005) that contain cysteine
residues in their catalytic centers or as part of protein-protein interaction interfaces (Dalle-Donne et al.,
2008). Despite protein thiolation is considered as a defensive mechanism, it can also be pathological in particular cases. For instance, homocysteine and S-homocysteinylation of proteins is a recognized risk
factor for cardiovascular diseases (Di Simplicio et al., 2005; Chrestensen et al., 2000).
10 nucleophilic protein cysteine thiol group (Harjivan et al., 2014). Much of the current knowledge about S-thiolation of proteins and its role against oxidative protein modifications and protein regulation has
been gleaned from studies focused on oxidative stress situations other than drug toxicity. While many are known to be associated to oxidative stress and organ toxicity, the RSSP profile generated upon drug exposition remains to be identified.
1.5
Rational, working hypothesis and specific aims
What is already known?
1. EFV is an antiretroviral drug that has been associated with neurotoxicity.
2. EFV biotransformation into 8-OH-EFV is an up-stream event of this neurotoxicity. Upon bioactivation of its main phase-I metabolites, 8-OH-EFV is able to form electrophilic metabolites and form adducts with proteins.
3. Clinical trials have shown that there is a high variability in the manifestation and severity of EFV-induced neuro-adverse reactions.
4. EFV and NVP share the characteristics mentioned above (Table 1.1). However, NVP is
hepatotoxic despite its penetration CNS.
5. Protein S-thiolation is a defense mechanism against irreversible oxidation of proteins.
Table 1.1 Efavirenz and nevirapine comparison: oxidative stress and toxicity mechanism.
,EFV, efavirenz; NNRTI, non-nucleoside reverse transcriptase inhibitor; NVP, nevirapine.
EFV NVP
NNRTI
CYP450 metabolism
Auto-induction of metabolism
Bioactivation of phase I
metabolites
Oxidative stress
Protein Adducts
Neurotoxicity
X11
What is still unknown and should be addressed?
1. What is the RSSP profile of long-term EFV exposure that is associated to neurotoxicity? 2. What is the influence of 8-OH-EFV concentrations in this RSSP profile?
3. What is the impact of HIV-infection in this profile? 4. Do EFV and NVP share the same profile?
Working hypothesis:
Efavirenz is a mostly prescribed (NNRTI) that induces oxidative/electrophilic stress and it is associated to neurotoxicity. We firstly hypothesized that long-term EFV exposure modulate the RSSP profile of HIV-infected patients. Secondly, this individual modulation allows the definition if there will be a toxic progression response or an adaptive response. Lastly, the RSSP profile of HIV-infected patients on nevirapine differs from efavirenz.
Accordingly, we further hypothesized that plasma RSSP profile would be a useful tool to assess antiretroviral redox modulation and quantification of oxidative stress.
In order to test our hypothesis the following specific aims were defined:
1. To study the impact of EFV exposure on RSSP profile inan animal model of EFV-related to memory impairment.
2. To find out the RSSP profile of HIV-infected patients on EFV and further compare it with the RSSP profile associated to the neurotoxicity observed in the animal model.
3. To assess the dependence of RSSP on EFV and 8-OH-EFV concentrations. 4. To understand the dependence of this profile on HIV-infection.
13
15
2.1
Study design
2.1.1 Animal study
Experiments were performed in male Wistar rats (Rattus norvegicus L.) that were obtained from the NOVA Medical School animal facility. Animals were housed two per cage, in
polycarbonate cages with wire lids (Tecniplast, Buguggiate, Varese, Italy), under 12 hours light/dark cycles (8 am - 8 pm) at room temperature (22 ± 2.0 °C) and a relative humidity of 60± 10%. Rats were maintained on standard laboratory diet (SDS diets RM1) and reverse osmosis water, given ad libitum. Corncob bedding (Probiológica, Lisbon, Portugal) was used and changed
once a week. Animals were Specific Pathogen Free (SPF) according to FELASA recommendations.
NIH Principles of Laboratory Animal Care (NIH Publication 85-23, revised 1985), the
European guidelines for the protection of animals used for scientific purposes (European Union Directive 2010/63/EU) and the Portuguese Law nº 113/2013 concerning ethical use of animals, were followed. Experimental procedures were previously approved by the Institutional Ethics Committee of the NOVA Medical School for animal care and use in research.
On total 32 rats were randomly assigned and divided into four groups of 8 animals each according to exposure time and treatment. Group 1 and 2 were administered with EFV 9 mg/Kg/day suspended in reverse osmosis water – 1.5 mL (EFV groups) during 10 and 36 days, respectively. Group 3 and 4 were administered only with vehicle – 1.5 mL (control groups) during a period of 10 and 36 days, respectively.
EFV or vehicle-only gavage administration was performed using a sterile polypropylene feeding tube (15- gauge; tip diameter: 3 mm; length: 78 mm; Instech Laboratories, Inc., USA) to reduce the risk of trauma, perforation and cross contamination. All animals underwent a 7 days period of handling acclimatization. Rats were handled daily for a period of 2 minutes each, by the same individual and accustomed to the gavage position, in a different animal facility procedures room.
Animals were weighted at baseline and twice a week throughout the entire study. The amounts of EFV were adjusted accordingly to weight variation in order to ensure a constant daily dose. EFV or vehicle was administered daily to the animals in the morning period at approximately the same schedule.
16
2.1.2 Clinical study
Two groups of adult patients were included in this work: a group of non-HIV volunteers and a group of HIV-infected patients on NVP- or EFV-therapy for at least 6 moths. The current work was conducted in accordance with the Declaration of Helsinki. All patients were fully informed about the study and gave their written informed consent.
The study protocol for HIV-infected patients received prior approval from Hospitals Ethics Committee of Centro Hospitalar de Lisboa Central, EPE (process number 115/2013) and Hospital Prof. Doutor Fernando Fonseca, EPE (process number CA 21/2011). Patients’ compliance was
controlled by the clinician. HIV-infected patients were stratified according to cART use: naive, on NVP-cART and on EFV-cART. Exclusion criteria included kidney and hepatic dysfunction. Patients with detectable viral load in cART groups were also excluded. Anthropometric and clinical data (age, CD4+ T-cell count, viral load, kidney and liver function parameters, hepatite B and C
co-infection) were recorded for each patient. For EFV-group, HIV-subtype was also recorded. The study protocol for non-HIV volunteers had been approved by the National Institute of Health Ethics Committee.
Blood samples (2 mL) were collected in EDTA (ethylenediaminetetraacetic acid) -containing tubes. The samples were centrifuged at 3 000gfor 10 min, 4 ˚C. Plasma samples were
stored at -80 ˚C until use. All patients’ samples were heated for 60 min, at 60 ˚C, for HIV
inactivation, just before handling at room temperature.
2.2
Quantification of
S
-
thiolated proteins
profile in plasma
The S-thiolated protein profile (RSSP) was herein defined as the pool of plasmatic S-glutathionylated (GSSP) and S-cysteinylated (CysSSP) proteins. For their quantification the
total and free plasma fractions of glutathione and cysteine were measured by an HPLC method with fluorescence detection (HPLC-FD), adapted from Nolin and co-authors (Nolin et al., 2007)
and previously validated by our group (Lemos, 2015). For each thiol, the subtraction of non-protein bound from the total fraction allowed the quantification of the S-thioled protein
fraction, GSSP and CysSSP respectively.
Total fraction (non-protein bound + protein bound) of cysteine and glutathione was obtained by reducing the sulfhydryl groups with Tris (2-carboxyethyl) phosphine hydrochloride (TCEP,
Sigma-aldrich) reagent (100g/L). After a 30 min incubation step at room temperature, the samples
were treated with trichloroacetic acid (TCA, Roth) (100 g/L) containing
ethylenediaminetetra-acetic acid (EDTA; 1 mM) (Sigma-aldrich), for protein precipitation. The
obtained mix was centrifuged (13000 g, 10 min, 4°C) and the supernatant collected to a new tube
17 0.125 M) (Sigma-aldrich) with EDTA (4 mM) and 7-fluorobenzo-2-oxa-1,3-diazole-4-sulfonic acid
ammonium (SBD-F; 1 g/L) (Sigma-aldrich) in Na2B4O7 buffer. The final mix was vortexed and
incubated in the dark, at 60 ºC for 1 h, to complete the derivatization of free sulfhydryl groups. Finally, a volume of 30 µL were injected into the HLPC.
For quantification of the glutathione and cysteine non-protein bound fraction, 50 µL from the same sample were submitted to protein precipitation with TCA, with subsequent centrifugation (13000 g, 10 min, at 4ºC), based on Przemyslaw and co-workers methodology (Przemysław et al., 2011). The supernatant was reduced with TCEP reagent. After incubation at room
temperature, for 30 min, the previously described protocol was followed.
HPLC analysis was performed on a Shimadzu LC-10AD VP (Shimadzu Scientific Instruments Inc) system using a reversed-phase C18 LiChroCART 250-4 column (LiChrospher 100 RP-18, 5µm, VWR, USA), at 29 ºC. The detector was set at excitation and emission
wavelengths of 385 and 515 nm, respectively. The mobile phase consisted of acetate buffer 0.1 M (pH 4.5, VWR, USA) and methanol (VWR, USA) [99:1 (v/v)]. The analytes were separated in
an isocratic elution mode for 20 minutes, at a flow rate of 0.8 mL/min.
2.3.
Quantification of efavirenz, nevirapine and their main phase I
metabolites plasma concentration
EFV and NVP were kindly provided by Dr. F.A. Beland from National Center for Toxicological Research (Jefferson, AR, USA). The phase I metabolites of EFV and NVP were
synthesized at Centro de Química Estrutural, Instituto Superior Técnico (Lisboa, Portugal) as
previously described (Harjivan et al. 2014).
2.3.1
Efavirenz and 8-hidroxy-efavirenz
2.3.1.1 Method validation
18
2.3.1.2 Standard operating procedure
As described by Grilo et al, aliquots of patients’ plasma samples (600 µL) were added to
an extraction tube with 2 mL sodium acetate (0.2 M, pH 6.8) (VWR, USA). For the free fraction
measurement the aliquot was treated with 60 µL of desionized ultrapure water (instead of the enzyme). All samples were then incubated at 37˚C, for 60 minutes. Analytes were then extracted
from plasma with 7.5 mL of tert-butyl methyl ether (VWR, USA). The samples were stirred by
inversion for 5 minutes and after centrifugation (3 000 rpm, 4 ºC, 10 min), the organic phase was evaporated to dryness at 60 ºC in a Speed-Vac concentrator (Labconco, Kansas City, MO, USA). The dried residue was reconstituted in 200 µL of mobile phase (acetonitrile: 0.1% formic acid buffer (1:1)) and 2 mL n-hexane (Merck, USA). Thereafter, the samples were stirring by inversion
for 5 minutes and centrifuge at 3000 g, at 4 ºC, for 10 minutes. The aqueous phase was recovered for a vial and 100 µL were injected into HPLC.
HPLC analysis was performed on an Agilent 1100 Series equipment (Agilent Technologies, Santa Clara, CA, USA), using a LiChrospher 100 RP-18 (250 x 4 mm; 5 μm) column protected
by a LiChrospher 100 RP-18e (4 x 4mm; 5 μm) guard-column, both from Merck. The mobile phase consisted of a mixture of 65% of 0.1% formic acid buffer (pH 2.65) (VWR, USA) (A) and 35% of
acetonitrile (VWR, USA) (B), initially delivered at a flow rate of 1.2 mL/min for the first 5 minutes.
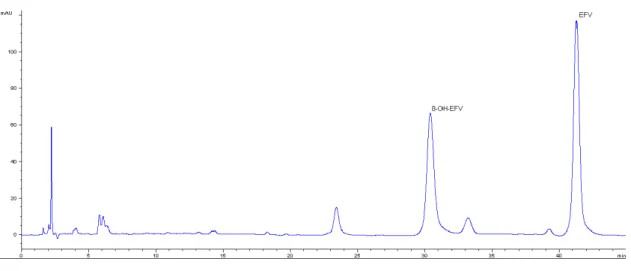
Then the percentage of solution A gradually decreased to 55% for 10 minutes and maintained at this value for a period of 16 minutes. Finally, this percentage gradually decreased to 49% during 5 minutes and maintained at this proportion for 7 minutes. The post-run time was 6 minutes and the injection volume 100 µL. The analytical run was performed with a mobile phase flow rate 1.2 ml/min, at 30º C and detection wavelength of 246 nm. The chromatographic peaks occurs at 30 minutes to 8-OH-EFV and 41 minutes to EFV (Figure 2.1).
Figure 2.1 Representative chromatogram of a standard sample with 10 mg/L of EFV (41
19
2.3.2
Nevirapine and 12-Hidroxy-Nevirapine
NVP and 12-OH-NVP plasma concentrations were determined by HPLC method, previously developed and validated by Marinho and co-authors (Marinho et al., 2014a). Briefly,
analytes were extracted from plasma samples (900 µL) with dichloromethane (VWR, USA). The
organic phase was evaporated to dryness at 60 ºC in a Speed-Vac concentrator (Labconco, Kansas City, MO, USA) and the dried residue was reconstituted in 150 µL of a 1:1 methanol:water solution.
Separation of NVP and its phase I metabolites by HPLC was performed in an Agilent 1100 Series system (Agilent Technologies, Santa Clara, CA, USA) using a reverse-phase Luna C18 column (250 mm × 4.6 mm; 5 μm; 100 Å; Phenomenex, Torrance, CA, USA). The mobile phase
– 10% acetonitrile in 15 mM ammonium acetate buffer, pH 4 (Merck, USA) – was delivered at a
flow rate of 0.8 mL/min for 90 minutes; the flow rate was then increased to 1.5 mL/min in 5 minutes and maintained at this value for an additional period of 19 minutes. The column temperature was 40 ºC, the injection volume was 100 µL, and UV absorbance was monitored at 254 nm.
2.4
Statistical Analysis
Statistical analysis was performed using GraphPad Prism® version 5.0 (GraphPad Software
Inc., CA). Tests results were considered significant at P<0.05. Normality of groups was checked using Kolmogorov–Smirnov or Shapiro-Wilk tests whenever applicable. Comparisons among
groups were performed based on the results of the normality test: Unpaired t-test or Mann-Whitney test and ANOVA or Kruskal-Wallis test for two and more than two groups, respectively.
21
23
3.1
Validation of the method for efavirenz and 8-hydroxy-efavirenz
quantification
3.1.1
Linearity
The evaluation of linearity was performed using calibration standards ranging from 0.25 to 10 mg/L for the 8-OH-EFV metabolite and 0.1 to 10 mg/L for EFV, using eight standard samples. The linear regression model showed to be the most suitable for fitting a function to the points obtained (Run Test p> 0.05). The concentration of standard samples significantly influenced the
chromatographic signal area (F tests p<0.0001) for the two analytes. The correlation coefficient
was higher than 0.99 for 8-OH-EFV and EFV, which is good indicator of adjustment of the calibration curves. For the calibrations curves of both analytes, the 95% confidence interval for the intercept contained zero. The average back-calculated concentrations for EFV and its metabolite 8-OH-EFV were also evaluated. The obtained results were close to the expected theoretical values at each tested concentration and presented differences lower than 12% for both analytes.
3.1.2
Lower limit of quantification (LLOQ)
The LLOQ of the current method was 0.1 mg/L for EFV and 0.25 mg/L for its main metabolite. Although the same lower limit of EFV was tested for 8-OH-EFV, the chromatographic peaks were not efficiently distinguished from background noise at this concentration.
3.1.3
Accuracy
The accuracy for QC samples ranged between 89-99% for EFV and 91-101% for 8-OH-EFV.
3.1.4 Intra- and inter-assay precision
24
3.1.5
Carryover
No carryover effect was observed when two blank samples were injected after the analysis of the higher calibration standard sample.
3.1.6
Stability
Regarding the stability performance after two freezing cycles, no significant deviation from the nominal concentration tested of 1.5 mg/L was found.
3.1.7 Recovery
A recovery of 99% for EFV and 92% for its metabolite from plasma supported the workability of liquid-liquid extraction protocol.
3.2
Animal study
3.2.1
Animals
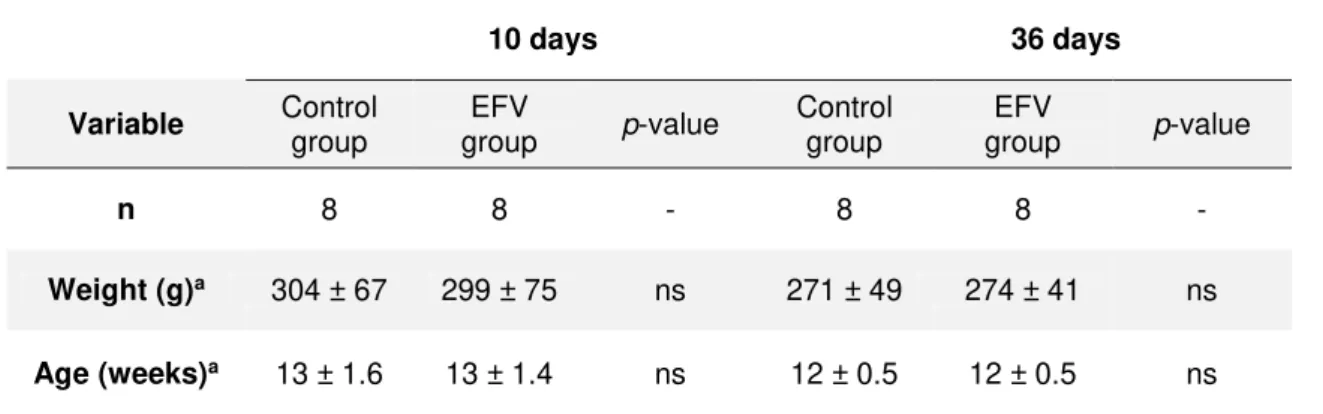
A total of 32 male Wistar rats were used. There were no differences regarding animal
weight or age in the beginning of the experiments (Table 3.1).
Table 3.1 Animal weight and age at the beginning of the experiments
10 days 36 days
Variable Control
group group EFV p-value Control group group EFV p-value
n 8 8 - 8 8 -
Weight (g)a 304 ± 67 299 ± 75 ns 271 ± 49 274 ± 41 ns
Age (weeks)a 13 ± 1.6 13 ± 1.4 ns 12 ± 0.5 12 ± 0.5 ns
25
3.2.2
S
-
thiolated proteins plasma profile upon animal’s
exposure to efavirenz
RSSP profile was assessed in plasma samples of male Wistar rats by HPLC-FD analysis
and data are present in Table 3.2. There was a time-dependent variation of RSSP profile upon
EFV exposure. CysSSP and GSSP changed inversely along with EFV exposure time.
Table 3.2 S-thiolated proteins plasma profile at 10 and 36 days of efavirenz exposure
Fold changea
Variation
(%)b p-valuec
10 days 36 days
CysSSP 1.15 ± 0.03 1.03 ± 0.03 -12 <0.001
GSSP 0.82 ± 0.06 1.16 ± 0.07 34 <0.001
a Mean±SD Fold change: ratio efavirenz-group/control-group; b % variation between 10 and 36 days; cUnpaired t-test; CysSSP, S-cysteinylated proteins; GSSP, S-glutathionylated proteins.
3.3
Clinical study
3.3.1
Anthropometric and clinical data of study groups
Anthropometric and clinical data of all groups of patients are presented on Table 3.3. A
total of 235 patients were included and 171 were HIV-infected patients. The EFV group had more male patients included (Chi-square test, p<0.001) as well as higher CD4+ T-cell count (One-way
ANOVA analysis of variance with Bonferroni’s multiple comparison test, p = 0.022), in comparison
26
Table 3.3 Anthropometric and clinical data of the study groups
a mean ± SD; b between groups; c Chi-square test,d One-way ANOVA withBonferroni’s post testfor
HIV-groups; BQL, bellow quantification limit; EFV, efavirenz; na, not applicable; nd not determined; ns, not significant; NVP, nevirapine.
3.3.2
S
-thiolated proteins plasma profile of patients on
efavirenz
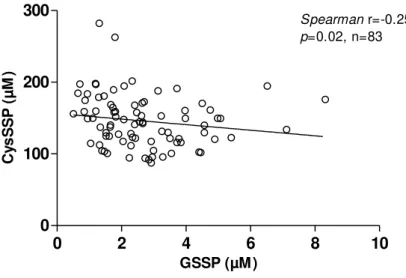
RSSP profile of EFV group is presented in Figure 3.1. The CysSSP levels (146 ± 36 µM)
were much higher than GSSP levels (2.7 ± 1.5 µM) (unpaired t-test, p<0.001) (Figure 3.1). The
coefficient of variation of GSSP was twofold the CysSSP (Figure 3.1).Patients with higher GSSP
levels had lower CysSSP levels (Figure 3.2).
Figure 3.1 A. S-glutathionylated (GSSP) and B. S-cysteinylated (CysSSP) proteins plasma
concentrations in patients on cART-containing EFV. CV; coefficient of variation. CV;
coefficient of variation
Variable non-HIV naïve NVP EFV p-valueb
N 64 22 66 83 -
Men (%) 48 41 48 83 <0.001c
Age (years) 47 ± 14 42 ± 10 46 ± 11 43 ± 11 ns
CD4+ T-cell
count (cell/µL) nd 479 ± 192 589 ± 272 642 ± 239 0.022d
Viral load
(cps/mL) na 43096 ± 55670 BQL BQL -
27
0
2
4
6
8
10
0
100
200
300
Spearman r=-0.2532,p=0.02, n=83
GSSP (µM )
Cy
s
S
S
P
(
µ
M
)
Figure 3.2 Correlation between S-glutathionylated (GSSP) and S-cysteinylated (CysSSP)
proteins in patients on efavirenz
3.3.3
Effect of 8-hydroxy-efavirenz on
S
-thiolated proteins
plasma profile
EFV and 8-OH-EFV concentrations and their coefficients of variation are presented in
Table 3.4.
Table 3.4 Efavirenz and 8-hydroxy-efavirenz concentrations
Analyte Concentration
(mg/L) CV (%)
EFVa 2.0 ± 1.1 53
8-OH-EFVa 1.8 ± 1.4 81
8-OH-EFV/EFVa 1.1 ± 1.5 129
a Mean±SD, CV, coefficient of variation; EFV, Efavirenz; 8-OH-EFV, 8-hydroxy-efavirenz.
GSSP was positively associated with 8-OH-EFV/EFV (Spearman r=0.254, p=0.03) (Figure 3.3A). This association was contrary for CysSSP (Spearman r=-0.335, p=0.003) (Figure 3.3B).
28
0 5 10 15
0 5 10
15 Spearmanr=0.2539;
p = 0.03
8-OH-EFV/EFV G S S P ( µ M )
0 5 10 15
0 100 200
300 Spearmanr= -0.3353;
p = 0.003
8-OH-EFV/EFV Cy s S S P ( µ M )
A.
B.
Figure 3.3 Association between the ratio 8-hydroxy-efavirenz/efavirenz (8-OH-EFV/EFV) on
A. S-glutathionylated (GSSP) and B. S-cysteinylated (CysSSP) proteins profile. (n=77).
3.3.4
Effect of HIV-infection on
S
-thiolated proteins plasma
profile
The RSSP profile of EFV group was compared with those of a non-HIV-group and a naïve (non-treated) HIV-group, which are presented in Figure 3.4.
EFV HIV-naive non-HIV
0 4 8
12 *** **
GS S P ( µ M )
A.
EFV HIV-naive non-HIV
0 100 200
300 * *
C y s S S P ( µ M )
B.
Figure 3.4 Comparison between efavirenz (n=83), naïve (n=22) and non-HIV (n= 64) groups
29 EFV patients had higher GSSP levels (2.7 ± 1.5 µM) than naïve (1.6 ± 0.9 µM) and non-HIV individuals (1.4 ± 0.7 µM) (Kruskal-Wallis test with Dunn’s multiple comparison test, p<0.001).
CysSSP were lower (Kruskal-Wallis test with Dunn’s multiple comparison test, p<0.01) in
EFV-group (146 ± 36 µM) comparatively to non-HIV EFV-group (165 ± 46 µM) and HIV-naïve patients (166 ± 29 µM). Naïve patients and non-HIV group had similar levels of both GSSP and CysSSP.
The subtype of HIV in EFV-group was available for 31 patients. Approximately 60% of patients were B subtype, with non-B groups including 3 patients HIV-1A, 3 patients HIV-1C and 4 patients HIV-1G No differences was found between B and non-B subtypes on GSSP and CysSSP profile (Figure 3.5).
B n-B 0 1 2 3 4 5 n=21 n=10 G S S P ( M) B n-B 0 50 100 150 n=21 n=10 C y s S S P ( M)
Figure 3.5 A. S-glutathionylated (GSSP) and B. S-cysteinylated (CysSSP) proteins on
cART-containing EFV patients with B vs. non-B HIV-subtype. (Unpaired t-test).
There was no association between RSSP profile in naïve patients and CD4+ T-cell count
30
0 500 1000 1500
0 1 2 3
4 Spearmanr=0.1856;
p = 0.4081
CD4+(cell/L)
G S S P ( µ M )
0 500 1000 1500
0 50 100 150 200
250 Pearsonr=0.3911;
p = 0.0719
CD4+(cell/L)
Cy s S S P ( µ M )
A.
B.
Figure 3.6 Association between CD4+ T-cell count in naïve patients (n=22) and A.
S-glutathionylated (GSSP) and B. S-cysteinylated (CysSSP) proteins profile. (Spearman test
to GSSP and Pearson test to CysSSP).
0 2 4 6
0 1 2 3
4 Spearmanr=0.1712;
p = 0.4461
log VL GS S P ( µ M )
0 2 4 6
0 50 100 150 200
250 Pearsonr=-0.01945;
p = 0.9315
log VL C y s S S P ( µ M )
A.
B.
Figure 3.7 Association between viral load in naïve patients (n=22) and A. S-glutathionylated
(GSSP) and B. S-cysteinylated (CysSSP) proteins profile.
3.3.5
S
-thiolated proteins plasma profile of efavirenz vs.
nevirapine
EFV-group had higher GSSP levels and lower CysSSP levels (respectively, 2.7 ± 1.5 µM and 146 ± 36 µM) than NVP-group (respectively, 1.0 ± 0.6 µM and 174 ± 39 µM) (Unpaired
31 EFV NVP 0 2 4 6 8 10 *** G S S P ( µ M )
A.
EFV NVP 0 100 200 300 400 *** C y s S S P ( µ M )B.
Figure 3.8 Comparison between efavirenz (EFV) (n=83) and nevirapine (NVP) (n=66) groups
on A. S-glutathionylated (GSSP) and B. S-cysteinylated (CysSSP) proteins profile.
(Unpaired t-test); ***p<0.001.
3.3.6
Effect of 12-hydroxy-nevirapine on
S
-thiolated proteins
plasma profile
A total of 42 patients were included for the quantification of NVP and 12-OH-NVP by HLPC-UV (Table 3.5). There was no relation between CysSSP (Figure 3.9A) or GSSP (Figure 3.9B)
and 12-OH-NVP/NVP ratio.
Table 3.5 Nevirapine and 12-hydroxy-nevirapine concentrations
Analytes Concentrations
(mg/L) CV (%)
NVPa 5.0 ± 2.1 41
12-OH-NVPa 0.5 ± 0.3 63
a Mean±SD, CV, coefficient of variation; NVP, Nevirapine; 12-OH-NVP, 12-hydroxy-nevirapine