Altered bone microarchitecture in a type 1 diabetes mouse model
1Ins2
Akita 2Filipe R. Carvalho,1,2, Sofia M. Calado2,3, Gabriela A. Silva3,4*, Gabriela S. Diogo5, Joana Moreira da Silva5, Rui 3
L Reis 5,6, M. Leonor Cancela1,4**, Paulo J. Gavaia1,4** 4
1Centre of Marine Sciences (CCMAR), Portugal; 2PhD Program in Biomedical Sciences, Universidade do
5
Algarve; 3Centre for Biomedical Research (CBMR), University of Algarve, Faro 8005-139, Portugal;, 6
4
Department of Biomedical Sciences and Medicine-DCBM, Universidade do Algarve, Faro, Portugal; 7
5
ICVS/3B’s – PT Government Associate Laboratory, Braga/Guimarães, Portugal, 63B's Research Group-8
Biomaterials, Biodegradables and Biomimetics, Universidade do Minho, Headquarters of the European Institute 9
of Excellence on Tissue Engineering and Regenerative Medicine, AvePark, 4805-017 Barco, Guimarães, 10
Portugal. 11
12
*Present address: CEDOC, NOVA Medical School/Faculdade de Ciências Médicas, Universidade Nova de 13
Lisboa, Campo Mártires da Pátria 130, Lisboa 1169-056, Portugal. 14
** Co-Corresponding authors: 15
Paulo J Gavaia: CCMAR / Universidade do Algarve, Campus de Gambelas 8005-139 Faro, Portugal, phone:
16
+351.289.800057, fax: +351.289.800069, e-mail: [email protected]. 17
M Leonor Cancela: DCBM and CCMAR / Universidade do Algarve, Campus de Gambelas 8005-139 Faro, 18
Portugal, phone: +351.289.800971, fax: +351.289.800076, e-mail: [email protected]. 19
20
21
22
Abstract
1Type 1 diabetes mellitus (T1DM) has been associated to several cartilage and bone alterations including growth 2
retardation, increased fracture risk and bone loss. To determine the effect of long term diabetes on bone we used 3
adult and aging Ins2Akita mice that developed T1DM around 3-4 weeks after birth. Both Ins2Akita and WT mice 4
were analyzed at 4, 6 and 12 months to assess bone parameters such as femur length, growth plate thickness and 5
number of mature and pre-apoptotic chondrocytes. In addition, bone microarchitecture of the cortical and 6
trabecular regions was measured by microCT and gene expression of Adamst-5, Col2, Igf1, Runx2, Acp5 and Oc 7
was quantified by qRT-PCR. Ins2Akita mice showed a decreased longitudinal growth of the femur that was related 8
to decreased growth plate thickness, lower number of chondrocytes and to a higher number of pre-apoptotic 9
cells. These changes were associated with higher expression of Adamst-5, suggesting higher cartilage 10
degradation, and with low expression levels of Igf1 and Col2 that reflect the decreased growth ability of diabetic 11
mice. Ins2Akita bone morphology was characterized by low cortical bone area (Ct.Ar) but higher trabecular bone 12
volume (BV/TV) and expression analysis showed a downregulation of bone markers Acp5, Oc and Runx2. 13
Serum levels of insulin and leptin were found to be reduced at all time points Ins2Akita. We suggest that Ins2Akita 14
mice bone phenotype is caused by lower bone formation and even lower bone resorption due to insulin 15
deficiency and to a possible relation with low leptin signaling. 16
Keywords: bone; cartilage; diabetes; insulin; leptin; Ins2Akita mouse. 17 18 19 20 21 22 23 24
Introduction
1
The global prevalence of type 1 diabetes mellitus (T1DM) has been increasing at a rate of 2-5% a year (Maahs, 2
West, Lawrence, & Mayer-Davis, 2010) leading to an increase in diabetes related pathologies, including bone 3
disorders. T1DM was previously shown to induce alterations in cartilage (Coe, Zhang, & McCabe, 2012) and 4
bone loss (Coe et al., 2012; K. J. Motyl et al., 2009), associated to different factors like higher glucose serum 5
concentration and lower insulin secretion by the β-cells, inflammation and altered gene expression. Advanced 6
glycation end products (AGEs) are proteins or lipids that are formed in hyperglycemic environments. Since their 7
cumulative effects increase with age, they represent a key player in vascular disease associated to diabetes 8
(Goldin, Beckman, Schmidt, & Creager, 2006). AGEs are involved in an increase in inflammatory activity and a 9
decrease in bone formation due to osteoblastic apoptosis and decreased osteoblast proliferation (Gangoiti, 10
Anbinder, Cortizo, & McCarthy, 2013) or higher osteoclastic activation (Sanguineti, Puddu, Mach, Montecucco, 11
& Viviani, 2014), as well as chondrocyte apoptosis in cartilage (Tsai et al., 2013). The receptor for AGEs 12
(RAGE) is assumed to be the molecular intervenient that activates the pathways leading to oxidative stress and 13
inflammation (Ramasamy, Yan, & Schmidt, 2012) including in bone since osteoblasts, osteoclasts and 14
chondrocytes express RAGE (Mercer, Ahmed, Etcheverry, Vasta, & Cortizo, 2007; Nah et al., 2007). 15
Hypoinsulinemia present in T1DM can also affect bone metabolism, since insulin signaling in osteoblasts was 16
found to regulate bone resorption by activating osteoclastic activity (Ferron, Wei, & Yoshizawa, 2010), releasing 17
undercarboxylated osteocalcin to the blood stream, which in turn affects glucose homeostasis by signaling 18
insulin secretion in β-cells and other insulin sensitive tissues (Lee et al., 2007). This relationship between bone 19
and insulin was demonstrated when Ob-IR mice, lacking the insulin receptor (IR) only in osteoblasts, became 20
glucose intolerant (Ferron et al., 2010). Both T1DM patients and mice models face a rapid weight loss during the 21
onset of the disease (Coe et al. 2012; Motyl and McCabe 2009), that persists if not treated, creating a state 22
resembling an accelerated fast that results in loss of fat and proteins. Weight loss has been associated with low 23
bone mass (M W Hamrick & Ferrari, 2008), but interestingly only a decrease in levels of fat mass were found to 24
be correlated with decreased bone mineral density (BMD) and not lean mass or total body weight (Fogelholm, 25
Sievänen, Kukkonen-Harjula, & Pasanen, 2001). This close relationship between fat and bone seems to be 26
explained by the fact that adipocytes secrete leptin. Accordingly, both the ob/ob leptin and the db/db leptin 27
receptor mutant mice have impaired bone formation, exhibiting a normal or decreased cortical bone volume 28
(BV/TV) although presenting a higher trabecular bone volume (BV/TV) (Ducy et al., 2000; Turner et al., 2013). 29
It was postulated that leptin binding to its receptors in the hypothalamus increases the expression of 30
noradrenaline activating β2-adrenergic receptors pathway in osteoblasts, inhibiting bone formation and 1
increasing the expression of RANKL, promoting the differentiation and proliferation of osteoclasts (Ducy et al., 2
2000; Elefteriou et al., 2005). These findings were supported by the results of β2-adrenergic receptor KO mice 3
(Adrb2-/-), that exhibit an increase in trabecular bone at the age of 6 months (Elefteriou et al., 2005). It has been 4
proposed that peripherally, leptin promotes osteoblast proliferation through leptin receptor signaling (Cornish et 5
al., 2002) and more recently, Turner and colleagues (Turner et al., 2013) proposed that peripheral leptin induces 6
bone formation and resorption, this representing the main route of action of leptin in bone. Food intake is 7
correlated with high levels of leptin and fasting periods are associated with low levels of leptin, as previously 8
observed in fasting mice and in anorexia nervosa (Devlin et al., 2010; Soyka, Grinspoon, Levitsky, Herzog, & 9
Klibanski, 1999). Devlin et al. (2010) in their experiments with mice under caloric restriction (CR), from 3 to 12 10
weeks of age, not only correlated leptin levels with CR but also with low cancellous BV/TV and low cortical 11
area, assuming that CR in juvenile mice under a fast period of growth lead to bone loss. But unexpected results 12
were observed in 6 months mice after a period of 10 weeks under CR (Mark W Hamrick, Ding, Ponnala, Ferrari, 13
& Isales, 2008), which presented low cortical mass, but higher trabecular BV/TV in the vertebra and unchanged 14
trabecular BV/TV in the femur. In our study we hypothesize that inflammation, together with insulin deficiency 15
and a possible decrease in leptin signaling, could be the principal causes involved in the cartilage and bone 16
phenotypes observed in Ins2Akita. 17
Materials and Methods
18
Mouse models
19
Five male wild type (WT) C57BL/6 and five male heterozygous Ins2Akita (C57BL/6 background) were sampled 36
at each of the stages analyzed, 4, 6 and 12 months of age (total of 30 mice) and were used to perform the 37
experimental procedures. Diabetes was monitored by blood glucose measurements using a Glucose Assay Kit 38
(Free Style Precision, Abbott Laboratories, Illinois, USA) and only Ins2Akita mice with glucose values >300 39
mg/dl were used in this experiment. All animal manipulations were conducted in accordance with principles and 40
procedures following the guidelines from the Federation of Laboratory Animal Science Associations (FELASA). 41
Mutant and wildtype mice were originally purchased from Jackson Laboratory (Bar Harbor, Maine) and colonies 42
established in the local bioterium at the University of Algarve. All animals were kept on a light/dark (12h/12h) 43
cycle at 23ºC, and received food (standard lab chow) and water ad libitum. 44
Total RNA isolation 1
Left femur and tibia were isolated and cleaned from adhering tissues, the bone marrow was flushed out with PBS 2
and the bone was snap‐frozen in liquid nitrogen. Frozen bones were crushed using a mortar and pestle under 3
liquid nitrogen and RNA extracted with the Isol-RNA Lysis Reagent 5 PRIME® (Hilden, Deutschland) 4
according to manufacturer’s protocol. RNA integrity was verified using ExperionTM RNA Analysis Kit (BIO-5
RAD, Hercules, CA, USA). 6
Quantitative real‐time polymerase chain reaction (qRT-PCR) 7
Reverse transcription was performed using Moloney Murine Leukemia Virus Reverse Transcriptase (M-MLV 8
RT) (Life Technologies, Carlsbad, CA, USA) according to the manufacturer’s protocol. qRT‐PCR was 9
performed using the iQ™ SYBR® Green Supermix (Life Technologies) and specific primers on an CFX96 10
Touch™ Real-Time PCR Detection System (BIO-RAD, Hercules, CA, USA) for 40 cycles, each with 15 sec. for 11
annealing and 30 sec. for amplification, followed by a melt curve analysis, as described (Technologies, 2011). 12
All gene expression data were normalized against hypoxanthine phosphoribosyltransferase 1 (Hrpt1), and 13
relative quantification calculated according to the 2-∆∆Ct method as previously described (Pfaffl, 2004). Primers 14
used for Disintegrin and metalloproteinase with thrombospondin motifs 5 (Adamst-5), Collagen Type II (Col2), 15
Insulin-like growth factor 1 (Igf1), Runt-related transcription factor 2 (Runx2), Osteocalcin (Oc) and Tartrate 16
resistant acid phosphatase (Acp5) amplification are available in supplementary material. 17
18
Serum measurements 19
Blood serum from three WT and Ins2Akita at 4, 6 and 12 months was collected and stored at −80°C. Leptin was 20
measured using a Life technologies Novex Mouse Leptin ELISA Kit (Frederick, MD, USA) according to the 21
manufacturer’s protocol. Insulin was measured using a Demeditec Insulin rat ELISA kit (Kiel, Germany) 22
according to the manufacturer’s protocol. 23
24
Bone histology and histomorphometry 25
The right tibias were fixed in 4% paraformaldehyde, (pH 7.4 in PBS), and decalcified in 10% EDTA/TRIS-HCl 1
(pH 7.4) for 15 days, then transferred to 70% Ethanol and processed for dehydration and infiltration on a routine 2
overnight processing schedule. For histomorphometry 5 animals per group were used and 4 sections were 3
analyzed in each of the cortical proximal, mid shaft and distal regions per tibia. Samples were embedded in 4
paraffin and sagittal sections with 6 µm prepared in a microtome (Microm HM340E, Germany). Before staining, 5
sections were deparaffinized in xylene and dehydrated in an increasing gradient of ethanol. Sections were stained 6
with safranin O, fast green and Mayer´s hematoxylin (Glasson, Chambers, Van Den Berg, & Little, 2010) and 7
photographed, at a magnification of 100x, under a Zeiss microscope equipped with a PowerShot G12 camera 8
(Canon, Tokyo, Japan) and a LA-DC58K conversion lens adapter (Zeiss, Oberkochen, Germany). All 9
histomorphometric analysis were conducted under blind evaluation by giving a code to each captured image. 10
Growth plate measurements 11
For assessment of the growth plate (GP) thickness, 8 to 10 measurements were performed, separated by 0.05 mm 12
of distance, for each GP sample. 5 animals for each group were used and 3 histological sections separated by 25 13
µm per tibia were analyzed. Morphological criteria, for growth plate measurements, was defined by the region 14
stained with Safranin O (cartilaginous tissue) and measurements were performed longitudinally. Proliferative 15
chondrocytes were identified according to its morphology and position in the growth plate. 16
Immunohistochemistry 17
Sections were processed as described above. After deparaffinization and hydration, heat mediated epitope 18
retrieval was performed for 25 min in tris-EDTA pH9 buffer and hyaluronidase (Sigma H3506) treatment for 30 19
min. Sections were incubated for 30 min. with blocking buffer (Goat serum and BSA) to block unspecific 20
binding sites and then incubated overnight at 4 °C with rabbit polyclonal Anti-Caspase-3 diluted in PBS 1:100 21
(ab13847, ABCAM, Cambridge, UK). Slides were then incubated in 0.3% H2O2 in PBS with 0.1% Triton X-100 22
for 15 min. The secondary antibody, anti-rabbit IgG – peroxidase (Sigma Aldrich) was applied diluted 1:100 in 23
PBS and incubated for 90 min at room temperature. The signal was detected by incubating the sections for 4 min 24
in a 0.1% 3,3′-diaminobenzidine (DAB) substrate and 0.02% hydrogen peroxide solution. The sections were 25
counterstained with Mayer’s hematoxylin. 26
Detection of apoptosis 27
Total numbers of Caspase 3 positive proliferative and hypertrophic cells were counted and hematoxylin stained 1
cells were used as negative control for pre-apoptotic cells. From each animal tested, at least 3 sections from each 2
tibia, separated by 25 µm, were observed and the percentage of apoptotic cells in growth plate determined. Cells 3
were counted using the cell counter plug-in for the imageJ software. 4
Osteoclast evaluation 5
For osteoclast evaluation 3 undecalcified fixed femurs per group were embedded in methacrylate and sectioned 6
into sagittal sections with a thickness of 5 µm. Each slide was stained (3 per femur) for tartrate-resistant acid 7
phosphatase (ACP5) using naphthol AS-TR phosphate and hexazotized pararosaniline (Sigma Aldrich, St. Louis, 8
USA) and counterstained with methyl green. Histomorphometric evaluation was performed from captured 9
micrographs (400X) throughout the metaphysis, starting approximately 0.25 mm distal from the growth and 10
extending a further 0.5 mm. Osteoclast number measurements were quantified relative to total area (TA) present 11
in each section, TA was divided by number of osteoclasts. 12
Micro-computed Tomography (CT) analysis 13
Three femurs from each time point and genotype were scanned using aBruker microCT Skyscan™ CT 1072 14
scanner (Kontich, Belgium) with an accelerated voltage of 50 kV and a current source of 197 uA at isotropic 15
voxel size 5.1µm3. Measurements in the trabecular region were made in the distal metaphysis of the femur 16
defined at 0.255mm under the growth plate extending 1mm (200 layers) toward to diaphysis, and excluding the 17
outer cortical shell. Quantitative parameters were obtained by the Skyscan™ CT-analyzer software for the 18
respective region of interest. The thickness of the cortical bone was measured in of 9 cross sections from the 19
distal femoral metaphysis and diaphysis using the Dataviewer software (v1.4.4, Bruker, Belgium). 20
Statistical analysis 21
All statistical analyses were performed using Stata Statistical Software. The data was evaluated using one-way 22
ANOVA followed by Bonferroni multiple comparisons test, with p˂0.05 considered statistically significant. 23
Results are presented as means ± standard deviation (SD). 24
Results
25
T1DM reduces femur length and body weight in Ins2Akita 26
Diabetes was confirmed by increased glucose concentrations observed at all time points in Ins2Akita mice when 1
compared to WT, with an increase of 271%, 306%, 356% at 4, 6 and 12 months respectively compared to age 2
matched controls (figure 1). Diabetic mice also presented a significant decrease in femur length (figure 2.A) and 3
lower body weight at all time points analyzed. Decrease in femur length were found to be of 5.4%, 5.3% and 4
3.8%, at 4, 6, and 12 months respectively (figure 2.B), with highly significant statistical differences compared to 5
controls (p<0.001). A significant decrease (p<0.05) of 27.1%, 26.2% and 26.9% was also observed in body 6
weight of Ins2Akita at 4, 6, and 12 months respectively (figure 2.C). 7
Growth plate thickness is lower in Ins2Akita 8
Since potential alterations in growth plate structure are known to impair longitudinal bone growth, we 9
investigated if the growth plate of Ins2Akita could be affected. Growth plate measurements (Fig 3.A) showed that 10
thickness was reduced in Ins2Akita at 4 and 6 months, but at 12 months no significant differences could be 11
observed compared to the WT counterparts (figure 3.B). Taking into account that bone lengthening depends on 12
the proliferation of chondrocytes in the growth plate, we determined the total number of proliferative 13
chondrocytes and found a significant reduction in this number at 4 and 6 months in Ins2Akita compared to WT 14
(figure 3.C). No differences were observed at 12 months, a result which is in agreement with growth plate 15
thickness measurements. To determine if the number of hypertrophic chondrocytes was altered, we performed an 16
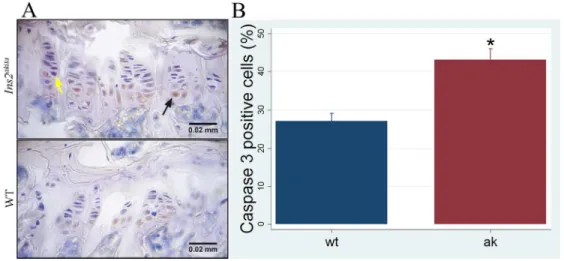
immunohistochemical detection of caspase 3 with the objective of identifying pre-apoptotic cells (figure 4.A). 17
The total number of chondrocytes in growth plate was determined by counting the cells under the microscope 18
and significant differences were observed at 4 months, with the group of Ins2Akita having a higher percentage of 19
pre-apoptotic cells (figure 4.B). 20
Ins2Akita have lower cortical area and higher trabecular bone volume at 4, 6 at 12 months 21
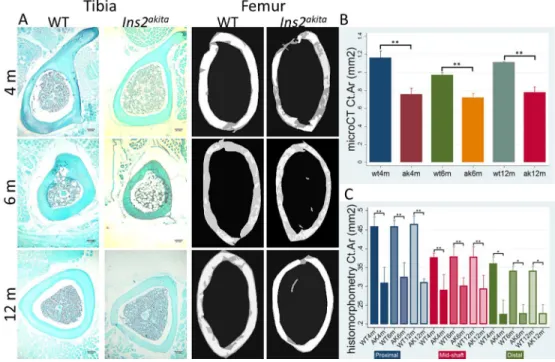
Total area (Tt.Ar) of cortical bone in the femur of Ins2Akita was found to be reduced by 32% at 4 months, 16% at 22
6 months and 25% at 12 months of age (Table 1 and figure 5.A). These differences were significant for all three 23
age groups (p˂0.05) (Table 1). The reduction was mainly due to a substantial decrease in cortical area (Ct.Ar), of 24
53% at 4 months, 35% at 6 months and 25% at 12 months, with all results being highly significant compared to 25
WT controls (p<0.001) (Table 1 and Figure 5.B). This thinning of cortical bone observed in the diabetic mice 26
was confirmed by a decrease in the cortical area fraction (Ct.Ar/Tt.Ar), cortical thickness (Ct.Th) and periosteal 27
perimeter (Ps.Pm) (p<0.05) (Table 1). No significant differences were observed for the marrow area (Ma.Ar). A 28
significant reduction could be found in the endocortical perimeter (Ec.Pm) (p<0.05) at 12 months (Table 1) but 29
not at 4 and 6 months. Diabetic mice did not show any signs of recovery or aggravation of the low cortical area 1
with aging. Ct.Ar reduction was further confirmed by analyzing three different regions of the diaphysis of the 2
tibia, (proximal, mid-shaft and distal) by histomorphometry (Figure 5.A). This analysis showed a significant 3
reduction in Ins2Akita Ct.Ar at all time points and regions (figure 5.C). Trabecular bone parameters showed 4
opposite results from those found in cortical bone (Figure 6.A). Differences in bone volume relative to trabecular 5
volume (BV/TV) in Ins2Akita were found to be highly significant at 4 months with an increase of 45% (p<0.001) 6
at 4 months, of 46% (p<0.05) at 6 months and of 30% (p>0.05) at 12 months (Table 1 and Figure 6.B). 7
Differences were also observed on the higher bone surface relative to trabecular volume (BS/TV) at 4 (p<0.001), 8
6 (p<0.001) and 12 months (p<0.05). Higher BV/TV values in Ins2Akita were due to a significant increase in the 9
number of trabeculae (Tb.N), that was of 45% at 4 months (p<0.001), 52 % at 6 months (p<0.05) and 43% at 12 10
months, and not due to the size of the trabeculae, since no differences were observed in the specific bone surface 11
(BS/BV) or in the trabecular thickness (Tb.Th) (Table 1). In Ins2Akita the high Tb.N led to a highly significant 12
(p<0.001) reduction in trabecular separation (Tb.Sp) parameters in all 3 time points analyzed (Table 1). 13
Histomorphometry of proximal mid-epiphysis of the tibia showed a significant increase of BV/TV in Ins2Akita at 14
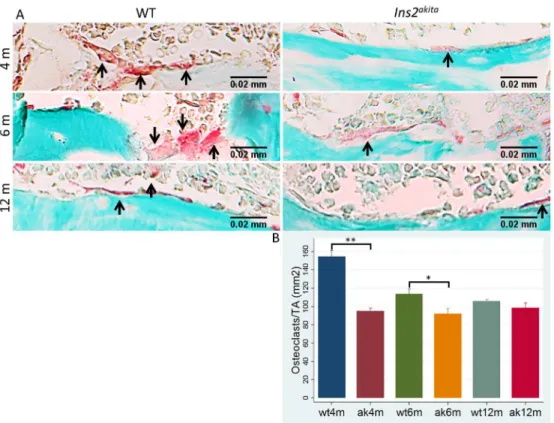
all time points (figure 6.C), in agreement with results observed in the femur. Number of osteoclasts (ACP5 15
positive cells) was found to be significantly reduced in Ins2Akita mice at 4 and 6 months, suggesting reduced 16
osteoclastogenesis and osteoclast activity (Figure 7.A and 7.B). 17
Expression of cartilage and bone marker genes is altered in Ins2Akita 18
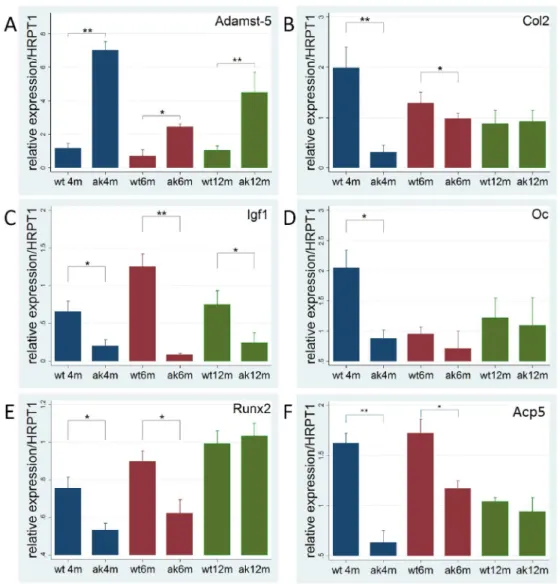
To determine the mechanisms leading to alterations in the cartilage of Ins2Akita we examined the expression 19
levels of Adamst-5, which is involved in cleavage of proteoglycans, and Col2, the most abundant protein in 20
cartilage. Adamst-5 was found to be overexpressed at all time points in Ins2Akita, being highly expressed at 4 and 21
12 months (p<0.001) and also significantly upregulated at 6 months (p<0.05) (Figure 8.A). Col2 expression was 22
found to be downregulated at both 4 and 6 months (p<0.05) compared to WT (Figure 8.B). Igf1 gene expression 23
levels were found to be downregulated at 6 months (p<0.05) and strongly downregulated at 4 and 12 months 24
(p<0.001) (Figure 8.C). Oc was found to be downregulated at 4 months (p<0.05) (Figure 8.D). Expression levels 25
of Runx2 (Figure 8.E), the main transcription factor involved in osteoblast differentiation, were significantly 26
downregulated at 4 and 6 months (p<0.05) in Ins2Akita and finally the osteoclast marker Acp5 was also found to 27
be significantly downregulated at 4 (p<0.01) and 6 months (p<0.05) (Figure 8.F). 28
Serum concentrations of insulin and leptin is reduced in Ins2Akita 29
Blood serum concentrations of insulin and leptin was determined by ELISA and in both cases were found to be 1
significantly reduced when compared to WT at 4, 6 and 12 months (p<0.001) (Figures 9.A and 9.B). 2
3
Discussion
4
T1DM has been associated to bone growth retardation in puberty (Donaghue, 2003) and increased risk of 5
fracture throughout life, leading to higher morbidity and mortality (Weber, Haynes, Leonard, Willi, & Denburg, 6
2015). Higher bone porosity and smaller cortical area are the principal causes for the observed decrease in 7
biomechanical properties, as previously reported for type 2 diabetic postmenopausal women (Patsch et al., 8
2013). In the present study, growth retardation could also be observed in the T1DM mice model Ins2Akita, 9
reflected by a decrease in length of the femurs when compared to WT mice at all time points analyzed. Similar 10
results were found in Ins2Akita at 10 weeks (Coe et al., 2012) but also with other models like in streptozotocin 11
induced diabetic mice and rats (Coe et al., 2012), in mice under caloric restriction (CR) (Devlin et al., 2010; 12
Mark W Hamrick et al., 2008), and in ob/ob mice and in leptin receptor db/db mutant mice that showed altered 13
osteoblastic activity and increased bone mass and volume (Ducy et al., 2000; Turner et al., 2013). This indicates 14
that in mice models with altered glucose metabolism or altered energy metabolism there is an impairment of 15
bone growth, either by dysregulation of direct signaling on osteoblasts by preventing insulin-receptor activation 16
or by alterations in the control exerted by the central nervous system, as suggested in previous studies (Ducy et 17
al. 2000; Lee et al. 2007; Ferron et al 2010). 18
In this work, impaired bone growth can be explained by a reduction in growth plate thickness of Ins2Akita mice at 19
4 and 6 months and by a higher number of pre-apoptotic chondrocytes in growth plate at 4 months, reflecting a 20
lower metabolic activity of the cartilage that translates into lower bone growth. Similar results were observed in 21
diabetic rodents and in CR mice (Coe et al., 2012; Devlin et al., 2010), demonstrating a direct relation between 22
early onset of diabetes and impairment of long bone growth. The reduction in growth plate thickness could also 23
be explained by a decrease in the number of proliferative chondrocytes and by a downregulation of Col2, 24
indicative of a decreased extracellular matrix production by chondrocytes, as also observed in Ins2Akita at 10 25
weeks (Coe et al., 2012). Increased inflammation in bone has been associated with osteoblast death related to 26
bone marrow inflammatory events (Coe, Irwin, Lippner, & McCabe, 2011) particularly by increasing pro-27
apoptotic and pro-inflammatory cytokines (K. J. Motyl & McCabe, 2009). An increase in tumor necrosis factor 28
α (TNFα) is known to affect bone environment (Zhou et al. 2006) and has been associated with upregulation of 29
aggrecanase 5 (Adamst-5), a metalloproteinase exerting a potent effect on cartilage matrix degradation (Illien-1
Junger et al., 2013). Accordingly, this enzyme was found to be highly expressed in our study, likely contributing 2
to higher cartilage degradation. Our results showed low levels of Igf-1 expression in Ins2Akita at all time points. 3
Lower circulating Igf-1 concentrations have been associated with reduced linear growth (Yakar et al. 2002), 4
higher cartilage degradation, and lower chondrocytic and osteoblastic proliferation (Kasukawa, Miyakoshi, & 5
Mohan, 2004). Serum Igf-1 was also found to be lower in CR mice (Devlin et al., 2010; Mark W Hamrick et al., 6
2008) caused by impaired growth hormone signaling (LeRoith & Yakar, 2007). These results suggest that a 7
decrease in Igf-1 signaling might be involved in the reduction of bone quality parameters observed in our 8
diabetic subjects. 9
Diabetes has been associated to leptin deficiency (Motyl and McCabe 2009), and leptin treated mice were shown 10
to have induced chondrocyte proliferation and enlarged growth plate thickness (Cornish et al., 2002; Turner et 11
al., 2013) supporting our results that show a decreased leptin signaling in Ins2Akita compared to WT mice 12
observed at all time points analyzed after the onset of T1DM. In diabetes, intracellular glucose starvation mimics 13
starvation periods and, not surprisingly, the results of growth retardation showed by Ins2Akita resemble those 14
found in CR mice. Our results on the microarchitecture of the distal femur, showing less cortical bone and more 15
trabecular bone, also resemble the results observed in CR mice (Mark W Hamrick et al., 2008) as well as in 16
Adrb2-/- (Elefteriou et al., 2005) and ob/ob (Ducy et al., 2000) mice at 6 months. Moreover Adrb2-/- mice at 4 17
months (Pierroz et al., 2012) and ob/ob mice at 3 and 6 months (M. W. Hamrick, Pennington, Newton, Xie, & 18
Isales, 2004; Turner et al., 2013) also showed a reduction of bone indexes in vertebrae. Lower insulin signaling 19
in adipocytes and weight loss in diabetes leads to low expression of leptin (Martin & McCabe, 2007) and 20
constitutes what Ins2Akita may have in common with previous models that could explain these similarities is 21
leptin deficiency. This results are similar to what was observed in this study with low levels of insulin detected 22
in Ins2Akita mice after the onset of disease and the reduction of insulin signaling can also explain the reduced 23
levels of leptin observed at the same ages analyzed. To explain the mosaic phenotype, Hamrick et al. (2008) 24
suggested that under caloric restriction there is a leptin deficiency and an increased neuropeptide Y signaling 25
leading to reduced cortical bone. Baldock et al (2006) reported an increase in cortical bone volume in Y2 26
receptor KO mice, but the mice double mutants for Y2 receptor and leptin showed a cortical bone volume 27
similar to the presented by leptin mutant mice, meaning that cortical bone growth in leptin deficient mouse 28
models cannot be explained only by this pathway. In the trabecular region, neither Coe et al. (2012), with 29
Ins2Akita mice at 10 weeks, nor Devlin et al. (2010) using CR mice at 12 weeks, found higher trabecular bone 30
volume, but instead there was a reduction of trabecular bone observed in those studies, probably due to the use of 1
young adult specimens in which the phenotype in trabecular bone is still not established. These results are 2
consistent with the fact that high trabecular bone volume could only be observed in Adrb2-/- mice at 6 months 3
and, more recently, at 4 months (Elefteriou et al., 2005; Pierroz et al., 2012). In our study we could detect this 4
increase in trabecular bone in Ins2Akita starting at 4 months. It was shown by Ducy et al. (2000) that ob/ob and 5
db/db mutant mice at 6 months had higher trabecular BV/TV both in vertebrae and in tibia. To explain the high 6
trabecular volume and low cortical bone volume, it has been shown that leptin have a neuroendocrine role 7
increasing the expression of osteogenic markers related to bone formation, but also to stimulate bone resorption 8
(Bartell et al., 2011; M. W. Hamrick et al., 2004) or by suggesting a higher significance of the stimulatory effect 9
of leptin in bone peripherally. Turner et al. ( 2013) have proposed that leptin can influence bone by acting 10
centrally and peripherally, and in both cases leptin induces bone formation and resorption, concluding that 11
regulation was predominantly made by direct signaling on both the osteoblastic and osteoclastic lineages. 12
Lower Oc and even lower cross-linked C-telopeptide serum levels in leptin mutant ob/ob and in the leptin 13
receptor mutant db/db mice was associated with low bone formation and low bone resorption (Turner et al., 14
2013). These conclusions led to the assumption that higher bone volume in the trabecular bone of the vertebrae 15
was due to lower bone formation but an even higher reduction in bone resorption. Turner and collaborators 16
(2013) proposed an interesting model to explain the lower cortical bone and higher trabecular bone phenotype. 17
Since leptin acts over chondrocytes, osteoblasts and osteoclasts, to enhance their number and/activity, changes in 18
bone mass and architecture are dependent on local prevalence of osteoblasts and osteoclasts. So, in the 19
periosteum of the cortical bone, where we have a higher presence of osteoblasts and lower numbers of 20
osteoclasts, it is expected a lower bone formation in leptin deficient models. In trabecular bone, reduction in 21
bone resorption can preserve trabecular number, providing a scaffold for addition of new bone. This theory is in 22
agreement with our results, since trabecular bone surface (BS/TV) and trabecular number (Tb.N) in Ins2Akita were 23
always significantly higher, the number of osteoclasts and Acp5 expression was reduced at 4 and 6 months while 24
the expression of genes associated with bone formation (Oc and Runx2) showed to be downregulated, 25
particularly at 4 months, when we could detect higher histomorphometric differences in trabecular and cortical 26
bone. It has also been shown by Kalra et al. (2009) that 10 weeks old Akita mice had significantly lower plasma 27
Oc than WT mice, confirming a lower osteoblastic activity. Other explanation for the presumable lower bone 28
formation and resorption rate expressed by our results, is the fact that insulin signaling in osteoblasts has been 29
associated to higher osteoblast and osteoclast activity promoting both bone formation and resorption (Lee et al., 1
2007). 2
Fulzele et al. (2010) working with mice lacking insulin receptor in osteoblasts, Ob-IR, could observe a reduction 3
in number of osteoblasts, bone formation rate and serum CTx. Although presenting signs of lower bone 4
formation and resorption, Ob-IR showed lower BV/TV and Tb.N in the trabecular region at 3 and 6 weeks. But 5
at 3 months, Ob-IR presented only a trend of lower BV/TV and Tb.N, leading us to question what would be the 6
trabecular phenotype of older Ob-IR mice. In addition, Motyl et al. (2009) and Motyl and McCabe (2009) 7
observed a lower relative expression of Acp5 mRNA in induced diabetic type 1 mice, suggesting lower bone 8
resorption, and a downregulation of osteogenic genes Runx2 and Oc. 9
Hyperglycemia has been associated to lower bone quality, especially by the role of AGEs that have been shown 10
to reduce osteoblastic differentiation and by increasing osteoclast bone resorption. These findings are supported 11
by work with KO mice for the receptor for AGEs (RAGE), that presented higher bone volume and lower bone 12
resorption (Zhou et al. 2006). Although the possible higher signaling of AGEs in osteoblasts resembles the lower 13
bone volume observed in our study, osteoclast activation by RAGE conflicts with our data and with the majority 14
of reports with type 1 diabetic models (Motyl and McCabe 2009; Motyl et al. 2009) that suggests lower bone 15
resorption. Nevertheless, AGEs are thought to be preponderant in reducing the biomechanical properties of bone, 16
since they accumulate in bone matrix, reducing bone strength and increasing fracture risk (Yamamoto, 17
Yamaguchi, Yamauchi, Yano, & Sugimoto, 2008). 18
High bone marrow adiposity has been associated to reduced bone formation (Devlin et al., 2010), due to the fact 19
that adipogenesis and osteoblastogenesis are derived from a common mesenchymal precursor and selection of 20
adipose lineage could lead to reduced number of osteoblasts although this hypothesis as not yet been confirmed 21
(Motyl and McCabe 2009). It has been proposed that marrow adipose tissue may act physiologically to provide 22
an expandable/contractible fat depot for sustaining optimal hematopoiesis (Turner, Martin, & Iwaniec, 2018). 23
Also inflammation in bone environment has been pointed as a possible cause for reduced bone formation, when 24
the MC3T3 osteoblastic cell line was exposed to bone marrow from diabetic mice it resulted in increased 25
osteoblast death, but when co-cultured with TNFα neutralizing antibodies the cell death response was reduced 26
(Coe et al., 2011). 27
Reduced bone formation in Type 1 diabetes mellitus seems to have multifactorial explanations, but reduced bone 28
resorption can be explained, in part, by the reduced insulin and leptin signaling in osteoblasts and/or osteoclasts, 29
as previously reported. Like in previous reports (Jun, Ma, Pyla, & Segar, 2012; Naito et al., 2011; Schoeller et 1
al., 2014), Ins2Akita in our study showed to be insulin and leptin deficient, and this double disorder may explain 2
why diabetic mutants presented such marked differences, where in the trabecular region of the Ins2Akita at 4 3
months bone volume was almost two times higher. Although Motyl and McCabe (2009) have tried to reverse 4
bone alterations observed in Ins2Akita mice using leptin treatments, it proved unsuccessful. 5
Future studies should focus in understanding the molecular roles of leptin in Type 1 diabetes mellitus and also to 6
evaluate treatments at different life stages or during longer periods of treatment. Finally, we have for the first 7
time identified a clear effect of diabetes in the microarchitecture of the long bones in the T1DM model Ins2Akita 8
and we concluded that the high trabecular bone volume can be explained by altered bone remodeling caused by 9
lack of insulin signaling and leptin deficiency, or both acting synergistically. 10
Acknowledgments
11
F.R. Carvalho and S.M. Calado acknowledge the financial support from the Portuguese Foundation for Science 12
and Technology (FCT) through PhD fellowships SFRH/BD/76429/2011 and SFRH/BD/76873/2011 13
respectively. This work was funded in part by CCMAR funding from European Regional Development Fund 14
(ERDF) under COMPETE Program and through FCT under PEst-C/MAR/LA0015/2011 project and through 15
UID/Multi/04326/2013 project. GA Silva was funded by (PIRG05-GA-2009-249314–EyeSee) and Research 16
Center Grant UID/BIM/04773/2013 to CBMR. 17
18
Conflict of interests 19
All authors disclose no conflict of interests 20
21
References
22Baldock, P. a, Allison, S., McDonald, M. M., Sainsbury, A., Enriquez, R. F., Little, D. G., Herzog, H. (2006). 23
Hypothalamic regulation of cortical bone mass: opposing activity of Y2 receptor and leptin pathways. 24
Journal of Bone and Mineral Research : The Official Journal of the American Society for Bone and 25
Mineral Research, 21, 1600–1607. 26
Bartell, S. M., Rayalam, S., Ambati, S., Gaddam, D. R., Hartzell, D. L., Hamrick, M., Baile, C. A. (2011). 27
Central (ICV) leptin injection increases bone formation, bone mineral density, muscle mass, serum IGF-1, 28
and the expression of osteogenic genes in leptin-deficient ob/ob mice. Journal of Bone and Mineral 29
Research, 26, 1710–1720. 30
Coe, L. M., Irwin, R., Lippner, D., & McCabe, L. R. (2011). The bone marrow microenvironment contributes to 31
type I diabetes induced osteoblast death. Journal of Cellular Physiology, 226, 477–83. 32
Coe, L. M., Zhang, J., & McCabe, L. R. (2012). Both spontaneous Ins2(+/-) and streptozotocin-induced type I 33
diabetes cause bone loss in young mice. Journal of Cellular Physiology, 228, 689–95. 1
Cornish, J., Callon, K. E., Bava, U., Lin, C., Naot, D., Hill, B. L., … Reid, I. R. (2002). Leptin directly regulates 2
bone cell function in vitro and reduces bone fragility in vivo. The Journal of Endocrinology, 175, 405–15. 3
Devlin, M. J., Cloutier, A. M., Thomas, N. A., Panus, D. A., Lotinun, S., Pinz, I., Bouxsein, M. L. (2010). 4
Caloric restriction leads to high marrow adiposity and low bone mass in growing mice. Journal of Bone 5
and Mineral Research : The Official Journal of the American Society for Bone and Mineral Research, 25, 6
2078–88. 7
Donaghue, K. C. (2003). Secular trends in growth in diabetes: are we winning? Archives of Disease in 8
Childhood, 88, 151–154. 9
Ducy, P., Amling, M., Takeda, S., Priemel, M., Schilling, A. F., Beil, F. T., Karsenty, G. (2000). Leptin inhibits 10
bone formation through a hypothalamic relay: a central control of bone mass. Cell, 100, 197–207. 11
Elefteriou, F., Ahn, J. D., Takeda, S., Starbuck, M., Yang, X., Liu, X., Karsenty, G. (2005). Leptin regulation of 12
bone resorption by the sympathetic nervous system and CART. Nature, 434, 514–520. 13
Ferron, M., Wei, J., & Yoshizawa, T. (2010). Insulin signaling in osteoblasts integrates bone remodeling and 14
energy metabolism. Cell, 142, 296–308. 15
Fogelholm, G. M., Sievänen, H. T., Kukkonen-Harjula, T. K., & Pasanen, M. E. (2001, January). Bone mineral 16
density during reduction, maintenance and regain of body weight in premenopausal, obese women. 17
Fulzele, K., Riddle, R. C., DiGirolamo, D. J., Cao, X., Wan, C., Chen, D., Clemens, T. L. (2010). Insulin 18
Receptor Signaling in Osteoblasts Regulates Postnatal Bone Acquisition and Body Composition. Cell, 142, 19
309–319. 20
Gangoiti, M. V., Anbinder, P. S., Cortizo, A. M., & McCarthy, A. D. (2013). Morphological changes induced by 21
advanced glycation endproducts in osteoblastic cells: Effects of co-incubation with alendronate. Acta 22
Histochemica, 1–9. 23
Glasson, S. S., Chambers, M. G., Van Den Berg, W. B., & Little, C. B. (2010). The OARSI histopathology 24
initiative – recommendations for histological assessments of osteoarthritis in the mouse. Osteoarthritis and 25
Cartilage, 18, S17–S23. 26
Goldin, A., Beckman, J. A., Schmidt, A. M., & Creager, M. A. (2006). Advanced glycation end products: 27
sparking the development of diabetic vascular injury. Circulation, 114, 597–605. 28
Hamrick, M. W., Ding, K.-H., Ponnala, S., Ferrari, S. L., & Isales, C. M. (2008). Caloric restriction decreases 29
cortical bone mass but spares trabecular bone in the mouse skeleton: implications for the regulation of 30
bone mass by body weight. Journal of Bone and Mineral Research : The Official Journal of the American 31
Society for Bone and Mineral Research, 23, 870–8. 32
Hamrick, M. W., & Ferrari, S. L. (2008). Leptin and the sympathetic connection of fat to bone. Osteoporosis 33
International : A Journal Established as Result of Cooperation between the European Foundation for 34
Osteoporosis and the National Osteoporosis Foundation of the USA, 19, 905–12. 35
Hamrick, M. W., Pennington, C., Newton, D., Xie, D., & Isales, C. (2004). Leptin deficiency produces 36
contrasting phenotypes in bones of the limb and spine. Bone, 34, 376–383. 37
Illien-Junger, S., Grosjean, F., Laudier, D. M., Vlassara, H., Striker, G. E., & Iatridis, J. C. (2013). Combined 38
anti-inflammatory and anti-AGE drug treatments have a protective effect on intervertebral discs in mice 39
with diabetes. PloS One, 8, e64302. 40
Jun, J. Y., Ma, Z., Pyla, R., & Segar, L. (2012). Leptin treatment inhibits the progression of atherosclerosis by 41
attenuating hypercholesterolemia in type 1 diabetic Ins2(+/Akita):apoE(-/-) mice. Atherosclerosis, 225, 42
341–7. 43
Kalra, S.P., Dube, M.G., Iwaniec, U.T. (2009). Leptin increases osteoblast-specific osteocalcin release through a 44
hypothalamic relay. Peptides 30, 967–97. 45
Kasukawa, Y., Miyakoshi, N., & Mohan, S. (2004). The anabolic effects of GH/IGF system on bone. Current 46
Pharmaceutical Design, 10, 2577–92. 47
Lee, N. K., Sowa, H., Hinoi, E., Ferron, M., Ahn, J. D., Confavreux, C., Karsenty, G. (2007). Endocrine 48
regulation of energy metabolism by the skeleton. Cell, 130, 456–69. 49
LeRoith, D., & Yakar, S. (2007). Mechanisms of disease: metabolic effects of growth hormone and insulin-like 1
growth factor 1. Nature Clinical Practice. Endocrinology & Metabolism, 3, 302–310. 2
Maahs, D. M., West, N. A., Lawrence, J. M., & Mayer-Davis, E. J. (2010). Epidemiology of type 1 diabetes. 3
Endocrinology and Metabolism Clinics of North America, 39, 481–97. 4
Martin, L. M., & McCabe, L. R. (2007). Type I diabetic bone phenotype is location but not gender dependent. 5
Histochemistry and Cell Biology, 128, 125–33. 6
Mercer, N., Ahmed, H., Etcheverry, S. B., Vasta, G. R., & Cortizo, A. M. (2007). Regulation of advanced 7
glycation end product (AGE) receptors and apoptosis by AGEs in osteoblast-like cells. Molecular and 8
Cellular Biochemistry, 306, 87–94. 9
Motyl, K. J., Botolin, S., Irwin, R., Appledorn, D. M., Kadakia, T., Amalfitano, A., McCabe, L. R. (2009). Bone 10
inflammation and altered gene expression with type I diabetes early onset. Journal of Cellular Physiology, 11
218, 575–83. 12
Motyl, K. J., & McCabe, L. R. (2009). Leptin treatment prevents type I diabetic marrow adiposity but not bone 13
loss in mice. Journal of Cellular Physiology, 218, 376–84. 14
Motyl, K., & McCabe, L. R. (2009). Streptozotocin, type I diabetes severity and bone. Biological Procedures 15
Online, 11, 296–315. 16
Nah, S.-S., Choi, I.-Y., Yoo, B., Kim, Y. G., Moon, H.-B., & Lee, C.-K. (2007). Advanced glycation end 17
products increases matrix metalloproteinase-1, -3, and -13, and TNF-alpha in human osteoarthritic 18
chondrocytes. FEBS Letters, 581, 1928–32. 19
Naito, M., Fujikura, J., Ebihara, K., Miyanaga, F., Yokoi, H., Kusakabe, T., Nakao, K. (2011). Therapeutic 20
impact of leptin on diabetes, diabetic complications, and longevity in insulin-deficient diabetic mice. 21
Diabetes, 60, 2265–73. 22
Patsch, J. M., Burghardt, A. J., Yap, S. P., Baum, T., Schwartz, A. V, Joseph, G. B., & Link, T. M. (2013). 23
Increased cortical porosity in type 2 diabetic postmenopausal women with fragility fractures. Journal of 24
Bone and Mineral Research : The Official Journal of the American Society for Bone and Mineral 25
Research, 28, 313–24. 26
Pfaffl, M. (2004). Quantification strategies in real-time PCR Michael W . Pfaffl. A-Z of Quantitative PCR, 87– 27
112. 28
Pierroz, D. D., Bonnet, N., Bianchi, E. N., Bouxsein, M. L., Baldock, P. A., Rizzoli, R., & Ferrari, S. L. (2012). 29
Deletion of β-adrenergic receptor 1, 2, or both leads to different bone phenotypes and response to 30
mechanical stimulation. Journal of Bone and Mineral Research : The Official Journal of the American 31
Society for Bone and Mineral Research, 27, 1252–62. 32
Ramasamy, R., Yan, S. F., & Schmidt, A. M. (2012). Advanced glycation endproducts: from precursors to 33
RAGE: round and round we go. Amino Acids, 42, 1151–61. 34
Sanguineti, R., Puddu, A., Mach, F., Montecucco, F., & Viviani, G. L. (2014). Advanced Glycation End 35
Products Play Adverse Proinflammatory Activities in Osteoporosis. Mediators of Inflammation, 2014, 1–9. 36
Schoeller, E. L., Chi, M., Drury, A., Bertschinger, A., Esakky, P., & Moley, K. H. (2014). Leptin monotherapy 37
rescues spermatogenesis in male Akita type 1 diabetic mice. Endocrinology, 155, 2781–6. 38
Soyka, L. A., Grinspoon, S., Levitsky, L. L., Herzog, D. B., & Klibanski, A. (1999). The effects of anorexia 39
nervosa on bone metabolism in female adolescents. The Journal of Clinical Endocrinology and 40
Metabolism, 84, 4489–96. 41
Technologies, A. (2011). Critical Factors for Successful Real-Time PCR. Nature Methods, 64. 42
Tsai, W.-C., Liang, F.-C., Cheng, J.-W., Lin, L.-P., Chang, S.-C., Chen, H.-H., & Pang, J.-H. S. (2013). High 43
glucose concentration up-regulates the expression of matrix metalloproteinase-9 and -13 in tendon cells. 44
BMC Musculoskeletal Disorders, 14, 255. 45
Turner, R. T., Kalra, S. P., Wong, C. P., Philbrick, K. A., Lindenmaier, L. B., Boghossian, S., & Iwaniec, U. T. 46
(2013). Peripheral leptin regulates bone formation. Journal of Bone and Mineral Research : The Official 47
Journal of the American Society for Bone and Mineral Research, 28, 22–34. 48
Turner, R. T., Martin, S. A., & Iwaniec, U. T. (2018). Metabolic Coupling Between Bone Marrow Adipose 49
Tissue and Hematopoiesis. Current Osteoporosis Reports, 16, 95–104. 1
Weber, D. R., Haynes, K., Leonard, M. B., Willi, S. M., & Denburg, M. R. (2015). Type 1 Diabetes Is 2
Associated With an Increased Risk of Fracture Across the Life Span: A Population-Based Cohort Study 3
Using The Health Improvement Network (THIN). Diabetes Care, 38, 1913–20. 4
Yakar S, Rosen CJ, Beamer WG, Ackert-Bicknell CL, Wu Y, Liu JL, Ooi GT, Setser J, Frystyk J, Boisclair YR, 5
L. D. (2002). Circulating levels of LGF-1 directly regulate bone growth and density. Journal of Clinical 6
Investigation, 110, 771–781. 7
Yamamoto, M., Yamaguchi, T., Yamauchi, M., Yano, S., & Sugimoto, T. (2008). Serum pentosidine levels are 8
positively associated with the presence of vertebral fractures in postmenopausal women with type 2 9
diabetes. The Journal of Clinical Endocrinology and Metabolism, 93, 1013–1019. 10
Zhou, F. H., Foster, B. K., Zhou, X.-F., Cowin, A. J., & Xian, C. J. (2006). TNF-alpha mediates p38 MAP 11
kinase activation and negatively regulates bone formation at the injured growth plate in rats. Journal of 12
Bone and Mineral Research : The Official Journal of the American Society for Bone and Mineral 13
Research, 21, 1075–1088. 14
Zhou, Z., Immel, D., Xi, C.-X., Bierhaus, A., Feng, X., Mei, L., Xiong, W.-C. (2006). Regulation of osteoclast 15
function and bone mass by RAGE. The Journal of Experimental Medicine, 203, 1067–1080. 16
Figure Legends
1
Figure 1. Higher glucose concentrations in Ins2Akita. Blood glucose concentration is higher in Ins2Akita at all 2
time points compared to WT. 5 animals per group and time point were evaluated. *p<0.05, **p<0.001. Error 3
bars represent SD. 4
Figure 2. Ins2Akita presents shorter femurs. A. X-ray analysis of Ins2Akita and WT mice femurs at 4, 6 and 12 5
months; B. Ins2Akita femur length is significantly smaller than WT at 4, 6 and 12 months, demonstrating that 6
type 1 diabetes mellitus is related to growth retardation. C. Body weight of Ins2Akita is significantly lower 7
compared to WT at 4, 6 and 12 months. 5 animals per group and time point were evaluated. *p<0.05, **p<0.001. 8
Error bars represent SD. 9
Figure 3. Reduced growth plate thickness in Ins2Akita. A. Growth plate thickness of Ins2Akita mice and WT. A 10
lower number of proliferative chondrocytes led to thinner growth plates and to decreased longitudinal bone 11
growth; black arrows represent measurements of growth plate thickness of WT; B. and C. growth plate thickness 12
and number of proliferative chondrocytes are significantly lower at 4 and 6 months in Ins2Akita but not at 12 13
months. 5 animals per group and time point were evaluated. *p<0.05. Error bars represent SD. 14
Figure 4. Increased apoptosis in Ins2Akita growth plate. A. Evaluation of pre-apoptotic cells by
15
immunohistochemistry in growth plate (black and yellow arrows: caspase 3 positive and negative cells, 16
respectively); B. Ins2Akita showed a significant increase in number of pre-apoptotic chondrocytes in the growth 17
plate compared to WT. 3 animals per group were evaluated. *p<0.05. Error bars represent SD. 18
Figure 5. Reduced cortical area in long bones of Ins2Akita. A. Histological sections of the cortical proximal, 19
mid-shaft and distal regions of the tibia and microCT images of the cortical diaphyseal distal shaft of the femur 20
of Ins2Akita and WT mice of 4, 6 and 12 months. Diabetes induced cortical bone loss and significant differences 21
could be found in Tt.Ar, Ct.Ar, Ct.Ar/Tt.Ar, Ct.Th, Ps.Pm. Bone volume reduction occurred by the decline in 22
periosteum perimeter suggesting lower bone formation; B. Ins2Akita mice have significantly lower proximal, mid-23
shaft and distal cortical bone area of the tibia when compared to WT mice at 4, 6 and 12 months assessed by 24
histomorphometry analysis; C. Ins2Akita mice have significantly lower cortical bone area of the femur when 25
compared to WT mice at 4, 6 and 12 months, assessed by microCT analysis. 3 animals per group and time point 26
were used for microCT analysis and 5 for histomorphometry evaluation. *p<0.05, **p<0.001. Error bars 27
represent SD. 28
Figure 6. Increased trabecular bone volume in Ins2Akita. A. Histological sections of the proximal
mid-29
epiphysis of the tibia and microCT images of the distal mid-epiphysis of femur of Ins2Akita and WT mice of 4, 6 30
and 12 months. Significant differences could be seen in BV/TV, BS/TV, Tb.N and Tb.Sp bone parameters. The 31
higher bone volume observed in Ins2Akita trabeculae is explained by the increase in trabeculae number and not 32
trabeculae thickness or size. These results also suggest lower bone resorption; B. Ins2Akita mice showed a 33
significant increase in trabecular bone volume (BV/TV) of the femur when compared to WT mice at 4, 6 months 34
by microCT analysis; C. Ins2Akita mice showed a significant increase in trabecular bone volume (BV/TV) of the 35
tibia when compared to WT mice at 4, 6 and 12 months by histomorphometric analysis. 3 animals per group and 36
time point were used for microCT analysis and 5 for histomorphometry evaluation. *p<0.05, **p<0.001. Error 37
bars represent SD. 38
Figure 7. ACP5 positive cells are reduced in Ins2Akita. A. Undecalcified histological sections of proximal mid-39
epiphysis of the femur of Ins2Akita and WT mice of 4, 6 and 12 months were used for osteoclasts identification by 40
ACP5positive cells; B. ACP5 positive cells were lower in Ins2Akita when compared to WT. 5 animals per group
41
and time point were evaluated. *p<0.05, **p<0.001. Error bars represent SD. 42
Figure 8. Altered expression of bone markers in Ins2Akita. Diabetes in Ins2Akita induced changes in mRNA 43
gene expression in cartilage and bone; A. Adamst-5 expression is higher at all ages in Ins2Akita suggesting higher 44
cartilage degradation; B. Col2 expression is reduced at 4 and 6 months in Ins2Akita in accordance with the lower 45
cartilage matrix area of growth plate; C. Igf1 expression is lower at all ages in Ins2Akita; D. Oc is downregulated 46
at 4 months in Ins2Akita; E. Runx2 was downregulated at 4 and 6 months in Ins2Akita, suggesting lower bone 47
growth. F. Acp5 was found to be downregulated at 4 and 6 months in Ins2Akita. *p<0.05, **p<0.001. RNA from 5 1
animals were evaluated per group and time point. Error bars represent SD. 2
Figure 9. Blood serum concentrations of insulin and leptin are reduced in Ins2Akita mice. Serum
3
concentrations were reduced at 4, 6 and 12 months in Ins2Akita mice when compared to WT. *p<0.001. Error 4
bars represent SD. 5
Figure 1. Higher glucose concentrations in Ins2Akita
. Blood glucose concentration is higher in Ins2Akita
at all time points compared to WT. 5 animals per group and time point were evaluated. *p<0.05, **p<0.001.
Caption : Figure 2. Ins2Akita presents shorter femurs. A. X-ray analysis of Ins2Akita and WT mice femurs at 4, 6 and 12 months; B. Ins2Akita femur length is significantly smaller than WT at 4, 6 and 12 months,
demonstrating that type 1 diabetes mellitus is related to growth retardation. C. Body weight of Ins2Akita is
significantly lower compared to WT at 4, 6 and 12 months. 5 animals per group and time point were evaluated. *p<0.05, **p<0.001.
Figure 3. Reduced growth plate thickness in Ins2Akita
. A. Growth plate thickness of Ins2Akita
mice and WT. A lower number of proliferative chondrocytes led to thinner growth plates and to decreased longitudinal bone
growth; black arrows represent measurements of growth plate thickness of WT; B. and C. growth plate thickness and number of proliferative chondrocytes are significantly lower at 4 and 6 months in Ins2Akita but
not at 12 months. 5 animals per group and time point were evaluated. *p<0.05.
Figure 4. Increased apoptosis in Ins2Akita growth plate. A. Evaluation of pre-apoptotic cells by immunohistochemistry in growth plate (black and yellow arrows: caspase 3 positive and negative cells,
respectively); B. Ins2Akita showed a significant increase in number of pre-apoptotic chondrocytes in the growth plate compared to WT. 3 animals per group were evaluated. *p<0.05
Figure 5. Reduced cortical area in long bones of Ins2Akita. A. Histological sections of the cortical proximal, mid-shaft and distal regions of the tibia and microCT images of the cortical diaphyseal distal shaft of the femur of Ins2Akita and WT mice of 4, 6 and 12 months. Diabetes induced cortical bone loss and significant differences could be found in Tt.Ar, Ct.Ar, Ct.Ar/Tt.Ar, Ct.Th, Ps.Pm. Bone volume reduction occurred by the
decline in periosteum perimeter suggesting lower bone formation; B. Ins2Akita mice have significantly lower proximal, mid-shaft and distal cortical bone area of the tibia when compared to WT mice at 4, 6 and 12 months assessed by histomorphometry analysis; C. Ins2Akita mice have significantly lower cortical bone area
of the femur when compared to WT mice at 4, 6 and 12 months, assessed by microCT analysis. 3 animals per group and time point were used for microCT analysis and 5 for histomorphometry evaluation. *p<0.05,
Figure 6. Increased trabecular bone volume in Ins2Akita
. A. Histological sections of the proximal mid-epiphysis of the tibia and microCT images of the distal mid-mid-epiphysis of femur of Ins2Akita and WT mice of 4,
6 and 12 months. Significant differences could be seen in BV/TV, BS/TV, Tb.N and Tb.Sp bone parameters. The higher bone volume observed in Ins2Akita trabeculae is explained by the increase in trabeculae number
and not trabeculae thickness or size. These results also suggest lower bone resorption; B. Ins2Akita
mice showed a significant increase in trabecular bone volume (BV/TV) of the femur when compared to WT mice at
4, 6 months by microCT analysis; C. Ins2Akita
mice showed a significant increase in trabecular bone volume (BV/TV) of the tibia when compared to WT mice at 4, 6 and 12 months by histomorphometric analysis. 3 animals per group and time point were used for microCT analysis and 5 for histomorphometry evaluation.
*p<0.05, **p<0.001.
Figure 7. ACP5 positive cells are reduced in Ins2Akita
. A. Undecalcified histological sections of proximal mid-epiphysis of the femur of Ins2Akita and WT mice of 4, 6 and 12 months were used for osteoclasts identification by ACP5positive cells; B. ACP5 positive cells were lower in Ins2Akita
when compared to WT. 5 animals per group and time point were evaluated. *p<0.05, **p<0.001.
Figure 8. Altered expression of bone markers in Ins2Akita
. Diabetes in Ins2Akita
induced changes in mRNA gene expression in cartilage and bone; A. Adamst-5 expression is higher at all ages in Ins2Akita suggesting higher
cartilage degradation; B. Col2 expression is reduced at 4 and 6 months in Ins2Akita
in accordance with the lower cartilage matrix area of growth plate; C. Igf1 expression is lower at all ages in Ins2Akita; D. Oc is
downregulated at 4 months in Ins2Akita
; E. Runx2 were downregulated at 4 and 6 months in Ins2Akita
, suggesting lower bone growth. F. Acp5 was found to be downregulated at 4 and 6 months in Ins2Akita.
*p<0.05, **p<0.001. RNA from 5 animals were evaluated per group and time point.
Figure 9. Blood serum concentrations of insulin and leptin are reduced in Ins2Akita mice. Serum concentrations were reduced at 4, 6 and 12 months in Ins2Akita
mice when compared to WT. *p<0.001.