OF THE BEVERAGE FROM CONILON COFFEE Julião Soares de Souza Lima1, Samuel de Assis Silva2 (Received: May 08, 2018; accepted: August 08, 2018)
ABSTRACT: The quality of coffee beverages has been under study due to the demand of the consumer market for both arabica and conilon coffee. The aim of this work was to study beverage quality from different clones by means of sensory analysis, in 13 clones of the variety Victoria INCAPER 8142 produced at average altitudes of 100.0 m and 528.0 m and with the cherry fruits processed by natural drying or depulping. Fuzzy classification was adopted for the global scores obtained in the sensory analysis, on a scale of 70.0 to 100.0 points, with the Euclidean distance from the cluster analysis being used to define the dissimilarity between the global fuzzified scores for the different clones at the two altitudes and for the two methods of processing the fruit. Clones C4 and C10, at the intermediate maturation stage, presented a mean global score (GS) of 85.0 points for the coffee produced at the altitude of 528.0 m and for the depulped fruit, corresponding to a degree of fuzzy pertinence (FI) of 0.50, and being classified as fine coffee. These same clones presented dissimilarities in the beverage produced by the depulped fruit, with better quality for the coffee at the higher altitude. The fuzzy classification taken together with the cluster analysis to interpret the mean global scores (GS) in the sensory analysis of the beverage for the different treatments under study identified variation in beverage quality.
Index terms: Sensory analysis, Coffea canephora, different altitudes.
APLICAÇÃO DA LOGICA FUZZY E ANALISE DE AGRUPAMENTO NA QUALIDADE DA BEBIDA DO CAFÉ CONILON
RESUMO: A qualidade da bebida do café vem sendo estudada em decorrência da exigência do mercado consumidor, tanto para o café arábica como para o café conilon. Neste trabalho objetivou-se estudar, para os 13 clones da variedade Vitória INCAPER 8142 produzidos nas altitudes médias de 100,0 m e 528,0 m e com processamento dos frutos cereja secos em coco e desmucilados, a qualidade da bebida dos diferentes clones por meio da análise sensorial. Adotou-se a classificação fuzzy para as notas globais obtidas na análise sensorial, na escala de 70,0 a 100,0 pontos, e utilizou-se a distância euclidiana oriunda da análise de agrupamento para definir a dissimilaridade entre as notas globais fuzzificadas para os diferentes clones, nas duas altitudes e nos dois processamentos dos frutos. Os clones C4 e C10, do estádio de maturação intermediário, apresentaram nota global média (NG) de 85,0 pontos para o café produzido na altitude de 528,0 m e para os frutos desmucilados, correspondendo a um grau de pertinência fuzzy (IF) de 0,50, classificados como café fino. Estes mesmos clones apresentaram dissimilaridades na bebida produzida pelos frutos desmucilados, com melhor qualidade para o café na maior altitude. A classificação fuzzy associada à análise de agrupamento na interpretação das notas globais médias (NG) da análise sensorial da bebida para os diferentes tratamentos estudados identificou dissimilaridade na qualidade da bebida.
Termos para indexação: Análise sensorial, Coffea canephora, diferentes altitudes.
1 INTRODUCTION
Analysis of the beverage quality of conilon coffee has been the subject of research due to the demands of the domestic and international markets, resulting in value being added to the product based on sensory analysis. Several studies have shown improvements in the sensory quality of the blends without compromising the quality desired by the consumer, as well as in the direct consumption of conilon coffee.
The quality of coffee can be defined as being the sum of all attributes that meet the needs of the consumer (THOMAZINI Eet al. 2011). For conilon coffee, its quality is related to the criteria demanded or even imposed by the market, such
1,2 Universidade Federal do Espirito Santo / UFES - Departamento de Engenharia Rural - Cx P. 16 - 29.500-000 -
Alegre-ES - [email protected], [email protected]
as social and environmental criteria, and those of sustainability, origin, food security, and physical characteristics, in addition to the characteristics of the beverage (PALACIN et al, 2009).
Sensory methods in evaluating food and beverage quality are based on responses to the stimuli that produce sensations, such as: intensity, extension, duration, quality, pleasure and dissatisfaction. While stimuli can be measured by physical and chemical methods, sensations are measured through psychological processes (LANZILLOTTI; LANZILLOTTI, 1999). Borjes, Cavalli and Proença (2010) affirmed that sensory quality of a food relates, at the same time, with the food and with the physiological, psychological and sociological of the appraiser.
2 MATERIAL AND METHODS
The experiment was carried out in two plantations of conilon coffee, known as environments 1 (E1) and 2 (E2), the first with a mean elevation of 528.0 m, located at 20º37’31’’ S and 41º05’23’’ W in the district of São Vicente, and the other with a mean elevation of 100.0 m, located at 20°45’21” S and 41°17’05” W in the district of Pacotuba, both in the town of Cachoeiro de Itapemirim in the State of Espirito Santo, Brasil. The conilon coffee under study came from a set of clones of the Victoria INCAPER 8142 variety, comprising 13 clones classified according to the characteristic of fruit maturation: early clones: 01V (C1e), 06V (C6e), 08V (C8e), 11V (C11e) and 12V (C12e); intermediate clones: 02V (C2i), 03V (C3i), 04V (C4i), 07V (C7i), 09V (C9i) and 10V (C10i); and late clones: 05V (C5l) and 13V (C13l).
The coffee fruit at the cherry stage were harvested manually and selectively by sieve. Harvesting took place from May to August of 2014, when 10 litres of fruit from each clone were harvested in each area, based on the maturation characteristic of the clones.
The harvested cherry fruit were washed and divided into two batches for the two forms of processing: a) depulped fruit (p): wet processing, with mechanical removal of the shell (epicarp) and mucilage, submerging the fruit in clean water in a plastic bucket for 24 h at room temperature to induce natural biological fermentation, the samples were then washed with clean water and placed for pre-drying for 24 h on raised beds to obtain the depulped fruit; and b) natural-dried fruit (d): the fruit with the shell (epicarp) were submerged in clean water, washed, and left for 24 h on raised beds for pre-drying. After both treatments, the fruits were dried in an air circulation and renewal oven at 45oC (± 2ºC) to a water content of 11.5% bu (± 1%).
The dried samples were placed in paper bags and stored for 45 days in a sealed polystyrene box protected against variations in the environment (RIBEIRO, 2013, SILVA et al., 2015). The samples were then peeled by mechanical peeler and 0.30 kg of raw grain from each sample was packed in a silver metallised stand-up pouch.
The sensory analysis was performed by a team of three specialised R-Graders certified by the Coffee Quality Institute (CQI) (2011). The analysis was prepared, and evaluated by cupping test, as per the methodology of the tasting protocol for Coffea canephora Pierre ex A.Froehner (ICO, 2016).
One of the requirements of sensory analysis is a decision about product quality for acceptance in the consumer market, grading the product on a hedonic scale according to a determined protocol that in the case of conilon coffee includes the Coffee Quality Institute (CQI) and the cupping tests carried out by qualified tasters (R-Grader).
Since human perception of quality is possibly undefinable, fuzzy sets that are not limited to a deterministic value have been used as an alternative to the traditional methods of evaluating the results of sensory analysis. As a result, fuzzy logic has been used as a tool in decision-making (LANZILLOTTI; LANZILLOTTI, 1999; LAZIM; SURIANI, 2009; CAVALCANTI et al., 2013; CHOROBURA; CASTANHO;TEIXEIRA, 2016). This method aims to solve problems where information is not well defined, and is based on modelling such problems, translating into mathematical terms the imprecise information contained in the natural language expressed by linguistic variables that can be transformed
(LIMA et al., 2016; SENTÜRK, 2017).
Fuzzy logic aims to treat the uncertainties contained in information; in cases where there are a large number of data, multivariate statistics such as cluster analysis have been used. This explains the variance structure of the information by the construction of linear combinations of that information and the dimensional reduction of the phenomenon under study, where different attributes are grouped together according to the dissimilarities that exist, based on the Euclidean distance between them.
Considering that human sensitivity in defining sensory characteristics by palate and smell is a subjective evaluation, it is necessary, even when following a determined protocol, to include other methods in the analysis, such as fuzzy logic and clustering, with the aim of explicit results and interactions between different tasting arrangements, so as to define quality standards, highlighting the strengths and weaknesses responsible for acceptance or non-acceptance by the market.
With this in mind, the aim of this study was to apply fuzzy classification and clustering to interpretation of the mean global scores of the results of the sensory analysis of the beverage from coffee conilon produced by 13 clones at two different altitudes, and in the post-harvest processing of the cherry fruit by natural drying (d) or depulping (p).
The associative function of fuzzy classification was applied to the mean global score results (GS) of the coffee beverages for the 13 clones, at two altitudes and in two post-harvest processes (drying and depulping), a total of 52 treatments, to determine the degree of linear pertinence (DP) (fuzzy index = FI), as used by Silva and Lima (2009), Souza et al. (2009) and Lima et al. (2018) with soil attributes, as follows:
where: MFA = degree of pertinence (DP = FI) of element Z (beverage) to the fuzzy set; α = q-p; q and p = highest and lowest value of set A (clones, altitude and processes) respectively.
The values of p and q were defined according to the classification of beverage quality as per the tasting protocol for C. canephora of the CQI (2011), UCDA (2010) and ICO (2016) (Table 1). The mean global scores (GS) in the cupping test considered in the set of the total universe were from 70.0 (minimum) to 100.0 (maximum) points. After fuzzification (standardisation) of the results of the sensory analysis, the intervals fell between zero (0.00) and 1.00 (crisp value) respectively, defining the GS (FI) for each beverage value, as shown in the graphical representation in Figure 1. For defuzzification of the data, the following terms were used for the linguistic variable beverage quality (BQ) of conilon coffee: very good coffee (VGC), fine coffee (FC) and exceptional coffee (EC), as shown in Table 1.
The rules of inference used for defuzzification were IF and THEN. IF the degree of pertinence (FI) for each clone (C), at each altitude (A), and for each type of fruit processing (d and p) is between 0.00 to < 0.33, THEN = VGC; When the FI is between ≥ 0.33 to < 0.67, THEN = FC, and when the FI is between ≥ 0.67 to ≤ 1.00, THEN = EC.
In order to verify the dissimilarity between beverage results obtained by sensory analysis for the different treatments, the multivariate analysis method of hierarchical clustering (Joining) was applied, adopting the following procedures:
i) data standardisation: in the data matrix, the value of the ith column (beverage) and jth line (clones, altitudes and processing), called Xij. The corresponding value was considered standardised in the data matrix of fuzzified values, with the data represented in degrees of pertinence (DP = FI). Standardisation was adopted so that the attributes would contribute with the same weight in calculating the coefficient of dissimilarity between them.
ii) choice of the coefficient of similarity: the measure of dissimilarity was adopted using the Euclidean distance (dAB), since the lower the value, the closer the beverage results between the different treatments. The Euclidean distance (dAB) was determined by equation 4, between the accessions for the attribute (beverage) set under study:
where: X1A = value of the attribute (beverage) of clone 1 for condition one (1,0) A; X1B = value of the attribute (beverage) of clone 1 for condition two (2) B; XmA and XmB = value of the attribute (beverage) of clone m for condition A and B.
iii) Grouping strategy: Ward’s method was used, which forms groups by seeking to minimise the sum of the differences between the elements of each group and the mean value of the group, minimising the standard deviation between the data of each formed group.
3 RESULTS AND DISCUSSION
The mean global scores (GS) obtained from the sensory analysis (SA), the cupping test, are shown in Table 2, together with their respective degrees of pertinence (DP = FI) after applying the fuzzy classification.
In environment 1 (E1), for the clonal conilon coffee in the depulping process (p), the maximum GS was 85.0 for C4i and C10i, both clones with an intermediate stage of maturation. For the natural-dried fruit (d), C4i again had the highest GS, with 84.0 points.
In environment 2 (E2), the highest GS for the depulped fruits (p) was 80.0 points, obtained by C2i, C4i and C5l. For the natural-dried fruits (d), clones C12e, C3i and C5l had a GS of 80.0 points and C4i a score of 82 points. In general, clone C4i presented the highest GS irrespective of the environment (altitude) or process. As this is an intermediate clone (i), it can be inferred that this fruit maturation stage indicates suitable plant physiology for favouring a better beverage.
(1)
(4)
(3)
(2)
TABLE 1 - Classification of beverage quality for Coffea canephora
Mean global score Quality description
90.0 ≤ EC ≤ 100.0 Exceptional coffee (EC)
80.0 ≤ FC < 90.0 Fine coffee (FC)
70.0 ≤ VGC < 80.0 Very good coffee (VGC)
Source: Adapted from CQI (2011), UCDA (2010) e ICO (2016)
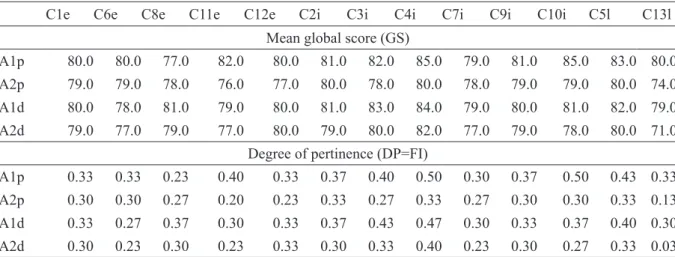
FIGURE 1 - Graphical representation of the pertinence function for the scale of quality scores of conilon coffee. TABLE 2 - GS results for each clone at the two altitudes in the processes of depulping (p) and natural drying (d), with their respective degrees of pertinence (DP = FI) (fuzzy) for beverage potential.
C1e C6e C8e C11e C12e C2i C3i C4i C7i C9i C10i C5l C13l
Mean global score (GS)
A1p 80.0 80.0 77.0 82.0 80.0 81.0 82.0 85.0 79.0 81.0 85.0 83.0 80.0 A2p 79.0 79.0 78.0 76.0 77.0 80.0 78.0 80.0 78.0 79.0 79.0 80.0 74.0 A1d 80.0 78.0 81.0 79.0 80.0 81.0 83.0 84.0 79.0 80.0 81.0 82.0 79.0 A2d 79.0 77.0 79.0 77.0 80.0 79.0 80.0 82.0 77.0 79.0 78.0 80.0 71.0
Degree of pertinence (DP=FI)
A1p 0.33 0.33 0.23 0.40 0.33 0.37 0.40 0.50 0.30 0.37 0.50 0.43 0.33 A2p 0.30 0.30 0.27 0.20 0.23 0.33 0.27 0.33 0.27 0.30 0.30 0.33 0.13 A1d 0.33 0.27 0.37 0.30 0.33 0.37 0.43 0.47 0.30 0.33 0.37 0.40 0.30 A2d 0.30 0.23 0.30 0.23 0.33 0.30 0.33 0.40 0.23 0.30 0.27 0.33 0.03 C: clone; e: early; i: intermediate; l: late; A1: area at an average altitude of 528.0 m; A2: area at an average altitude of 100.0 m; p: depulped coffee fruit and d: natural-dried coffee fruit
From the results obtained with the fuzzy inference (Table 2), it can be seen that the highest values for the fuzzy index (FI) are in the clones that obtained the highest GS due to adoption of the linear model.
At altitude A1, according to the inference adopted for ‘very good coffee’ (VGC) (FI between 0.00 and < 0.33) in the depulped condition (p), THEN includes clones C8e (FI = 0.23) and C7i (FI = 0.30), while the remainder are THEN grouped
in the fine coffee class (FC), with FI between ≥ 0.33 and < 0.67. For the natural-dried fruit (d), clones C6e (FI = 0.27), C11e (FI = 0.30), C7i (FI = 0.30) and C13l (FI = 0.30) are THEN classed as VGC with FI between 0.00 and < 0.33. The other clones are THEN in the FC class, with FI between ≥ 0.33 and < 0.67. This is related to the natural fruit-drying process (d) that contributed to a fall in beverage quality, which increased the number of clones in the VGC class.
coffee produced in A2 under both methods of fruit processing, 23.1% were in the FC class. These results reinforce the idea that beverage quality, as measured in the sensory analysis, shows a gain for clonal conilon coffee in area A1 when depulped (p). According to Silva et al. (2014), the environment has a great effect on the quality of coffee beverages, contributing to a qualitative improvement in the roasted beans, regardless of the variety grown.
Crops grown at higher altitudes tend to produce sweeter coffees with higher quality scores, and can be discriminated from those cultivated at lower altitudes (SILVA et al., 2016). Ricci, Cocheto Junior and Almeida (2013) explained that, among other factors, those of climate are the most important for the expression of the qualitative standards of coffees grown in environments at higher altitudes. According to those authors, maturation occurs more slowly due to the lower temperatures, which favours the physiological development of the fruit.
In the cluster analysis, a cut-off distance of 0.40 was defined for each treatment under study, forming three groups of clone accessions. For any one clone, its presence in different groups defined it as being dissimilar in relation to beverage for the treatment under consideration. The dissimilarities that exist (Table 3) for the depulped fruit (p) when produced at different altitudes were determined from the Euclidean distance ≥ 0.14. That is, clones C11e, C12e, C3i, C4i, C10i, C5l and C13l have higher GS when produced at altitude 1 (A1) and with the fruit depulped (p). When considering the maturation stage, clones C11e and C13l showed a greater reduction (greater dAB) for beverage in relation to the change in altitude. This greater dAB is reflected in the highest and lowest values for FI between the two processes employed: the clones C4ip (i = intermediate, p = depulped) and C10ip, compared to C13ld (l = late, d = dried).
Silva et al. (2014), delimiting terroirs in plantations of arabica coffee, verified that at higher altitudes there are microclimates that are more propitious to the production of special coffees. The quality scores tend to be more homogeneous, a similar behaviour to that seen in this study for conilon coffee. Broadly speaking, conilon coffee plants are grown in areas of lower altitude and higher temperature, which has traditionally meant lower sensory quality. It is evident from the results of the above work, that cultivation at higher altitudes, as in arabica coffee, also favours an increase in the beverage quality of conilon coffee. At altitude 2 (A2), clones C2i, C4i and C5l
for the depulped fruits (p) are THEN grouped in the FC class, with FI equal to 0.33. For the natural-dried fruits (d), clones C12e (FI = 0.33), C3i (FI = 0.33), C4i (FI = 0.40) and C5l (FI = 0.33) are THEN grouped in the FC class. These results indicate to the producer that, a priori, the work of depulping the fruit is not viable when the aim is to improve beverage quality.
Depulping the fruit of the clonal coffee produced at the higher altitude provided 11 of the 13 clones in the fine coffee class (FC). It should be noted that under the conditions of the study, none of the clones were classified as ‘exceptional coffee’ (EC).
In Figure 2 it is shown the distribution of the fuzzy index (FI) for the 13 clones, where it can be seen that the two internal curves refer to the results obtained at altitude 2 (A2), for both the depulped (p) and the natural-dried coffee (d). The product obtained from the sensory analysis (SA) highlighted the C4i and C10i clones as having an FI of 0.50 when the fruits were depulped (p), showing them to be half the value of an exceptional coffee (EC).
Despite the greatest values for FI at altitude 1 having been seen for all samples in the depulped clones, the difference for the same clones when natural-dried was small, showing that the post-harvest processing to be adopted by the producer should be well thought out, taking into account the market price of quality coffees. Lima Filho et al. (2013) evaluated the physico-chemical and sensory quality of conilon coffee processed by different methods and concluded it was possible to obtain superior beverages for natural-dried coffees.
More important than the post-harvest processing of conilon coffee appears to be the maturation stage, since greater values for FI were seen in the intermediate clones. Early clones had the smallest overall scores, showing that the reddish colour of the shell did not ensure the physiological maturation of the fruit and thus provide better beverage quality, seeing that the harvest was selective and the sensory analysis considered only the cherry fruit.
Similar behaviour to that discussed for the early clones (e) was seen in the late (l) clones. For the C13l clone in A2, the GS and the FI were lower in the dried samples, also showing little effect from depulping on improving beverage quality.
For the combinations of clonal coffee produced in A1 when the fruits were depulped (p) and natural-dried (d), 84.6% and 69.2% respectively were in the FC class. Whereas for the
FIGURE 2 - Radar chart of the fuzzy classification (FI) of GS obtained in the sensory analysis of the beverage from clonal conilon coffee.
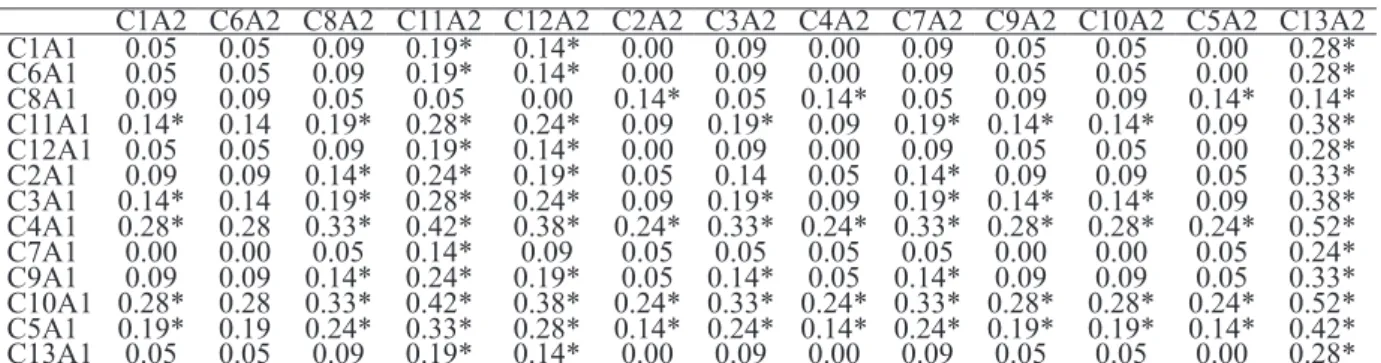
TABLE 3 - Euclidean distance (dAB) for the GS for beverage (fuzzified) of clones in the depulping process (p) at different altitudes (A1 and A2)
C1A2 C6A2 C8A2 C11A2 C12A2 C2A2 C3A2 C4A2 C7A2 C9A2 C10A2 C5A2 C13A2 C1A1 0.05 0.05 0.09 0.19* 0.14* 0.00 0.09 0.00 0.09 0.05 0.05 0.00 0.28* C6A1 0.05 0.05 0.09 0.19* 0.14* 0.00 0.09 0.00 0.09 0.05 0.05 0.00 0.28* C8A1 0.09 0.09 0.05 0.05 0.00 0.14* 0.05 0.14* 0.05 0.09 0.09 0.14* 0.14* C11A1 0.14* 0.14 0.19* 0.28* 0.24* 0.09 0.19* 0.09 0.19* 0.14* 0.14* 0.09 0.38* C12A1 0.05 0.05 0.09 0.19* 0.14* 0.00 0.09 0.00 0.09 0.05 0.05 0.00 0.28* C2A1 0.09 0.09 0.14* 0.24* 0.19* 0.05 0.14 0.05 0.14* 0.09 0.09 0.05 0.33* C3A1 0.14* 0.14 0.19* 0.28* 0.24* 0.09 0.19* 0.09 0.19* 0.14* 0.14* 0.09 0.38* C4A1 0.28* 0.28 0.33* 0.42* 0.38* 0.24* 0.33* 0.24* 0.33* 0.28* 0.28* 0.24* 0.52* C7A1 0.00 0.00 0.05 0.14* 0.09 0.05 0.05 0.05 0.05 0.00 0.00 0.05 0.24* C9A1 0.09 0.09 0.14* 0.24* 0.19* 0.05 0.14* 0.05 0.14* 0.09 0.09 0.05 0.33* C10A1 0.28* 0.28 0.33* 0.42* 0.38* 0.24* 0.33* 0.24* 0.33* 0.28* 0.28* 0.24* 0.52* C5A1 0.19* 0.19 0.24* 0.33* 0.28* 0.14* 0.24* 0.14* 0.24* 0.19* 0.19* 0.14* 0.42* C13A1 0.05 0.05 0.09 0.19* 0.14* 0.00 0.09 0.00 0.09 0.05 0.05 0.00 0.28* C: clone; A1: production area at the higher altitude and A2: production area at the lower altitude; *: Euclidean distance that shows dissimilarity between clones
In the environment at the higher altitude (A1), considering the two methods of fruit processing, the dissimilarities that exist (Table 4) for the depulped (p) and natural-dried fruit (d) at altitude 1 (A1) were determined from the Euclidean distance ≥ 0.14. It can be seen that only clones C8e, C11e and C10i showed dissimilarity for beverage. The C8e clone presented a beverage gain in the drying process, and the C4i clone showed no dissimilarity between processes, maintaining the highest score in both, thereby forming part of a single group. The absence of dissimilarity for the two processes reinforces the above comment concerning the small qualitative gain obtained when depulping the fruit of conilon coffee. Because it is a less laborious process and requires less care, and provided that only cherry fruits are harvested, the results of this research point to the recommendation of natural processes (natural-dried coffee), taking into consideration the maturation stage, unless the financial gain for
depulped coffee is far greater for a small variation in GS.
Table 5 shows the Euclidean distances (dAB) for the fuzzified quality of the natural-dried (d) coffee fruit from clones produced at altitude 1 (A1) and altitude 2 (A2) respectively.
In these treatments, distances ≥ 0.09 characterised a variation in the final beverage value, representing dissimilarities for clones C8e, C11e, C2i, C3i, C4i, C7i, C10i, C5l and C13l, the greatest distance being obtained for clone C13t, with a value of 0.38. This characterises a similar behaviour when the fruits were depulped and compared between environments, i.e. the beverage potential for this clone is higher when produced at the higher altitude; in A1 and depulped the clone was classified as FC, and when dried, as VGC. The classes that describe coffee quality in the classification key (Table 1) represent financial gain to the producer, an important point to be kept in mind.
Table 6 shows the results for Euclidean distance ≥ 0.09, which presented dissimilarity for the fuzzified beverage in clones of conilon coffee at altitude 2, for the depulped dried fruit (p) and the natural-dried fruit (d).
Among all the clones under study, C12e and C4i at altitude 2 (A2) had a Euclidean distance of 0.14 and 0.09 respectively, indicating
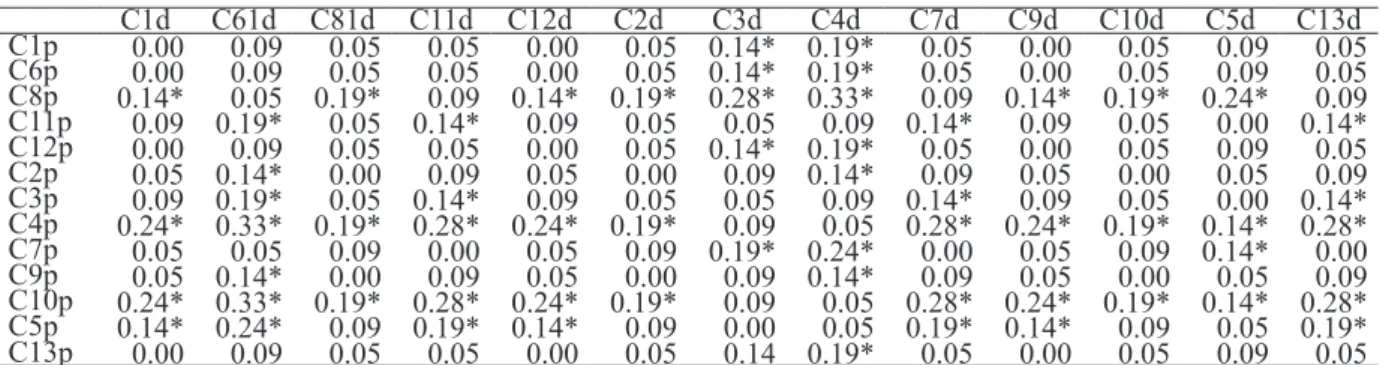
TABLE 4 - Euclidean distance between the GS for beverage (fuzzified) of clones at altitude 1 (A1) in the processes of depulping (p) and natural drying (d) .
C1d C61d C81d C11d C12d C2d C3d C4d C7d C9d C10d C5d C13d C1p 0.00 0.09 0.05 0.05 0.00 0.05 0.14* 0.19* 0.05 0.00 0.05 0.09 0.05 C6p 0.00 0.09 0.05 0.05 0.00 0.05 0.14* 0.19* 0.05 0.00 0.05 0.09 0.05 C8p 0.14* 0.05 0.19* 0.09 0.14* 0.19* 0.28* 0.33* 0.09 0.14* 0.19* 0.24* 0.09 C11p 0.09 0.19* 0.05 0.14* 0.09 0.05 0.05 0.09 0.14* 0.09 0.05 0.00 0.14* C12p 0.00 0.09 0.05 0.05 0.00 0.05 0.14* 0.19* 0.05 0.00 0.05 0.09 0.05 C2p 0.05 0.14* 0.00 0.09 0.05 0.00 0.09 0.14* 0.09 0.05 0.00 0.05 0.09 C3p 0.09 0.19* 0.05 0.14* 0.09 0.05 0.05 0.09 0.14* 0.09 0.05 0.00 0.14* C4p 0.24* 0.33* 0.19* 0.28* 0.24* 0.19* 0.09 0.05 0.28* 0.24* 0.19* 0.14* 0.28* C7p 0.05 0.05 0.09 0.00 0.05 0.09 0.19* 0.24* 0.00 0.05 0.09 0.14* 0.00 C9p 0.05 0.14* 0.00 0.09 0.05 0.00 0.09 0.14* 0.09 0.05 0.00 0.05 0.09 C10p 0.24* 0.33* 0.19* 0.28* 0.24* 0.19* 0.09 0.05 0.28* 0.24* 0.19* 0.14* 0.28* C5p 0.14* 0.24* 0.09 0.19* 0.14* 0.09 0.00 0.05 0.19* 0.14* 0.09 0.05 0.19* C13p 0.00 0.09 0.05 0.05 0.00 0.05 0.14 0.19* 0.05 0.00 0.05 0.09 0.05 C: clones; p: dried depulped fruit and d: natural-dried fruit; *: Euclidean distance that shows dissimilarity between clones
TABLE 5 - Euclidean distance between the GS for beverage (fuzzified) of natural-dried (d) clones at altitude 1 (A1) and altitude 2 (A2)
C1A2 C6A2 C8A2 C11A2 C12A2 C2A2 C3A2 C4A2 C7A2 C9A2 C10A2 C5A2 C13A2 C1A1 0.05 0.14* 0.05 0.14* 0.00 0.05 0.00 0.09* 0.14* 0.05 0.09* 0.00 0.42* C6A1 0.05 0.05 0.05 0.05 0.09 0.05 0.09* 0.19* 0.05 0.05 0.00 0.09* 0.33* C8A1 0.09* 0.19* 0.09* 0.19* 0.05 0.09* 0.05 0.05 0.19* 0.09* 0.14* 0.05 0.47* C11A1 0.00 0.09* 0.00 0.09* 0.05 0.00 0.05 0.14* 0.09 0.00 0.05 0.05 0.38* C12A1 0.05 0.14* 0.05 0.14* 0.00 0.05 0.00 0.09* 0.14* 0.05 0.09* 0.00 0.42* C2A1 0.09* 0.19* 0.09* 0.19* 0.05 0.09* 0.05 0.05 0.19* 0.09* 0.14* 0.05 0.47* C3A1 0.19* 0.28* 0.19* 0.28* 0.14* 0.19* 0.14* 0.05 0.28* 0.19* 0.24* 0.14* 0.57* C4A1 0.24* 0.33* 0.24* 0.33* 0.19* 0.24* 0.19* 0.09* 0.33* 0.24* 0.28* 0.19* 0.61* C7A1 0.00 0.09* 0.00 0.09* 0.05 0.00 0.05 0.14* 0.09* 0.00 0.05 0.05 0.38* C9A1 0.05 0.14* 0.05 0.14* 0.00 0.05 0.00 0.09* 0.14* 0.05 0.09* 0.00 0.42* C10A1 0.09* 0.19* 0.09* 0.19* 0.05 0.09* 0.05 0.05 0.19* 0.09* 0.14* 0.05 0.47* C5A1 0.14* 0.24* 0.14* 0.24* 0.09* 0.14* 0.09* 0.00 0.24* 0.14* 0.19* 0.09* 0.52* C13A1 0.00 0.09* 0.00 0.09* 0.05 0.00 0.05 0.14* 0.09* 0.00 0.05 0.05 0.38* C: clone; A1: production area at the higher altitude and A2: production area at the lower altitude; *: Euclidean distance that shows dissimilarity between clones
dissimilarity between the natural-drying method of fruit processing in relation to depulping, i.e. with an increase in GS for the natural-dried coffee. A shorter Euclidean distance can be seen in environment 2 for any one clone in the different processes, indicating that depulping is not a practice to be used in processing the fruit.
TABLE 6 - Euclidean distance between the GS for beverage (fuzzified) of clones grown at altitude 2 (A2) for depulped (p) and natural-dried (d) fruit
C1d C6d C8d C11d C12d C2d C3d C4d C7d C9d C10d C5d C13d C1p 0.00 0.09* 0.00 0.09* 0.05 0.00 0.05 0.14* 0.09* 0.00 0.05 0.05 0.38* C6p 0.00 0.09* 0.00 0.09* 0.05 0.00 0.05 0.14* 0.09* 0.00 0.05 0.05 0.38* C8p 0.05 0.05 0.05 0.05 0.09* 0.05 0.09* 0.19* 0.05 0.05 0.00 0.09* 0.33* C11p 0.14* 0.05 0.14* 0.05 0.19* 0.14* 0.19* 0.28* 0.05 0.14* 0.09* 0.19* 0.24* C12p 0.09* 0.00 0.09* 0.00 0.14* 0.09* 0.14* 0.24* 0.00 0.09* 0.05 0.14* 0.28* C2p 0.05 0.14* 0.05 0.14* 0.00 0.05 0.00 0.09* 0.14* 0.05 0.09* 0.00 0.42* C3p 0.05 0.05 0.05 0.05 0.09* 0.05 0.09* 0.19* 0.05 0.05 0.00 0.09* 0.33* C4p 0.05 0.14* 0.05 0.14* 0.00 0.05 0.00 0.09* 0.14* 0.05 0.09* 0.00 0.42* C7p 0.05 0.05 0.05 0.05 0.09* 0.05 0.09* 0.19* 0.05 0.05 0.00 0.09* 0.33* C9p 0.00 0.09 0.00 0.09* 0.05 0.00 0.05 0.14* 0.09* 0.00 0.05 0.05 0.38* C10p 0.00 0.09 0.00 0.09* 0.05 0.00 0.05 0.14* 0.09* 0.00 0.05 0.05 0.38* C5p 0.05 0.14* 0.05 0.14* 0.00 0.05 0.00 0.09* 0.14* 0.05 0.09* 0.00 0.42* C13p 0.24* 0.14* 0.24* 0.14* 0.28* 0.24* 0.28* 0.38* 0.14* 0.24* 0.19* 0.28* 0.14* C: clone; p: depulped fruit; c: natural-dried fruit; *: Euclidean distance that shows dissimilarity between clones
4 CONCLUSIONS
In the sensory analysis, the clones of conilon coffee (Vitoria) present different global scores for beverage depending on altitude and post-harvest fruit processing. Clones 4 (C4i) and 10 (C10i), of intermediate maturation, had a score of 85.0 for the depulped fruit, cultivated at an altitude of 528.0 m.
In the fuzzy classification, 84.6% and 69.2% of the different clones produced in environment 1 (altitude of 528.0 m) were classified as ‘fine coffee’ (FC) for the depulped (p) and natural-dried (d) fruit respectively. In the A2 environment (altitude of 100.0 m), 23.1% were obtained in the two processes with the clones classified as ‘fine coffee’ (FC).
The fuzzy classification taken together with the cluster analysis to interpret the global scores in the sensory analysis of the beverage for the different treatments under study identified dissimilarity in beverage quality between the different clones.
5 ACKNOWLEDGMENTS
The authors wish to thank CNPq and FAPES for the financial resources made available to carry out this research.
6 REFERENCES
BORJES, L. C.; CAVALLI, S. B.; PROENÇA, R. P. C. Proposta de classificação de vegetais considerando características nutricionais, sensoriais e de técnicas de preparação. Revista Nutrição, Campinas, v. 23 n. 4, p. 645-654, July./Aug. 2010.
CAVALCANTI, M. T. et al. Aplicação da lógica fuzzy na análise sensorial de pão de forma enriquecido. Revista Brasileira de Engenharia Agrícola e Ambiental, Campina Grande, v. 17, n. 2, p. 208-215, Feb. 2013.
CHOROBURA, F.; CASTANHO, M. J. P.; TEIXEIRA, A. M. Análise Sensorial utilizando um sistema baseado em regras fuzzy. In: IV Congresso Brasileiro de Sistemas Fuzzy, 2016, Campinas. IV Congresso Brasileiro de Sistemas Fuzzy, 2016, v. 1, p. 114-116. COFFEE QUALITY INSTITUTE (CQI). Fine Robusta Coffee Standards and Protocols. Available in: <https:// coffeestrategies.com/wp-content/uploads/2015/04/ compiled-standards-distribute1.1.pdf>. Acces on: 20 de novembro de 2017.
INTERNATIONAL COFFEE ORGANIZATION (ICO). Trade Statistics Tables. 2017. Available in: <http://www.ico.org/trade_statistics.asp>. Acces on: 11 de outubro de 2017.
LAZIM M. A.; SURIANI, M. Sensory evaluation of the selected coffee products using fuzzy approach. World Academy of Science, Engineering and Technology International Journal of Mathematical and Computational Sciences, v. 50, n. 2. p. 133–136, 2009. LIMA FILHO, T. et al. Composição físico-química e qualidade sensorial de café conilon produzido no Estado do Espírito Santo e submetido a diferentes formas de processamento. Semina: Ciências Agrárias, Londrina, v. 34, n. 4, p. 1723-1730, July./Aug. 2013. LIMA, J. S. S. et al. Fuzzy Classification in the Determination of Input Application Zones. Revista Brasileira de Ciência do Solo, Viçosa, v. 40, p. 1-15, 2016.
LIMA, J. S. S. et al. Fuzzy logic and geostatistics in studying the fertility of soil cultivated with the rubber tree. Revista Ciência Agronômica, Fortaleza, v. 49, n. 2, p. 228-238, Apr./June. 2018.
PALACIN, J. J. F. et al. Secagem combinada de café cereja descascado. Revista Engenharia na Agricultura, Viçosa, v. 17, n. 3, p. 244-258, May./ June. 2009.
RIBEIRO, F. C. Métodos alternativos para armazenamento de cafés especiais. 2013. 109 p. Tese (Doutorado em Engenharia Agrícola) - Universidade Federal de Lavras, Lavras, 2013.
RICCI, M. S. F.; COCHETO JUNIOR, D. G. C.; ALMEIDA, F. F. D. Microweather conditions, phenology and external morphology of coffee trees in shaded and full sun systems. Coffee Science, Lavras, v. 8, n. 3, p. 379-388, July./Sept. 2013.
SENTÜRK, S. Construction of fuzzy c control charts based on fuzzy rule method. Anadolu University Journal of Science and Technology, v. 18, n. 3, p. 563-572, 2017.
SILVA, S. A; LIMA, J. S. S. Lógica fuzzy no mapeamento de variáveis indicadoras de fertilidade do solo. IDESIA, Arica, v. 27, n. 3, p. 41- 46, Sept./Dec. 2009.
SILVA, L. C.; MORELI, A. P.; JOAQUIN, T. N. M. Café: beneficiamento e industrialização. In: MARCOLAN, A. L.; ESPINDULA, M. C. (Org.). Café na Amazônia. 1a ed.
Brasilia, EMBRAPA Rondônia, 2015. Cap. 17, p. 383-398. SILVA, S. A. et al. Mapping the potential beverage quality of coffee produced in the Zona da Mata, Minas Gerais, Brazil. Journal of Science of Food and Agriculture, v. 96, n. 9, p. 3098-3108, July. 2016. SILVA, S. A. et al. Characterization and delimitation of the terroir coffee in plantations in the municipal district of Araponga, Minas Gerais, Brazil. Revista Ciência Agronômica, Fortaleza, v. 45, n. 1, p. 18-26, Jan./Mar. 2014.
SOUZA, G. S. et al. Aplicação de lógica fuzzy e geoestatística na análise da fertilidade de um solo sob pastagem. Revista Ciência Agronômica, Fortaleza, v. 40, n. 3, p. 323-330, July./Sept. 2009.
THOMAZINI, A. et al. Abordagem sobre qualidade da bebida no café conilon. Enciclopédia Biosfera, v. 7, n. 12, p. 1-16, 2011.
UGANDA COFFEE DEVELOPMENT AUTHORITY- UCDA. Protocolos para degustação do robusta. Junho de 2010. Available in: <http://www.ico.org/ documents/pscb-123-p-robusta.pdf>. Access on: 11 de outubro de 2017.