1 1
Differential mesenteric fat deposition in bovines fed on silage or 2
concentrate is independent of glycerol membrane permeability 3
4
A.P. Martins1a, P.A. Lopes2a, A.S.H. Costa2, S.V. Martins2, N.C. Santos3, J.A.M. 5
Prates2, T.F. Moura1, G.Soveral1,4* 6
7
1 REQUIMTE, Dep. Química, FCT-UNL, 2829-516 Caparica, Portugal 8
2 CIISA, Faculdade de Medicina Veterinária, Universidade Técnica de Lisboa, 9
1300-477 Lisboa, Portugal 10
3 Instituto de Medicina Molecular, Faculdade de Medicina, Universidade de 11
Lisboa, 1649-028 Lisboa, Portugal 12
4 Faculdade de Farmácia, Universidade de Lisboa, 1649-003 Lisboa, Portugal 13
14
* Corresponding author: 15
Graça Soveral, E-mail: gsoveral@ff.ul.pt; soveral@dq.fct.unl.pt 16
17
a Authors who contributed equally. 18
19 20
Running Head: 21
Membrane permeability in bovines´mesenteric fat 22
23 24
2 25
Abstract 26
In the meat industry, the manipulation of fat deposition in cattle is of pivotal 27
importance to improve production efficiency, carcass composition and ultimately 28
meat quality. There is an increasing interest in the identification of key factors 29
and molecular mechanisms responsible for the development of specific fat 30
depots. This study aimed at elucidating the influence of breed and diet on 31
adipose tissue membrane permeability and fluidity and their interplay on fat 32
deposition in bovines. Two Portuguese autochthonous breeds, Alentejana and 33
Barrosã, recognized as late and early maturing breeds, respectively, were 34
chosen to examine the effects of breed and diet on fat deposition and on 35
adipose membrane composition and permeability. Twenty-four male bovines 36
from these breeds were fed on silage- or concentrate-based diets for 11 37
months. Animals were slaughtered to determine their live slaughter and hot 38
carcass weights, as well as weights of subcutaneous and visceral adipose 39
depots. Mesenteric fat depots were excised and used to isolate adipocyte 40
membrane vesicles where cholesterol content, fatty acid profile as well as 41
permeability and fluidity were determined. Total accumulation of neither 42
subcutaneous nor visceral fat was influenced by breed. In contrast, mesenteric 43
and omental fat depots weights were higher in concentrate-fed bulls relative to 44
silage-fed animals. Membrane fluidity and permeability to water and glycerol in 45
mesenteric adipose tissue were found to be independent of breed and diet. 46
Moreover, the deposition of cholesterol and unsaturated fatty acids, which may 47
influence membrane properties, were unchanged among experimental groups. 48
Adipose membrane lipids from the mesenteric fat depot of ruminants were rich 49
3 in saturated fatty acids, and unaffected by polyunsaturated fatty acids (PUFA) 50
dietary levels. Our results provide evidence against the involvement of cellular 51
membrane permeability to glycerol on fat accumulation in mesenteric fat tissue 52
of concentrate-fed bovines, which is consistent with the unchanged membrane 53
lipid profile found among experimental groups. 54
55 56
Keywords: adipose membrane, glycerol permeability, membrane fluidity, lipid 57
composition, bovine breeds 58
59
Implications 60
Visceral fat deposition has been considered an important factor in cattle 61
finishing. As maturing proceeds, large amounts of mesenteric fat can be 62
deposited leading to production inefficiencies, which can jeopardize meat 63
quality. Yet, no studies addressing fatty acid incorporation at the cell membrane 64
and its outcome on membrane physical properties, including rigidity and 65
permeability to water and solutes, are available for ruminants. This study 66
exploits the membrane fluidity and permeability to glycerol, a key substrate 67
involved in lipogenesis, while an underlying mechanism for differential visceral 68
fat deposition in bovines as influenced by breed or diet. 69
70 71 72 73
4 74
Introduction 75
Traditional meats with Protected Designation of Origin (PDO), derived from 76
local extensive production systems and autochthonous breeds, have the 77
certification of EU legislation due to their supposed quality and sensory traits, 78
which have been associated with their specific lipid fraction properties (Council 79
Regulation nº 2081/92 of 14/7, EEC). Curiously, the scientific information 80
available to sustain the claimed quality, mainly dependent on its lipid 81
composition, is scarce. On the other hand, the manipulation of adipose tissue 82
deposition in cattle has represented for many years a major breeding goal as a 83
future guarantee for the improvement of production efficiency, visceral fat 84
partitioning, carcass composition and meat quality (De Smet et al., 2004). The 85
identification of key factors and molecular mechanisms responsible for the 86
development of specific fat depots (Azain, 2004) in autochthonous bovine 87
breeds is necessary, in particular mechanisms underlying visceral fat 88
accumulation in young bulls with distinct precociousness, Alentejana and 89
Barrosã, known as late and early maturing breeds, respectively (da Silva et al., 90
1998). Precociousness is intimately related to adipose tissue deposition in 91
meat-producing animals, as early-maturing breeds deposit noticeable amounts 92
of marbling fat before late-maturing breeds (Hocquette et al., 2010). 93
The degree of saturation of plasma membrane acyl chains might be among the 94
primary events in adipocyte differentiation (Stubbs and Smith, 1984). 95
Nevertheless, literature addressing bovines´ fatty acid deposition at the cell 96
membrane level and its outcome on membrane physical properties is 97
unavailable. Given that the membrane bilayer permeability to water and solutes 98
5 is tightly related to phospholipid composition and membrane fluidity (Lande et 99
al., 1995), it seems reasonable that distinct fat depots with specific metabolic 100
characteristics would affect membrane physical properties. Fatty acid 101
incorporation into cellular membranes is known to affect permeability to water 102
and, most importantly, to glycerol (Soveral et al., 2009; Martins et al., 2010). It is 103
well established that glycerol is a key substrate for lipogenesis and lipolysis in 104
adipose tissues of ruminants. The concept of membrane permeability and 105
fluidity could therefore be critical for understanding membrane structure-106
function. 107
Specific genetic characteristics have been also described, with the purebred 108
Alentejana breed considered phylogenetically distant from the purebred Barrosã 109
breed (Beja-Pereira et al., 2003). Large differences on the levels of 110
intramuscular fat in Alentejana and Barrosã bovines were previously reported 111
by our group, with values of Alentejana breed (1.2%) nearly half of the other 112
(2.3%) (Alfaia et al., 2007; Alfaia et al., 2009). Studies in humans and mice 113
(Field and Clandinin, 1984; Field et al., 1988) demonstrated that dietary fat can 114
alter adipose cell membrane composition. Thus, the structure and physiological 115
properties of the adipocyte membrane may be changed. The goal of the present 116
study was to assess the effect of breed and diet on fat deposition, as well as on 117
the lipid composition, permeability and fluidity of adipocyte membranes. 118
119
Material and Methods 120
Experimental design: animals and diets
121
The experimental design included 24 male bovines from two philogenetically 122
distant autochthonous breeds, the late-maturing breed, Alentejana, and the 123
6 early-maturing breed, Barrosã, allocated to silage- or concentrate-based diets 124
(four experimental groups of 6 animals each) from January to November 2009. 125
At the beginning of the experiment, Alentejana bulls were 332 ± 10.2 days old 126
(initial weight of 275 ± 15.6 kg) and Barrosã bulls were 268 ± 2.96 days old 127
(initial weight of 217 ± 4.57 kg). Bulls were fed two experimental diets 128
composed by 70/30% and 30/70% of corn silage and concentrate, respectively. 129
The proximate composition and fatty acid profile in both experimental diets (n = 130
3) are shown in Table 1. 131
Bulls were slaughtered at 18 months of age at the INRB Experimental Abattoir 132
by exsanguination after stunning with a cartridge-fired captive bolt stunner. The 133
amount of subcutaneous fat was determined by dissection of the leg joint. The 134
former has been suggested to be representative of the overall bovine carcass 135
composition in these particular breeds (Simões and Mendes, 2003). Mesenteric, 136
omental and kidney knob and channel fat (KKCF) depots were excised and 137
weighed. Samples from the mesenteric fat were collected, flash-frozen in liquid 138
nitrogen, and stored at -80 ºC for subsequent analysis. 139
The entire experiment was conducted under the guidelines for the care and use 140
of experimental animals in the Unidade de Produção Animal, L-INIA, INRB 141
(Fonte Boa, Vale de Santarém, Portugal). 142
143
Preparation of membrane vesicles from bovine´s mesenteric fat
144
Membrane vesicles from bovine´s mesenteric fat were prepared by differential 145
centrifugation with buffer without detergents, according to (Martins et al., 2010). 146
Briefly, approximately 20 g of fat tissue from each bovine was chopped into 147
small pieces, removing visible blood vessels, and homogenized in 200 ml 148
7 mannitol-Hepes buffer (100 mM mannitol, 10 mM Tris-Hepes, pH 7.4) in a 149
Warring blender for 2 min. The homogenate was filtered through a 70 µm nylon 150
mesh to separate the vascular stroma and intracellular fat retained in the filter. 151
The filtrate was centrifuged at 46000 × g for 45 min at 10 ºC to obtain a pellet of 152
crude membranes and further washed in the same buffer. The membrane pellet 153
was then resuspended in mannitol-Hepes buffer, transferred to a syringe and 154
sheared by vigorously passing it 10 times through a 21-gauge needle and 155
immediately used for transport experiments. Protein content was determined by 156
the Bradford method (Bradford, 1976). The vesicle size of all membrane 157
preparations was determined by Dynamic Light Scattering (DLS) (Brookhaven 158
Inst. BI-90). 159
160
Fatty acid composition and cholesterol concentration of adipose
161
membranes
162
After membrane vesicle lyophilisation (at -60 °C and 2.0 hPa), fatty acids were 163
converted to methyl esters (FAME) (Raes et al., 2001; Christie et al., 2007). The 164
resulting FAME were then analyzed by gas chromatography (GC), using a 165
capillary column (Omegawax 250; 30 m × 0.25 mm i.d., 0.25 mm film thickness; 166
Supelco, Bellefont, CA, USA), equipped with a flame-ionization detector. The 167
chromatographic conditions were described in detail elsewhere (Alves and 168
Bessa, 2009). The fatty acid composition was expressed as g/100 g of total fatty 169
acids identified. 170
Total cholesterol was extracted from lyophilised adipose membrane vesicles 171
through a direct saponification with saturated methanolic KOH solution (Naeemi 172
et al., 1995). Cholesterol was separated and identified using high performance 173
8 liquid chromatography (HPLC) equipment (Agilent 1100 Series, Agilent 174
Technologies Inc., Palo Alto, CA, USA) by normal phase (Zorbax Rx-Sil column, 175
250 mm × 4.6 mm i.d., 5 µm particle size, Agilent Technologies Inc.). HPLC was 176
equipped with a diode array detector set at 206 nm and the solvent (30 ml/l 177
isopropanol in n-hexane) flowed at 1 ml/min. Total cholesterol concentration 178
was calculated, in duplicate, based on the external standard technique, from a 179
standard curve for peak area versus cholesterol concentration and expressed 180
as mg/mg vesicles. 181
182
Water and glycerol permeability experiments
183
Stopped-flow experiments were performed on a HI-TECH Scientific PQ/SF-53 184
apparatus with 2 ms dead time, temperature controlled and interfaced with a PC 185
microcomputer. Experiments were performed at temperatures ranging from 14 186
ºC to 37 ºC. Typically, five runs were stored and analysed in each experimental 187
condition. For the measurement of osmotic water permeability, membrane 188
vesicles (0.3 mg protein/ml) resuspended in mannitol-Hepes buffer (120 mOsM) 189
were mixed with an equal amount of isosmotic or hyperosmotic (240 mOsM) 190
mannitol solutions to reach an inwardly directed gradient of the impermeant 191
solute. The kinetics of vesicle shrinkage was monitored from the time course of 192
scattered light intensity at 400 nm until a stable light scatter signal was attained. 193
The osmotic water permeability coefficient (Pf) was estimated by fitting the light
194
scatter signal to a single exponential curve and using the linear relation 195
between Pf and the exponential time constant k (van Heeswijk and van Os, 196
1986), Pf = k (Vo/A)(1/Vw(osmout)∞), where Vw is the molar volume of water, Vo/A
197
is the initial volume to area ratio of the vesicles, and (osmout)∞ is the final
9 medium osmolarity after the applied osmotic gradient. For glycerol permeability, 199
membrane vesicles equilibrated in 120 mOsM mannitol-Hepes buffer were 200
exposed to an external solution where the impermeant solute was partially 201
replaced by glycerol (60 mOsM mannitol plus 180 mOsM glycerol, creating an 202
inwardly directed glycerol gradient). After the first fast vesicle shrinkage due to 203
water outflow, glycerol influx in response to its chemical gradient was followed 204
by water influx with subsequent vesicle reswelling. Glycerol permeability was 205
calculated as Pgly = k (Vo/A), where k is the single exponential time constant
206
fitted to the light scatter signal of glycerol influx (Dix et al., 1985). All solution 207
osmolarities were determined from freezing point depression on a semi-micro 208
osmometer (Knauer GmbH, Germany) using standards of 100 and 400 mOsM. 209
The activation energy Ea of water and glycerol transport was calculated from the
210
slope of the Arrhenius plot (lnPf or lnPgly as a function of 1/T) multiplied by the
211
gas constant R. 212
213
Membrane fluidity measurements
214
Membrane fluidity was studied by a fluorescence polarization method, which 215
measures the fluorescence anisotropy (r) of two probes incorporated in the 216
membrane: 1,6-diphenyl-1,3,5-hexatriene (DPH), or 1-(4-(trimethylamino)-217
phenyl)-6-phenyl-1,3,5-hexatriene (TMA-DPH) (Molecular Probes, USA), as 218
previously described (Martins et al., 2010). Membrane fluidity was assessed 219
based on the fluorescence anisotropy values, calculated by the equation r = (IVV
220
- GIVH) / (IVV + 2 GIVH), where IVV and IVH are the fluorescence intensities and the
221
subscripts indicate the vertical (V) or horizontal (H) orientations of the excitation 222
and emission polarizers, and G = IHV/IHH is the instrumental factor (Lakowicz,
10 1999). DPH fluorescence measurements were performed with an excitation 224
wavelength (λexc) of 357 nm and an emission wavelength (λem) of 428 nm. For 225
TMA-DPH, λexc = 343 nm and λem = 427 nm. The fluorescence intensity data 226
points used for calculations were the average of three replicate aliquots (after 227
blank subtraction) measured on a Varian Cary Eclipse fluorescence 228
spectrophotometer (Mulgrave, Australia). 229
230
Statistics
231
Statistical analysis was performed using the Statistical Analysis System (SAS) 232
software package, version 9.1 (SAS Institute, USA). Data were expressed as 233
mean and standard error of the mean (SEM). The GLM procedure was used to 234
perform a 2 × 2 factorial analysis to determine significant main effects of breed 235
(Alentejana or Barrosã), diet (silage or concentrate) and their respective 236
interaction (breed × diet). In the case of interaction, significant differences 237
between groups were identified using Fisher´s post-hoc test at P<0.05. 238
239
Results 240
Mesenteric and omental fat weights are affected by diet but not by breed
241
Some of the growth performance parameters, including live slaughter weight, 242
hot carcass weight, and subcutaneous and visceral fat depots weights are 243
shown in Table 2. An effect of breed was observed for live slaughter and hot 244
carcass weights, as Alentejana bulls had higher values of both variables in 245
relation to Barrosã bulls (P<0.0001). 246
The subcutaneous fat weight obtained through the dissection of the leg was 247
unchanged across the experimental groups (P>0.05). The same occurred for 248
11 total visceral fat (P>0.05). Mesenteric and omental fats weights were increased 249
(P<0.05 and P<0.01, respectively), by feeding a concentrate based-diet. An 250
interaction between breed and diet was observed for KKCF depot weight 251
(P<0.05). Regarding this adipose depot weight, and for concentrate-fed 252
bovines, Alentejana bulls had lower values whereas Barrosã bulls had the 253
opposite. 254
255
Membrane saturated fatty acids but not cholesterol concentration is
256
influenced by diet and not by breed
257
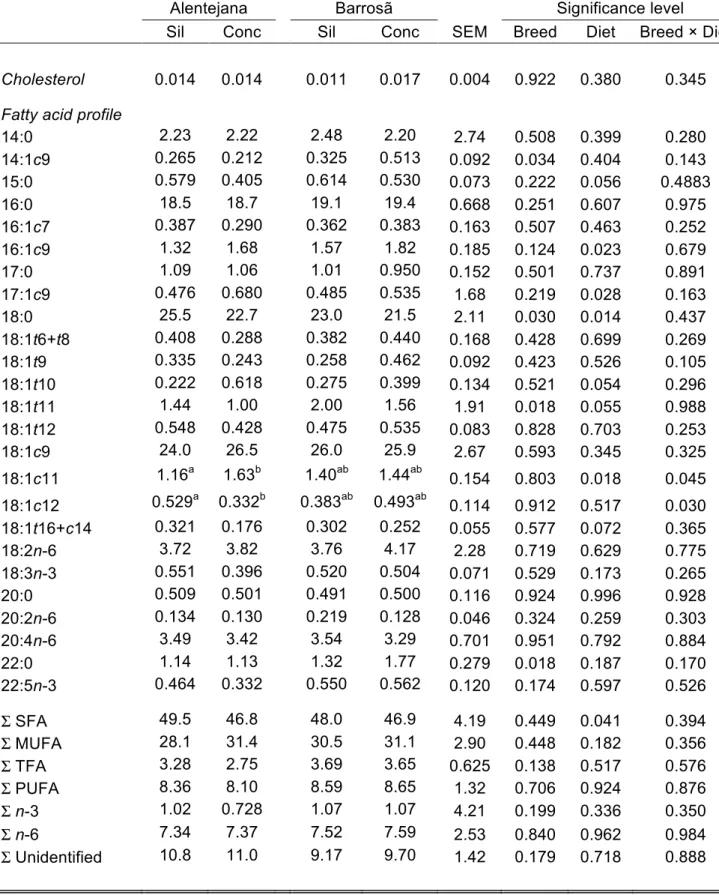
Table 3 depicts the lipid composition of membrane vesicles from mesenteric fat 258
from the four experimental groups. Total cholesterol concentration was 259
unaffected by breed or diet (P>0.05). The distribution of the main fatty acid 260
classes showed a highest occurrence of saturated fatty acids (SFA), followed by 261
monounsaturated fatty acids (MUFA), then polyunsaturated fatty acids (PUFA) 262
and lastly, trans fatty acids (TFA). The diet affected the sum of SFA (P<0.05), 263
including the 18:0 fatty acid, being the values higher in silage fed animals than 264
in concentrate fed bulls (P<0.05). For this former fatty acid, a breed effect was 265
also observed, as overall Barrosã breed showed a lower concentration 266
(P<0.05). In contrast, the 22:0 fatty acid was enhanced in Barrosã bulls, 267
regardless the diet (P<0.05). Even if the sum of MUFA was not influenced by 268
the factors under study (P>0.05), 16:1c9 and 17:1c9 fatty acids were affected 269
by diet, showing consistently higher concentrations in concentrate fed bulls 270
(P<0.05). Moreover, the breed had a notorious effect in the 14:1c9 fatty acid 271
concentration, with Barrosã bulls showing higher values than Alentejana 272
(P<0.05). The same effect was observed for 18:1t11 fatty acid (P<0.05). In 273
12 addition, an interaction between breed and diet was found for 18:1c11 and 274
18:1c12 fatty acids (P<0.05), because significant differences on these 275
concentrations were observed for the diet factor for Alentejana breed, but not 276
for Barrosã. As so, for Alentejana bulls, 18:1c11 fatty acid concentration was 277
higher in concentrate- than in silage-based diets; the opposite was observed for 278
18:1c12 fatty acid. Apart from these changes, no other significant variations 279
concerning the sum or the individual fatty acids promoted by breed, diet or their 280
respective interaction were observed. 281
282
Permeability and fluidity of adipose membranes are independent of breed
283
or diet
284
Membrane vesicles obtained from mesenteric fat revealed a unimodal size 285
distribution, showing a mean diameter of 371 ± 57 nm for all tested groups. 286
These membrane preparations were subsequently used to assess water and 287
glycerol permeability by stopped flow spectroscopy, as well as membrane 288
fluidity by fluorescence anisotropy. 289
Figure 1 depicts typical stopped flow light scatter signals of vesicle volume 290
changes when gradients of mannitol (water permeability, panel A) and glycerol 291
(panel B) were imposed. The time courses of vesicle volume changes are used 292
to calculate Pf and Pgly, as described in Material and Methods.
293
The permeability values obtained for the two bovine breeds fed silage- or 294
concentrate-based diets are shown in Table 4. Neither breed nor diet affected 295
the permeability of adipose membrane vesicles to water (Pf) and glycerol (Pgly)
296
(P>0.05). Accordingly, the activation energy values (Ea) for water and glycerol
297
permeation were similar among experimental groups, ranging from 14.5 ± 0.3 to 298
13 15.0 ± 0.2 kcal/mol (60.7 ± 1.3 to 62.8 ± 0.8 kJ/mol) for water (P>0.05) and 23.7 299
± 0.3 to 24.3 ± 0.2 kcal/mol (99.2 ± 1.4 to 102 ± 1.0 kJ/mol) for glycerol 300
(P>0.05). These relative high Ea values suggest that permeation occurs mainly
301
through the lipid bilayer with no contribution of specific protein channels for 302
transport. 303
The fluorescence anisotropy of DPH and TMA-DPH in membrane vesicles from 304
each experimental group are also shown in Table 4. Following the same 305
pattern, no significant effects of breed or diet were detected among 306
experimental groups (P>0.05) for both fluorescence probes. 307
308 309 310
14 311
Discussion 312
The manipulation of adipose tissue growth, deposition and metabolism has 313
important economic implications for the livestock industry, because it can 314
improve production efficiency, carcass composition and meat quality. 315
Two underlying processes are responsible for increased adiposity in beef cattle: 316
hypertrophy (larger adipocyte size) and hyperplasia (larger number of 317
adipocytes) (Novakofski, 2004), which are affected by factors such as genetics, 318
sex, age, feeding regimen, food supply and the specific adipose tissue depot 319
(Vernon and Houseknecht, 1991). However, an understanding of the 320
mechanisms of body fat deposition in farm animals and its outcome in adipocyte 321
physiology is far from well established. Consequently, this study was designed 322
to elucidate the contribution of breed and diet to adipose tissue membrane 323
permeability and fluidity as possible key players on fat deposition in bovines. 324
The morphological features between these breeds reflect differences in mature 325
size and, consequently, fat accumulation (da Silva et al., 1998). Following on 326
our previous results, in which the mesenteric fat depot had smaller adipocytes 327
but a greater number of cells than subcutaneous fat (Costa et al., unpublished 328
data), the aforementioned visceral fat was selected for analysis due to its 329
unique properties, regarding lipogenic activity and immune-response potential 330
(Mukesh et al., 2010). 331
As expected, a clear effect of breed was observed for some growth 332
performance parameters, with Alentejana displaying higher values for live 333
slaughter and hot carcass weights (da Silva et al., 1998; Reis et al., 2001). 334
15 Regarding lipid deposition, all fat depots under study were unaffected by breed. 335
However, diet appeared to play a significant role in determining mesenteric and 336
omental fat depots weight, which were consistently higher in concentrate fed 337
bovines. The chosen silage- and concentrate-based diets provided significant 338
differences in their composition. The concentrate-based diet exhibited higher fat 339
and starch concentrations while the silage-based diet exhibited higher fibre 340
concentration. These differences extend to the detailed fatty acid composition, 341
in particular to the sums of SFA and PUFA classes. The proportions for SFA 342
were higher in concentrate-based diets (silage 31.9 versus concentrate 37.2) at 343
the expenses of 16:0, 18:0 and 20:0 fatty acids. The inverse trend was 344
observed for PUFA (silage 53.0 versus concentrate 46.8), determined by 18:2n-345
6 and 18:3n-3 fatty acids. 346
There is convincing evidence in animal models that dietary fat influences cell 347
membrane phospholipid composition (Clandinin et al., 1985; Jenkins, 1994). 348
Typically ruminant diets are low in fat but high in PUFA contents. Nevertheless, 349
unsaturated fatty acids in the diet undergo an extensive biohydrogenation in the 350
rumen, with consequently high levels of SFA being absorbed in the intestine 351
and deposited in the tissues (Wachira et al., 2002). In agreement, adipose 352
membranes from visceral fat were found to be richer in SFA, displaying 353
concomitantly a lower proportion of PUFA. 354
Cholesterol is a biomembrane-rigidifying component. When cholesterol is 355
aligned in parallel array with the phospholipid fatty acyl chains it reduces 356
membrane fluidity (Stubbs and Smith, 1984; Onuki et al., 2008), but inversely, 357
increases rigidity. Our results indicate that total cholesterol concentration was 358
unchanged by any factor under study. Accordingly, neither breed nor diet 359
16 affected the permeability of adipose membranes to water or glycerol. The 360
activation energy for both water and glycerol transport was high and relatively 361
stable in all cases, thus indicating that permeation is not protein-mediated and 362
occurs mainly via the lipid bilayer where permeability correlates with fluidity. 363
Accordingly, no variations for adipose membrane fluidity were found with DPH 364
or TMA-DPH probes, which assess fluidity at different depths in the bilayer 365
(TMA-DPH assessing a region closer to the lipid-water interface). Altogether, 366
these results corroborate the stability found in permeability data. 367
Besides cholesterol, fatty acids strongly influence membrane fluidity. With an 368
increase in unsaturated fatty acids concentration, membrane fluidity increases 369
because PUFA acyl chains are extremely flexible and can rapidly change 370
conformational states. The fatty acid profile in adipose membranes from 371
mesenteric fat of Alentejana and Barrosã bovines fed silage- and concentrate-372
based diets showed no variations in PUFA sum and, foremost important, 373
included none of the n-3 fatty acids, EPA (20:5n-3) and DHA (22:6n-3), well 374
known for their impressive range of health benefits, being the later recognized 375
as a potent membrane fluidizer agent (Stillwell and Wassall, 2003). These 376
results are in accordance to Wachira et al. (Wachira et al., 2002), who found 377
residual concentration of both n-3 fatty acids in subcutaneous fat of sheep, even 378
after the intake of feeding regimens enriched in linseed and fish oils. Dietary 379
lipids do not directly affect the fatty acid composition of ruminant adipose 380
tissues, as they do in non-ruminants (Sarkkinen et al., 1994). Raising the PUFA 381
content of ruminant tissues by PUFA feeding is rather complex due to the 382
extensive hydrogenation of dietary unsaturated fatty acids by rumen 383
microorganisms (Pond, 1999; Jambrenghi et al., 2007). Nevertheless, the few 384
17 changes observed for the general fatty acid profile in adipose membranes 385
appear to reflect the dietary treatment imposed, instead of a breed-related 386
effect. The same pattern had already been observed for the fatty acids profile in 387
mesenteric fat, with diet determining the proportions of the major fatty acids as 388
well as their partial sums (Costa et al., unpublished data). Although the sum of 389
MUFA was kept similar across experimental groups, the 16:1c9 and 17:1c9 fatty 390
acids were under the influence of diet, with higher concentration in concentrate 391
fed bulls. This is in line with previous reports stating that concentrate promotes 392
higher expression or activity levels of delta-9 desaturase enzyme, responsible 393
for the conversion of SFA to MUFA (Daniel et al., 2004). Nevertheless, these 394
differences relate to residual concentration of these fatty acids, ranging from 395
0.48% to 1.82%, and therefore, we believe play an irrelevant physiological role. 396
Similarly, total SFA was affected by the diet factor, being the difference 397
observed largely determined by stearic acid (18:0) concentration in Alentejana 398
bulls fed on silage. More 18:2n-6 fatty acid in the silage feeding regimen results 399
in more 18:0 in adipose plasma membranes, as reported formerly (Jenkins, 400
1994). High stearic levels are also in accordance to the reported values in the 401
adipose tissue of lambs (Enser et al., 1996). 402
Finally, a breed effect was observed for 22:0, 14:1c9 and 18:1t11. All three fatty 403
acids concentration were higher in Barrosã bulls when compared to Alentejana 404
bulls. The long-chain fatty acids (LCFA) occurred at very low levels in the 405
adipose membranes of bovines, either Alentejana or Barrosã, fed any of the 406
dietary treatments. Low levels of LCFA in ruminant’s adipose tissue have 407
already been reported and were attributed to the low incorporation of these fatty 408
acids into the triacylglycerol fraction, as well as to the low proportion of 409
18 phospholipid in the adipose tissue (Enser et al., 1996; Wachira et al., 2002). 410
Concerning the difference observed between breeds for the 22:0 fatty acid, it 411
might be due to a higher elongase expression, or enzymatic activity, in the 412
Barrosã than in the Alentejana breed. Genetic background also appeared to 413
dictate a differential expression, or activity, of delta-9 desaturase enzyme, 414
responsible for the conversion of 14:0 to 14:1c9 (Keating et al., 2006). These 415
hypotheses remain to be tested. In relation to the 18:1t11 fatty acid, commonly 416
known as vaccenic acid, it is metabolized into the c9,t11 conjugated linoleic acid 417
(CLA) isomer (Lock et al., 2004), to which numerous health claims have been 418
attributed (Bhattacharya et al., 2006), and for this reason has been considered 419 as beneficial or neutral. 420 421 Conclusions 422
This study reports that adipose membranes from ruminant´s mesenteric fat 423
depot were rich in SFA due to ruminal biohydrogenation of dietary PUFA. 424
Membrane fluidity and permeability to glycerol were found to be independent of 425
breed (Alentejana or Barrosã) and diet (based on 70/30% or 30/70% of corn 426
silage and concentrate, respectively). Re-enforcing these findings, cholesterol, 427
the main biomembrane-rigidifying component, and in particular, unsaturated 428
fatty acids concentration were unchanged among experimental groups. 429
19 431
Acknowledgments 432
This study was supported by Fundação para a Ciência e a Tecnologia (FCT) 433
through grant PTDC/CVT/2006/66114 and individual fellowships to Ana P. 434
Martins (SFRH/BD/2009/65046), Ana S. H. Costa (SFRH/BD/2009/61068) and 435
Susana V. Martins (SFRH/BPD/2009/63019). Paula A. Lopes is a researcher 436
from the program “Ciência 2008” from FCT. We wish to express our gratitude to 437
Rui Bessa and Susana Alves (L-INIA-REQUIMTE) for providing fatty acid 438 profiles. 439 440 441 442 443 444 445 446 447 448 449 450
20 451
References 452
453
Alfaia CMM, Castro MLF, Martins SIV, Portugal APV, Alves SPA, Fontes CMGA,
454
Bessa RJB, and Prates JAM 2007. Effect of slaughter season on fatty acid
455
composition, conjugated linoleic acid isomers and nutritional value of intramuscular fat
456
in Barrosã-PDO veal. Meat Science 75, 44-52.
457
Alfaia CPM, Alves SP, Martins SIV, Costa ASH, Fontes CMGA, Lemos JPC, Bessa
458
RJB and Prates JAM 2009. Effect of the feeding system on intramuscular fatty acids
459
and conjugated linoleic acid isomers of beef cattle, with emphasis on their nutritional
460
value and discriminatory ability. Food Chemistry 114, 939-946.
461
Alves SP and Bessa RJ 2009. Comparison of two gas-liquid chromatograph columns
462
for the analysis of fatty acids in ruminant meat. Journal of Chromatography A 1216,
463
5130-5139.
464
Azain MJ 2004. Role of fatty acids in adipocyte growth and development. Journal of
465
Animal Science 82, 916-924.
466
Beja-Pereira A, Alexandrino P, Bessa I, Carretero Y, Dunner S, Ferrand N, Jordana J,
467
Laloe D, Moazami-Goudarzi K, Sanchez A and Canon J 2003. Genetic characterization
468
of southwestern European bovine breeds: A historical and biogeographical
469
reassessment with a set of 16 microsatellites. Journal of Heredity 94, 243-250.
470
Bhattacharya A, Banu J, Rahman M, Causey J and Fernandes G 2006. Biological
471
effects of conjugated linoleic acids in health and disease. Journal of Nutritional
472
Biochemistry 17, 789-810.
473
Bradford MM 1976. A rapid and sensitive method for the quantitation of microgram
474
quantities of protein utilizing the principle of protein-dye binding. Analytical
475
Biochemistry 72, 248-254.
476
Christie WW, Dobson G and Adlof RO 2007. A practical guide to the isolation, analysis
477
and identification of conjugated linoleic acid. Lipids 42, 1073-1084.
478
Clandinin MT, Field CJ, Hargreaves K, Morson L and Zsigmond E 1985. Role of diet fat
479
in subcellular structure and function. Canadian Journal of Physiology and
480
Pharmacology 63, 546-556.
21
da Silva MF, Lemos JPC, Monteiro LS and Portugal AV 1998. Studies on growth and
482
form: multivariate analysis of distribution of muscle and fat in Portuguese cattle breeds.
483
Livestock Production Science 55, 261-271.
484
Daniel ZCTR, Wynn RJ, Salter AM and Buttery PJ 2004. Differing effects of forage and
485
concentrate diets on the oleic acid and conjugated linoleic acid content of sheep
486
tissues: The role of stearoyl-CoA desaturase. Journal of Animal Science 82, 747-758.
487
De Smet S, Raes K and Demeyer D 2004. Meat fatty acid composition as affected by
488
fatness and genetic factors: a review. Animal Research 53, 81-98.
489
Dix JA, Ausiello DA, Jung CY and Verkman AS 1985. Target analysis studies of red
490
cell water and urea transport. Biochimica et Biophysica Acta 821, 243-252.
491
Enser M, Hallett K, Hewitt B, Fursey GAJ and Wood JD 1996. Fatty acid content and
492
composition of English beef, lamb and pork at retail. Meat Science 42, 443-456.
493
Field CJ and Clandinin MT 1984. Modulation of adipose-tissue fat composition by diet -
494
a review. Nutrition Research 4, 743-755.
495
Field CJ, Ryan EA, Thomson ABR and Clandinin MT 1988. Dietary-fat and the diabetic
496
state alter insulin binding and the fatty acyl composition of the adipocyte
plasma-497
membrane. Biochemical Journal 253, 417-424.
498
Hocquette JF, Gondret F, Baeza E, Medale F, Jurie C and Pethick DW 2010.
499
Intramuscular fat content in meat-producing animals: development, genetic and
500
nutritional control, and identification of putative markers. Animal 4, 303-319.
501
Jambrenghi AC, Paglialonga G, Gnoni A, Zanotti F, Giannico F, Vonghia G and Gnoni
502
GV 2007. Changes in lipid composition and lipogenic enzyme activities in liver of lambs
503
fed omega-6 polyunsaturated fatty acids. Comparative Biochemistry and Physiology
B-504
Biochemistry & Molecular Biology 147, 498-503.
505
Jenkins TC 1994. Regulation of lipid-metabolism in the rumen. The Journal of Nutrition
506
124, S1372-S1376.
507
Keating AF, Kennelly JJ and Zhao FQ 2006. Characterization and regulation of the
508
bovine stearoyl-CoA desaturase gene promoter. Biochemical and Biophysical
509
Research Communications 344, 233-240.
510
Lakowicz JR 1999. Principles of fluorescence spectroscopy. Kluwer Academic /
511
Plenum, New York.
22
Lande MB, Donovan JM and Zeidel ML 1995. The relationship between membrane
513
fluidity and permeabilities to water, solutes, ammonia, and protons. Journal of General
514
Physiology 106, 67-84.
515
Lock AL, Corl BA, Barbano DM, Bauman DE and Ip C 2004. The anticarcinogenic
516
effect of trans-11 18 : 1 is dependent on its conversion to cis-9, trans-11 CLA by delta
517
9-desaturase in rats. The Journal of Nutrition 134, 2698-2704.
518
Martins AP, Lopes PA, Martins SV, Madeira A, Santos NC, Prates JA, Moura TF and
519
Soveral G 2010. Conjugated linoleic acid reduces permeability and fluidity of adipose
520
plasma membranes from obese Zucker rats. Biochemical and Biophysical Research
521
Communications 398, 199-204.
522
Mukesh M, Bionaz M, Graugnard DE, Drackley JK and Loor JJ 2010. Adipose tissue
523
depots of Holstein cows are immune responsive: inflammatory gene expression in vitro.
524
Domestic Animal Endocrinology 38, 168-178.
525
Naeemi ED, Ahmad N, al-Sharrah TK and Behbahani M 1995. Rapid and simple
526
method for determination of cholesterol in processed food. Journal of AOAC
527
International 78, 1522-1525.
528
Novakofski J 2004. Adipogenesis: usefulness of in vitro and in vivo experimental
529
models. Journal of Animal Science 82, 905-915.
530
Onuki Y, Hagiwara C, Sugibayashi K and Takayama K 2008. Specific effect of
531
polyunsaturated fatty acids on the cholesterol-poor membrane domain in a model
532
membrane. Chemical & Pharmaceutical Bulletin 56, 1103-1109.
533
Pond CM 1999. Physiological specialisation of adipose tissue. Progress in Lipid
534
Research 38, 225-248.
535
Raes K, De Smet S and Demeyer D 2001. Effect of double-muscling in Belgian Blue
536
young bulls on the intramuscular fatty acid composition with emphasis on conjugated
537
linoleic acid and polyunsaturated fatty acids. Animal Science, 253-260.
538
Reis C, Navas D, Pereira M and Cravador A 2001. Growth hormone ALUI
539
polymorphism analysis in eight Portuguese bovine breeds. Archivos de Zootecnia 50,
540
41-48.
541
Sarkkinen ES, Agren JJ, Ahola I, Ovaskainen ML and Uusitupa MIJ 1994. Fatty-acid
542
composition of serum-cholesterol esters, and erythrocyte and platelet membranes as
543
indicators of long-term adherence to fat-modified diets. American Journal of Clinical
544
Nutrition 59, 364-370.
23
Simões JA and Mendes I 2003. Distribution of tissues in carcasses at the same
546
proportion of total fat in Portuguese cattle breeds. Animal Research, 52: 287–298.
547
Soveral G, Martins AP, Martins SV, Lopes PA, Alfaia CM, Prates JA and Moura TF
548
2009. Effect of dietary conjugated linoleic acid isomers on water and glycerol
549
permeability of kidney membranes. Biochemical and Biophysical Research
550
Communications 383, 108-112.
551
Stillwell W and Wassall SR 2003. Docosahexaenoic acid: membrane properties of a
552
unique fatty acid. Chemistry and Physics of Lipids 126, 1-27.Stubbs CD and Smith AD
553
1984. The modification of mammalian membrane poly-unsaturated fatty-acid
554
composition in relation to membrane fluidity and function. Biochimica et Biophysica
555
Acta 779, 89-137.
556
van Heeswijk MP and van Os CH 1986. Osmotic water permeabilities of brush border
557
and basolateral membrane vesicles from rat renal cortex and small intestine. Journal of
558
Membrane Biology 92, 183-193.
559
Vernon RG and Houseknecht KL 1991. Adipose tissue: beyond an energy reserve. In
560
Ruminant physiology: digestion, metabolism, growth and reproduction (ed. PB Cronjé),
561
pp. 171-186, CAB International, London.
562
Wachira AM, Sinclair LA, Wilkinson RG, Enser M, Wood JD and Fisher AV 2002.
563
Effects of dietary fat source and breed on the carcass composition, n-3
564
polyunsaturated fatty acid and conjugated linoleic acid content of sheep meat and
565
adipose tissue. British Journal of Nutrition 88, 697-709.
566 567 568 569
24 570 571 FIGURE CAPTIONS 572 573
Figure 1 – Representative stopped flow light scatter of adipose membrane 574
vesicles permeability to water and glycerol at 23 ºC. Time course of (A) vesicle 575
shrinkage due to water outflow after an hyperosmotic shock with 120 mOsM 576
mannitol gradient or (B) vesicle reswelling due to glycerol uptake after an 577
inwardly directed 180 mOsM glycerol gradient. 578
25 580
581
Table 1. Diet composition. 582
Silage† Concentrate‡ SEM Significance level
Gross energy (MJ/kg DM) 19.1 18.6 0.417 0.391 Proximate composition (g/kg DM) Crude protein 14.2 12.5 0.632 0.130 Crude fat 2.87 3.17 0.033 0.003 Crude fibre 19.8 15.0 1.14 0.041 Ash 5.53 6.17 0.307 0.219 Starch 28.5 37.6 1.51 0.013
Fatty acid composition (g/100g fatty acids)
16:0 20.2 24.1 0.677 0.016 18:0 5.11 9.44 1.05 0.043 20:0 6.51 3.66 0.567 0.024 18:1c9 15.1 16.0 0.345 0.154 18:2n-6 43.9 40.9 0.399 0.006 18:3n-3 9.16 5.96 0.716 0.034
†Silage-based diet = 30/70% of concentrate and silage, respectively; ‡ Concentrate-583
based diet = 70/30% of concentrate and silage, respectively. n = 3; Values are mean ±
584
SEM.
585 586 587
26 588
589
Table 2. Slaughter weight, hot carcass weight, subcutaneous and visceral 590
adipose depots weights from Alentejana and Barrosã bulls fed silage and 591
concentrate based diets. 592
Alentejana Barrosã Significance level
Sil Conc Sil Conc SEM Breed Diet Breed × Diet
Performance traits
Live slaughter weight (kg) 640 655 447 485 24.4 <0.0001 0.286 0.640
Hot carcass weight (kg) 368 382 252 275 14.2 <0.0001 0.213 0.774
Carcass traits
Subcutaneous fat (g/kg leg) 41.3 49.5 45.8 50.7 6.47 0.663 0.325 0.800
Visceral fat (g/kg carcass) 62.6 61.5 53.7 77.5 6.19 0.576 0.082 0.058
Mesenteric fat (g/kg carcass) 16.2 17.7 14.7 22.7 2.03 0.396 0.028 0.121
Omental (g/kg carcass) 21.7 24.4 18.2 29.4 2.35 0.747 0.008 0.087
KKCF (g/kg carcass) 24.8 19.4 20.8 25.3 2.28 0.666 0.852 0.042
Dietary treatments: Sil = silage diet based on 30/70% of concentrate and silage,
593
respectively; Conc = concentrate diet based on 70/30% of concentrate and silage,
594
respectively. Values are mean ± SEM.
595 596 597
27 598
Table 3. Cholesterol concentration (mg/mg vesicles) and fatty acid profile 599
(g/100 g fatty acids) in mesenteric adipose tissue membrane vesicles from 600
Alentejana and Barrosã bulls fed silage and concentrate based diets. 601
Alentejana Barrosã Significance level
Sil Conc Sil Conc SEM Breed Diet Breed × Diet
Cholesterol 0.014 0.014 0.011 0.017 0.004 0.922 0.380 0.345
Fatty acid profile
14:0 2.23 2.22 2.48 2.20 2.74 0.508 0.399 0.280 14:1c9 0.265 0.212 0.325 0.513 0.092 0.034 0.404 0.143 15:0 0.579 0.405 0.614 0.530 0.073 0.222 0.056 0.4883 16:0 18.5 18.7 19.1 19.4 0.668 0.251 0.607 0.975 16:1c7 0.387 0.290 0.362 0.383 0.163 0.507 0.463 0.252 16:1c9 1.32 1.68 1.57 1.82 0.185 0.124 0.023 0.679 17:0 1.09 1.06 1.01 0.950 0.152 0.501 0.737 0.891 17:1c9 0.476 0.680 0.485 0.535 1.68 0.219 0.028 0.163 18:0 25.5 22.7 23.0 21.5 2.11 0.030 0.014 0.437 18:1t6+t8 0.408 0.288 0.382 0.440 0.168 0.428 0.699 0.269 18:1t9 0.335 0.243 0.258 0.462 0.092 0.423 0.526 0.105 18:1t10 0.222 0.618 0.275 0.399 0.134 0.521 0.054 0.296 18:1t11 1.44 1.00 2.00 1.56 1.91 0.018 0.055 0.988 18:1t12 0.548 0.428 0.475 0.535 0.083 0.828 0.703 0.253 18:1c9 24.0 26.5 26.0 25.9 2.67 0.593 0.345 0.325 18:1c11 1.16a 1.63b 1.40ab 1.44ab 0.154 0.803 0.018 0.045 18:1c12 0.529a 0.332b 0.383ab 0.493ab 0.114 0.912 0.517 0.030 18:1t16+c14 0.321 0.176 0.302 0.252 0.055 0.577 0.072 0.365 18:2n-6 3.72 3.82 3.76 4.17 2.28 0.719 0.629 0.775 18:3n-3 0.551 0.396 0.520 0.504 0.071 0.529 0.173 0.265 20:0 0.509 0.501 0.491 0.500 0.116 0.924 0.996 0.928 20:2n-6 0.134 0.130 0.219 0.128 0.046 0.324 0.259 0.303 20:4n-6 3.49 3.42 3.54 3.29 0.701 0.951 0.792 0.884 22:0 1.14 1.13 1.32 1.77 0.279 0.018 0.187 0.170 22:5n-3 0.464 0.332 0.550 0.562 0.120 0.174 0.597 0.526 Σ SFA 49.5 46.8 48.0 46.9 4.19 0.449 0.041 0.394 Σ MUFA 28.1 31.4 30.5 31.1 2.90 0.448 0.182 0.356 Σ TFA 3.28 2.75 3.69 3.65 0.625 0.138 0.517 0.576 Σ PUFA 8.36 8.10 8.59 8.65 1.32 0.706 0.924 0.876 Σ n-3 1.02 0.728 1.07 1.07 4.21 0.199 0.336 0.350 Σ n-6 7.34 7.37 7.52 7.59 2.53 0.840 0.962 0.984 Σ Unidentified 10.8 11.0 9.17 9.70 1.42 0.179 0.718 0.888
28
Dietary treatments: Sil = silage diet based on 30/70% of concentrate and silage,
602
respectively; Conc = concentrate diet based on 70/30% of concentrate and silage,
603
respectively. Values are mean ± SEM. a-bMean values within the same row with
604
different superscript letters are significantly different (Fisher´s post-hoc test, P<0.05).
605
FAME = fatty acid methyl esters. Σ SFA = sum of 14:0, 15:0, 16:0, 17:0, 18:0, 20:0 and
606
22:0; Σ MUFA = sum of 14:1c9, 16:1c7, 16:1c9, 17:1c9, 18:1c9, 18:1c11 and 18:1c12;
607
Σ TFA = sum of 18:1t6+t8, 18:1t9, 18:1t10, 18:1t11, 18:1t12 and 18:1t16+c14; Σ PUFA
608
= sum of 18:2n-6, 18:3n-3, 20:2n-6, 20:4n-6 and 22:5n-3; Σ n-6 = sum of 18:2n-6,
609
20:2n-6 and 20:4n-6; Σ n-3 = sum of 18:3n-3 and 22:5n-3.
610 611 612
29 613
614
Table 4. Permeability values for water (Pf) and glycerol (Pgly), and fluorescence
615
anisotropy of DPH and TMA-DPH in mesenteric adipose tissue membrane 616
vesicles from Alentejana and Barrosã bulls fed silage and concentrate based 617
diets. 618
Alentejana Barrosã Significance level
Sil Conc Sil Conc SEM Breed Diet Breed × Diet
Permeability Pf × 10-4 cm/s 1.42 1.41 1.45 1.42 0.053 0.766 0.681 0.894 Pgly × 10-7 cm/s 4.47 4.57 4.26 4.55 0.213 0.593 0.370 0.673 Fluorescence anisotropy DPH 0.159 0.148 0.168 0.169 0.010 0.118 0.617 0.524 TMA-DPH 0.274 0.266 0.271 0.270 0.005 0.943 0.364 0.525
Dietary treatments: Sil = silage diet based on 30/70% of concentrate and silage,
619
respectively; Conc = concentrate diet based on 70/30% of concentrate and silage,
620
respectively. Values are mean ± SEM.
621 622 623 624 625