MASTER OF SCIENCE IN
FINANCE
M
ASTERS
F
INAL
W
ORK
PROJECT
EQUITY RESEARCH
:
H
EINEKEN
N.V.
S
ÉRGIO
M
IGUEL DOS
S
ANTOS
C
RISPIM
S
UPERVISOR
:
PROFESSOR PEDRO RINO VIEIRA
MASTER OF SCIENCE IN
FINANCE
MASTERS FINAL WORK
PROJECT
EQUITY RESEARCH
:
H
EINEKEN
N.V.
S
ÉRGIO
M
IGUEL DOS
S
ANTOS
C
RISPIM
S
UPERVISOR
:
PROFESSOR PEDRO RINO VIEIRA
Abstract
The elaborated work consists on an Equity Research of Heineken N.V. for the year ending
2018F, based on assumptions that I consider to be viable for the next five years and based on
the historical performance of the last five years. The decision to evaluate a company such as
Heineken N.V. came for personal relish, not only by the company and all that it represents in
terms of influences, but also combined with an interest to know more about the industry in
which it is inserted.
To do this, the entire study is done through the CFA Institute format and begins with the
company description, which contains a summary of its history to date, focused on the main
acquisitions occurring, the explanation of which operating segments (in the case of Heineken
NV the operational segments are assumed to be regional), an enumeration and detail of the
main drivers of revenue, profitability and costs, the strategy defined by the management of the
company for the coming years and also how the company is organized at the level of
shareholders structure, as well as its corporate governance.
The next phase introduces some of the study of the global economy, and centers on the trends
and growth (by region and global) of the industry forecast for the next years. This phase
concludes with an analysis of the competitive environment in which Heineken N.V. is inserted,
and where it is the second largest competitor in terms of revenue.
After the analytical study, the assumptions are elaborated for the next five years, as already
mentioned, and the evaluation models applied. The main model applied is Discounted Cash
Flow, which discounts to the present, at the discount rate considered and calculated by me, all
future cash flows generated, including the cash flow value generated for perpetuity. Through
this model the recommendation given to investors is to hold/maintain the shares, since the
suggested price for the end of 2018FY is € 91.55 / share, bearing in mind that Heineken N.V.
is a low risk company. This valuation is supported by the complementary Adjusted Present
Value and Free Cash Flow to Equity methods, for which I obtained the price per share of
respectively € 90.48/share and € 88.82/share. The evaluation by the Dividend Discount Model
and Multiples method was also elaborated, although with inconclusive results, and
skewed in the case of the relative valuation.
For this recommendation, I consider that the main risks meet the expected risk-free rate of
return for perpetuity and perpetual growth rate. Being data with immense dependent variables,
they become impossible to predict with certainties. In order to assess these risks and other
risks considered, sensitivity analyzes are elaborated to determine the impact they may have
on the recommendation.
Resumo
O trabalho elaborado consiste numa avaliação do preço por ação da Heineken N.V. para o
final de 2018FY, tendo por base pressupostos que considero futuramente viáveis para os
próximos cinco anos de atividade e que se apoiam no histórico de performance dos últimos
cinco anos. A decisão de avaliar uma empresa como a Heineken N.V. adveio por gosto
pessoal, não só da empresa e tudo o que esta representa ao nível de influências, aliado a um
interesse de conhecer mais sobre a indústria na qual esta se insere.
Para tal, todo o estudo é feito através do formato CFA Institute e tem como início a descrição
da empresa, a qual contém um resumo da sua história até à data, focado nas principais
aquisições ocorrentes, a explicação de quais os segmentos operacionais (no caso da
Heineken N.V. os segmentos operacionais são assumidos como regionais), uma enumeração
e detalhe dos principais elementos condutores de receitas, rentabilidade e custos, a estratégia
definida pela direção da empresa para os próximos anos e também de que forma a empresa
está organizada ao nível da estrutura de detenção de ações, bem como a organização
administrativa interna.
A fase seguinte introduz um pouco do estudo da economia global, e centraliza-se nas
tendências e crescimento (por região e global) da indústria previsto para próximos anos. Esta
fase termina com uma análise do meio competitivo no qual se insere a Heineken N.V., e onde
é o segundo maior competidor em termos de receitas.
Após o estudo analítico, os pressupostos são elaborados para os próximos cinco anos, como
já foi referido, e os modelos de avaliação aplicados. O principal modelo aplicado é o
Discounted Cash Flow, o qual atualiza para o presente, à taxa de desconto considerada e
calculada por mim, todos os cash flows gerados futuros, onde se incluí o valor de cash flow
gerado para a perpetuidade. Através deste modelo a recomendação dada aos investidores é
de manter as ações, já que o preço sugerido para o fim de 2018FY é €91,55/ação, tendo em
conta que a Heineken N.V. é uma empresa de baixo risco. Esta avaliação é suportada pelos
métodos complementares Adjusted Present Value e Free Cash Flow to Equity, pelos quais
obtive o preço por ação de, respetivamente, €90,48/ação e €88,82/ação. A avaliação pelos
métodos Dividend Discount Model e método dos Múltiplos também foi elaborada, embora com
resultados inconclusivos, e enviesados no caso da avaliação relativa.
Para esta recomendação, considero que os principais riscos vão ao encontro da taxa de
retorno sem risco prevista para a perpetuidade e para a taxa de crescimento perpétua. Sendo
dados com imensas variáveis dependentes, tornam-se impossíveis de prever com certezas.
Para avaliar estes riscos, e outros riscos considerados, estão elaboradas análises de
sensibilidade para se perceber qual o impacto que os mesmos podem ter na recomendação.
Acknowledgements
This space will be used to thank all those who directly or indirectly helped me complete the
final master's thesis and all those who supported me throughout my academic journey.
A first mention of gratefulness to my tutor, Professor Pedro Rino Vieira, for helping me
throughout the preparation of this work. To all the teachers who accompanied me along the
master course, thank you.
To highlight some of my friends who have followed my path very closely: Daniel Frade, Filipe
Marçal, João Marques Dias, João Imaginário, Pedro Figueiredo, Pedro Gameiro, Pedro
Gomes and Ricardo Duarte. I can never tell if some of these names helped or sabotaged my
work, for all the times I was persuaded to go to the Quisoque / Lust / Cais. Thank you very
much, without you, for sure that this walk would not been so happy, FMU forever.
To my friends who have been with me since we were children: António Santos, António Vieira,
Bruno Heleno, Fábio Pereira, Gonçalo Silva, José Francisco, Micael Neto, Miguel Custódio,
Ricardo Ribeiro, Ruben Borralho, Vasco Pereira. I am grateful for the fact that I have never
been able to do the thesis on the days I was in Fatima. Being with you, whether it is in London,
Kitolas, or through fantasy, is always the happiest time of the week.
To Joana Vaz, for the friendship over the last 6 years. It is no coincidence that you have always
been present in the best years of my life. Thank you very much.
To Andreia Gaudêncio, for all the good moments that we spent together, and for all the support
that she gave me and continue to give me, thank you very much.
To all my closest family, your support and efforts to make me feel comfortable and happy was
one of the most important things throughout these years. For that and for everything, Liliana
Crispim, Bruno Marto, Maria Francisca, Eunice Crispim, Miguel Marques, thank you.
Finally, the biggest thank you goes to the two most important people: my parents, Ana Maria
Marques dos Santos and José Crispim Vieira. Without your effort to give me everything I
needed, this walk would not have been possible. Thank you very, very much.
Index
Abstract
2
Resumo
ii
Acknowledgements
iii
Index
iv
1.
Research Snapshot
1
2.
Business Description
2
3.
Management and Corporate Governance
5
4.
Industry Overview and Competitive Positioning
6
5.
Investment Summary
12
6.
Valuation
13
7.
Financial Analysis
16
8.
Investment Risks
17
Appendices
20
Appendix 1: Statement of Financial Position
20
Appendix 2: Income Statement
21
Appendix 3: Cash Flow Statement
22
Appendix 4: Key Financial Ratios
23
Appendix 5: Common-Size Statement of Financial Position
24
Appendix 6: Forecasting Assumptions
25
Appendix 7: Revenues Forecast
27
Appendix 8: Loans and Borrowings Assumptions
28
Appendix 9: Interests Computations
29
Appendix 10: WACC Assumptions
30
Appendix 11: Discounted Cash Flow Computations
31
Appendix 12: Adjusted Present Value Computations
32
Appendix 13: Free Cash Flow to Equity Computations
32
Appendix 15: Dividend Discount Model Computations
33
Appendix 16: Comparable´ Data
33
Appendix 17: Relative Valuation
34
Appendix 17: Sensitivity Analysis
35
List of figures
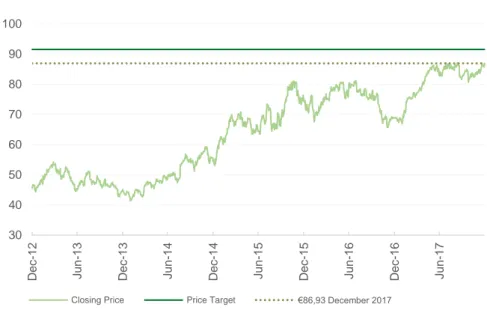
Figure 1: Historical Share Price……….1
Figure 2: Changes on company´s name………..2
Figure 3: Consolidated beer volume (in millions of hectoliters)………2
Figure 4: Heineken®´s volume (in millions of hectoliters)……….2
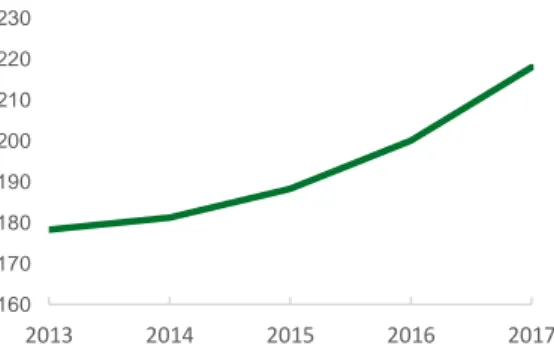
Figure 5: Revenues (in millions of €)………2
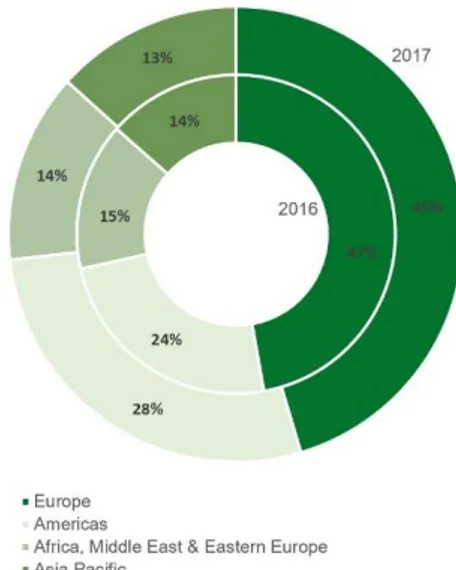
Figure 6: Revenue by Region (in percentage of total)………...3
Figure 7: Percentage of Operating Profit by region………3
Figure 8: Operating Profit by region (in percentage of total)……….3
Figure 9: Expenses (in millions of €)……….4
Figure 10: Strategies………...5
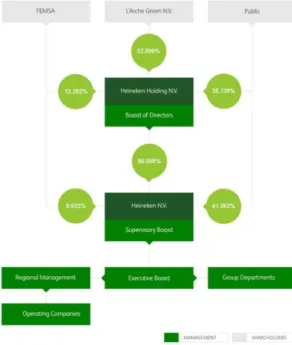
Figure 11: Ownership Structure……….5
Figure 12: Supervisory Board and Commitees………...6
Figure 13: Real GDP growth………..6
Figure 14: Real GDP growth………..6
Figure 15: 2021 expected market value by region (in percentage´ average)
…………7
Figure 16: Value´ CAGR by region (in percentage´ average)………..7
Figure 17: Volume´ CAGR by region (in percentage´ average)………...8
Figure 18: Goods and services purchases by supply sector (in percentage)…………8
Figure 19: Packaging materials by type (in percentage)………...9
Figure 20: Global market vs Heineken 2011-2016 yoy (in percentage)………..9
Figure 21: Regional market share (in percentage)……….9
Figure 22: Porter 5 forces……….10
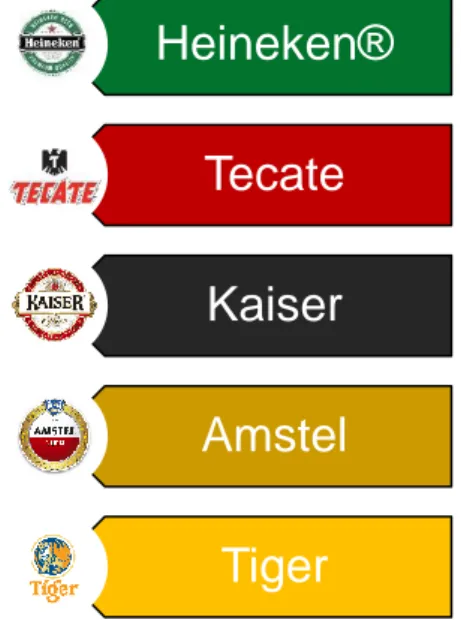
Figure 23: Heineken´ top 5 brands……….11
Figure 24: Asia Pacific beer market share by volume (in percentage)……….11
Figure 25: Predicted FCFF for valuation period, including trendline……….12
Figure 26: Revenue on the valuation period……….13
Figure 27: Regional percentage of revenues in 2022F………13
Figure 28: Short-term borrowings through the forecasting period……….14
Figure 29: Long-term borrowings through the forecasting period………..14
Figure 30: Profit curve 2018F - 2022F………16
Figure 31: Risk Matrix………...17
List of tables
Table 1: Author´s risk assessment………1
Table 2: Raw materials (in percentage of total)………..4
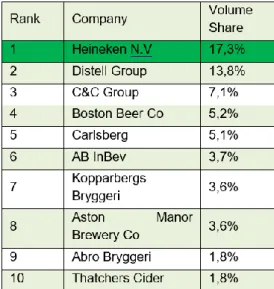
Table 3: Top 10 companies´ volume market share………7
Table 4: Cider top 10 companies´ market share
………..10
Table 5: DCF price target computations………12
Table 6: Ke, Kd and WACC……….15
Table 7: Income Statement items forecast 2018/2022………15
Table 8: Comparables´ betas………..16
Table 9: Risks associated to each item / input………..17
Table 10: Recommendation system for low risk companies………..18
Table 11: Sensitivity analysis for the long-term Risk-free and for Corporate Tax
Rate………..17
Table 12: Sensitivity analysis for the Terminal growth rate (g) and for the long-term
WACC………..18
HEIA: Entering in new markets
(YE2018 Price Target of €91,55 (+5,3%); recommendation is to hold)
HOLD is my recommendation for Heineken N.V. (HEIA) with a 2018YE price target of
€91,55/sh using the discounted cash flow method, implying an upside potential of 5,3% from the December 31 closing price of €86,93/sh, with low-risk. It a very competitive market, where the main regional segment, Europe, is highly consolidated. The company performed strong investments over the last years on emergent markets like Americas, Asia Pacific and Africa, and on the cider industry, where is market share´ leader. Adjusted Present Value and Free Cash Flow to the Firm support my view that HEIA is undervalued.
Figure 1: Historical Share Price
Europe is currently the group´s main region in terms of revenues: by itself, it
comprised 46,6% of total revenues in 2017, following a declining trend verified from 2014, given that since this year the region lost 4,1% share to other regions. This is happening, not due to decreasing consolidated beer volumes, but due to decreasing volume´s growth percentage. In fact, from 2015 to 2017, the volumes only increase 2,9%, being expected a growth rate of 3,5% from 2018 to 2022.
Beer industry is becoming very consolidated: in fact, in Europe there is short space
to sharp group´s volumes the level of profit is declining, and competition is continually becoming more aggressive. To gain market share, in order to approach the leader AB InBev and solidify the second position, HEINEKEN intends to make considerable investments, especially on Asia Pacific, as well as improve previous investments on Americas.
Cider: HEINEKEN is market share´s leader on cider industry. The company seeks to
consolidate this position, taking advantage of new market trends, which are in line with alternative drinks that can substitute the consumption of beer.
1.
Research Snapshot
Heineken N.V.
Hold
Low risk
29 October 2018Portugal
+5,3% upside €91,55Source: Personal analysis
Table 1: Author´s risk assessment
30 40 50 60 70 80 90 100 D e c -1 2 J u n -1 3 D e c -1 3 J u n -1 4 D e c -1 4 J u n -1 5 D e c -1 5 J u n -1 6 D e c -1 6 J u n -1 7
1864 - Haystack 1874 -Heineken’s Bierbrouwerij Maatschappij NV
1972 - Heineken N.V.
160 170 180 190 200 210 220 230 2013 2014 2015 2016 2017 26 28 30 32 34 36 38 2013 2014 2015 2016 2017 18.000 19.000 20.000 21.000 22.000 23.000 2013 2014 2015 2016 2017Figure 2: Changes on company´s name
Figure 3: Consolidated beer volume (in millions of hectoliters)
Figure 4: Heineken®´s volume (in millions of hectoliters)
Figure 5: Revenues (in millions of €)
Heineken N.V. (HEINEKEN) is a Dutch brewing company headquartered in Amsterdam. In terms of revenues, the Group is nowadays the number one brewer in Europe, and the second worldwide, only behind AB InBev. Having operations in more than 70 markets, HEINEKEN is the world´s most international brewer. In its portfolio there are over 300 brands, including international, regional, local and specialty beers and ciders, being Heineken® their global leading brand.
Brief history
Back in 1864, Gerard Adriaan Heineken bought Haystack, a small brewery located in the center of Amsterdam.
In 1873, Heineken opened a new brewery in Rotterdam: “Heineken’s Bierbrouwerij Maatschappij NV” (HBM), and in 1874, a second one, guaranteeing the necessary conditions to start the exportations in 1876, to France.
In 1914, Gerard´s son, Henry Heineken took control of the company, completing the first acquisition of a foreign brand in 1927, by acquiring “The Brasserie Leopold” in Brussels. 30´s decade was defined by the entrances on the Asian market and on American market, where HBM were the first foreign imported beer.
In 1968, HBM bought Amstel, Holland´s second largest brewery, getting close to 60% market share in the national market.
In 1972, Alfred Heineken changed the company´s name to Heineken N.V., one year after took control. The next decades were characterized by the international expansion. First in Europe, the acquisition of both Brasserie de l’Espérance and Italian Dreher group gave HEINEKEN a strong position on the European market. Due to that, HEINEKEN had to renew their facilities, to respond to increasing demand, closing the old brewery in Rotterdam and opening a new one in Zoeterwoude, starting like this their tradition of environmentally sustainable brewing.
Since the 80’s until now, HEINEKEN completed a significant amount of acquisitions and investments in new facilities, supporting its consolidation process, in which stands out the acquisition of Spanish brewery Cruzcampo, in 2000, and Brau-Beteiligungs AG (the Austrian market leader at the time). The Western market becomes strong in 2008 with the acquisition of Scottish & Newcastle, in a partnership with Carlsberg. In 2010, HEINEKEN took over FEMSA ((Fomento Económico Mexicano, S.A.B.), which was the second largest brewery in one of the most profitable markets in the world, and in 2012 the company increase its share part in Asia Pacific Breweries.
Operational segments/regions
Since HEINEKEN is present in many countries, producing and/or selling numerous and different products in each one, the segment division adopted throughout this equity research is the same as the company.
HEINEKEN divides its business into five operating segments: Europe; Americas; Africa, Middle East & Eastern Europe; Asia Pacific; Head Office and Other/eliminations.
The first four segments listed above are HEINEKEN´s business regions, and each one of them has its own Regional President. The fifth is a segment that is directly linked to the responsibility of the Executive Board.
Europe: This segment has as key brands Heineken®, Cruzcampo, Birra Moretti, Żywiec and Strongbow.
Given that it is the region where HEINEKEN started their operations, it has indicators that show that this area is the one that generates more revenues to the company, with a percentage of 45.4 of its total. In terms of consolidated beer volume, 78.8mhl was the value registered in the last year, representing a slight increase compared to the previous year 2016. Although, in terms of its total operations worldwide, it has shown
2.
Business Description
Source: Heineken Collection Foundation
Source: Heineken N.V. Annual Report 2017
Source: Heineken N.V. Annual Report 2017
Figure 6: Revenue by Region (in percentage of total)
Figure 7: Percentage of Operating Profit by region
Figure 8: Operating Profit by region (in percentage of total)
a decrease from 39.3% to 36.1%. These figures translate into a nominal value of revenues of €10,237m, with an operating profit, and margin, before exceptional items and amortization of acquisition-related intangible assets (beia) of €1,371m and 35.1%, respectively, with the last indicator denoting a decrease of 0.1% compare to 2016. The main brand, Heineken® volume continue to increase on this area, up to 13.8mhl. Americas: The Americas continue to be a segment with good growth margins, especially due to the performance of its main brands, like Heineken®, Tecate Light, Schin, Dos Equis and Lagunitas.
In 2017 the region delivered strong results in Mexico, Brazil and Haiti, where it has expanded their volumes, revenues and profits. On the other hand, the US beer market does not perform so well, with the sales of Heineken® Light partially offsetting the declines of Heineken® lager.
These scenarios result in a percentage of 27.8 of revenues (beia), as the company´s total. To reach a significant increase in revenues related to 2016, which went from €5,203 to €6,258m, the firm had to increase in 22.8% their consolidated beer volume, up to 72.1mhl. Due to that, this region represented 33.1% of consolidated beer volume on the firm´s total. Also, the main brand, Heineken®, increase its volume over 9.1% in 2017, from 9.8mhl to 10.7mhl. In terms of operating profit, the Americas in 2017 were the segment that better perform compared to the previous year, with an increase of 16.4%, reaching €1,188m. As a percentage of the HEINEKEN´s total, the Americas represented 30.4% of the operating profit (beia).
Africa, Middle East & Eastern Europe: This segment is the one that faces more macroeconomic challenges, like the rising inflation and currency pressure specially in countries like Nigeria and Egypt. However, driven by its key brands like Heineken®, Primus, Amstel, Walia and Ivoire, 2017 was the year in which this region marked the return to positive volume growth. Ethiopia, South Africa and Russia exhibited the solidest growth in the segment.
Although with shorter difference, the region continues to be the third that provide better revenues (beia) to HEINEKEN, with 13.6% of its total. The Heineken® brand continue to grow in terms of volume, to 5.2mhl, contributing to the increase of consolidated beer volume, which went from 38.4mhl to 40.1mhl in 2017. Concerning the total of the firm, the segment decreases its contribution to 18.4%. Despite the decrease of the region´s shown by its operating profit (beia), which grows 3.2%, up to €388m. Besides this increase, this segment continues to be the one with shorter impact on total operating profit (beia), with a contribution of only 9.9% of HEINEKEN´s total.
Asia Pacific: Supported by its vital brands Heineken®, Tiger, Anchor, Larue and Bintang, the region continues to improve its volumes, revenues and profit. To enhance this, Vietnam and Cambodia were the countries that better perform during 2017. Tiger brand continues to evolve, reaching 11.5mhl sales, more than the star brand Heineken®, which volume decreases from 6.6mhl to 6.3mhl in the past year. The contribution for the total revenues (beia), of this segment was the lowest of the four regional segments, with 13,3%, although the improvements on other indicators. Concerning the production capacity, it has grown 10,7%, featuring 27mhl in the region, and representing 12,4% of HEINEKEN´s total. The growth on the nominal value of revenues (beia), up to €2.996m, also resulted in an operating profit (beia) increase, from €927m to €962, meaning that this is the firm´s region with highest efficiency on its production/selling areas. The previous value is translated on 24,6% contribution to the total operating profit (beia) of the firm, nevertheless recording a decrease of 0,8% comparing to 2016, in which the region was able to proportionate 25,8% of HEINEKEN´s total operating profit.
Source: Heineken N.V. Annual Report 2017
Source: Heineken N.V. Annual Report 2017
-15% -10% -5% 0% 5% 10% 0 4.000 8.000 12.000 16.000 20.000 Raw materials, consumables and services Personnel expenses Amortisation, depreciation and impairments Total Expenses 2016 2017 %Δ
Figure 9: Expenses (in millions of €)
Head Office and Other/eliminations: Concerning this segment, the results available refers to negative revenues (beia) of €641m, and an operating profit (beia) also negative of €150m. Comparing to 2016, there has been a slight decrease in the revenues (beia), up to €20m, which results on a notable change on operating profit (beia), decreasing 233%.
Key drivers of profitability (revenues/expenses)
In the beginning of 2017, HEINEKEN replaced EBIT for operating profit (beia) as their key driver of profitability. Company´s management took this decision because operating profit better translates the profitability that is directly controlled by HEINEKEN. Although both operating profit and operating profit (beia) are not measure in accordance to IFRS, management use them to evaluate de segment´s performance. In 2017 HEINEKEN continued to improve their organic operating profit (beia) by 9.3%, excluding €188m of negative currency impact, and €80m from consolidated changes, reducing the rhythm from the first half of the year (11.7%) mainly due to the increase of commercial investments. Total operating profit (beia) growth was 6.2%, reporting an absolute value of €3,759m. The company had increase their operating profit (beia) margin to 17.2%, reflecting higher revenues and cost efficiencies.
Which concerns to the company´s revenues (beia), there were an organic increase of 5%, from €20,792m in 2016, to €21,908m in 2017, also related to the growth of 2.9% on total consolidated volume, which as an impact on revenue (beia) per hectoliter of positives 2.1%. On the other hand, currency developments had a negative effect of €817m, essentially due to the British pound, Nigerian Naira, the Congolese Franc, the Mexican Peso and the Egyptian Pound. Consolidated changes impacted the firm´s profitability in €891m.
To leverage the increase on revenues, Heineken® volume grew 4.5%, benefiting from good marketing strategies with global platforms like UEFA Champions League and Formula 1®. Heineken® Light continued to grow, compensating the lower volume in the US with the launching on Mexico, Indonesia, Poland, Greece and Switzerland. Heineken® 0.0 is exceeding expectations in the sixteen markets where it is present. Other strong brand like Tiger, Krušovice and Birra Moretti volume growth was higher than 10%. Tecate, Red Stripe and Red Stripe´s volumes also grow. Amstel volume, despite of the growth in Brazil, was flat due to the decline in Nigeria and Greece. The brand Sol suffered a decrease on domestic market, which results on the decline of its volume, with the robust growth in Mexico not being enough.
Cider markets continued stable, registering a slight increase on its volume, mainly due to the strategy outside UK, where volumes decline due to a partial delisting. Low & No-Alcohol (LNA) also registered a slight growth, with Radler and Heineken® 0.0 brands leveraging the company on Europe but suffering a volume´s decrease on Nigeria and Egypt due to macroeconomic conditions and consumer behaviors.
Craft & Variety volume increase on both international craft beers and local craft proportions.
From the total expenses (beia) side, the nominal value had increase to €18,149m, growing 4.1% on an organic basis. Marketing and selling (beia) expenses, although it had registered an increase in 2017 to €2,888m, its share on total expenses decrease from 13.6% to 13.2%. The inputs costs also recorded an organic increase of 4.7% and on a consolidated level, raw materials ascended to €1,817m mainly due to adverse currency movements, which had an impact at a transactional level. In line with raw materials and marketing and selling expenses, the non-returnable packaging represented a considerable amount (17.9%) on total expenses in 2017, increasing when compared to 2016 (related to increase on revenues). With a shorter impact compared to 2016, amortization, depreciation and impairments decreased 14.5%, to €1,587m.
Source: Heineken N.V. Annual Report 2017
Source: Heineken N.V. Annual Report 2017 Table 2: Raw materials (in percentage of total)
• Heineken® • Craft & Variety • Low and No-alcohol • Cider
"Deliver top line growth"
• Developing markets • Supply chain
"Drive end2end performance"
• Drop the C • Every Drop
"Brew a better world"
• Inovation • Creativity • Culture
"Engage and develop our people"
Figure 10: Strategies
Figure 11: Ownership Structure
Company strategies
HEINEKEN´s strategy relies on four main priorities. The company aims to gain market share, while focus on long-term sustainability, continued growth and shareholder value.
“Deliver top line growth”: HEINEKEN is focused on being the number one player on beer and cider markets worldwide and to leverage their main brand Heineken®. Besides, the company intends to gain additional costumers and to reach more houses by leading the craft & variety, low- and no-alcohol and cider markets. To do so, the company expanded cider portfolio to more than fifty markets and launched a new craft & variety online business channel for consumers, the “Beerwulf”.
“Drive end2end performance”: The purpose is to leverage future growth and increase company´s margins and efficiency. To do so, HEINEKEN is optimizing processes and eliminating duplication costs that add no value by improving their capital expenditures and working capital. One driver of this strategy is to invest on developing markets. The company plans to keep developing their BASE program and to deploy it on Asia Pacific, Africa, Middle East & Eastern Europe and Caribbean, becoming more efficient by homogenizing core business processes. Another way to drive this strategy is throughout procurement, since the firm is reducing their strategic suppliers, permitting a reduction of base costs and increasing cash benefits. Besides, HEINEKEN will continue to improve their Heineken Product Implementation (NPI) in order to introduce new products faster and efficiently in the markets.
“Brew a Better World”: HEINEKEN continues to focus their grow in a sustainable base. The company has already started implementing the program “Drop the C´”, which focuses on reducing carbon emissions, and will start the “Every Drop” program, focused on water. Besides, there as social campaigns taking place at internally and externally.
“Engage and develop our people”: The company will continue to improve their people and culture. Diversity is viewed as the driver of innovation, creativity and business success, and there is already a program of “Inclusion & Diversity” in progress and a new internal digital engagement platform, workplace by Facebook.
Shareholder structure
Heineken N.V. is 50.005% controlled by Heineken Holding N.V., 8.632% by FEMSA through its affiliate CB Equity and 41,363% by public shareholders, in which includes shares held in Treasury.
Heineken Holding N.V. was created in 1952 with the purpose of guarantee the continuity, independence and stability of HEINEKEN. The ownership of Heineken Holding N.V. is made by L’Arche Green N.V., with 52.599% shares, in which 88.86% are controlled by the Heineken Family and 11.14% by the Hoyer Family. 31.139% are possessed by public shareholders, being the remaining 12.262% shares hold by FEMSA, in a partnership with Heineken N.V., representing 14.76% of the economic interests of Heineken Group.
Management and Corporate Governance
HEINEKEN´s management and supervisory structure is ordered under a two-tier system, of which the Executive Board and the Supervisory Board are part, and independent of each one. Both are accountable on the Annual General Meeting (AGM). It is mandatory for the company to fulfill the Dutch Corporate Governance Code, which has been revised on 8 December 2016.
3.
Management and Corporate Governance
Source: Heineken N.V. Annual Report 2017
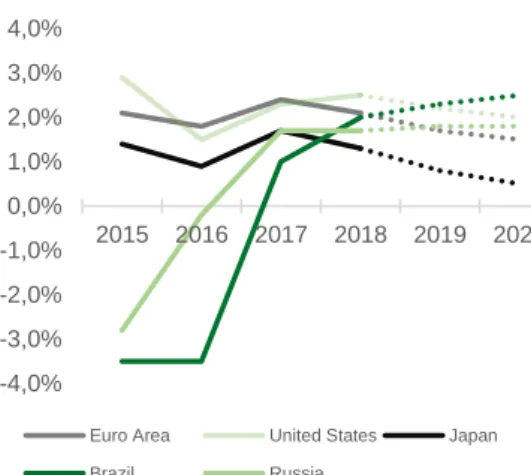
Supervosory board Audit Committee America Committee Preparatory Committee Selection & Appoitment Committee Remuneration Committee -4,0% -3,0% -2,0% -1,0% 0,0% 1,0% 2,0% 3,0% 4,0% 2015 2016 2017 2018 2019 2020
Euro Area United States Japan
Brazil Russia 0,0% 1,0% 2,0% 3,0% 4,0% 5,0% 2015 2016 2017 2018 2019 2020 Global Advanced economies
Emerging markets and developing economies Figure 12: Supervisory Board and Commitees
Figure 13: Real GDP growth
Figure 14: Real GDP growth
Executive Board´s is responsible to manage the company, which includes to set and achieve operational and financial objectives, and to develop the necessary strategies. It is composed by two members: The Chairman/CEO and the CFO, which are appointed for a maximum period of four year, in which only of the two can be re-elected, by the Supervisory Board on the AGM.
Supervisory Board´s members are ten. From these ten, six of them are independent between themselves, and the other four are strictly connected to A.H. Heineken, to preserve the continuity of Heineken Group. The purpose consists on supervising the Executive Board and to ensure external experience into HEINEKEN´s way of operating.
To help the Supervisory Board on their decisions, there are five Committees: Audit Committee; the Americas Committee; Preparatory Committee; Remuneration Committee and the Selection & Appointment Committee.
Corporate governance meets the company's diversity strategy in terms of people. As a family-owned company in its majority, it is hard for external investors to have a significant participation on HEINEKEN, attenuating the interest they may have in investing. Besides, since every crucial decision must be voted by the majority on the AGM, the family can easily impose their ideas and long-term strategies.
Global economic outlook
Global economy is facing a cycle of recovery, aided by a recovery in investment, manufacturing activity and trade. Better conditions of global financing like accommodative policies, rising confidence and firming commodity prices are behind this recovery. Estimation for global real GDP growth is 3,1% in 2018, thus surpassing the growths of 2016 and 2017, which were 2,4% and 3%, respectively, reflecting the notable growth of more than 50% of world economies, including the notable
improvement on Euro Area.
In the next few years, it is expected that real GDP growth on advanced economies slows down to 2,2% in 2018 and 1,8% average 2019-2020, coinciding with the stabilization of cyclical upturn, after the recuperation in 2017 of 2,2%. With an important impact on global economy, these economies show a recovery in capital spending and exports, mainly in Euro Area, followed by United States and Japan. Growth on emerging economies will accelerate at an average of 4,7% in 2019-2020, driven by the activity of commodity exporters, with Brazil and Russia as the main players, and a stable growth of commodity importers, in which several large economies will compensate the slowdown of China.
Industry overview
HEINEKEN operates in the beverages industry, which can be into sub-industries like Brewers, Soft Drinks & Waters, Wine & Spirits. Since HEINEKEN main activities are the production and selling of beer, and because the company´s Annual Reports do not separate their operations between different beverages, only an analysis of the beer industry is presented.
Global beer industry
The global market is valued in around €630.000m, which is about two and a half times larger than wine market and two times the spiritual drinks market. It is expected a continuous growth of 6% CAGR, reaching a value of roughly €890.000m by 2022. This continuous value´s growth is essentially related to increased consumption in developing countries. Concerning the volumes, despite the slowdown on established beer markets due to increasing saturation, global beer market continued to be the larger, representing 77,5% of global alcoholic drinks market, with 193.100m liters.
4.
Industry Overview and Competitive Positioning
Source: Heineken N.V. Annual Report 2017
Source: Global Economic Prospects – January 2018
Source: Global Economic Prospects – January 2018
0% 1% 2% 3% 4% 5% 6% 7% 8% Europe North America South America Asia Pacific 2012-2016 2016-2021
Figure 15: 2021 expected market value by region (in percentage´ average)
Figure 16: Value´ CAGR by region (in percentage´ average)
Beer industry dynamics are dependent on several factors such as GDP per capita, legislation, demographic indicators, market environment and others soft drivers like changes in lifestyle. Besides, since each region has their own patterns on each factor, a regional overview is presented, as well as global trends like market consolidation and premiumization.
Consolidation: Over the last few years, the top five brewers increase their combined market share in 7%, up to 53%, and if the top ten brewers are considered, the combined market share is 66,2%. This consolidation is mainly driven by the expansion of major companies, by two perspectives. One the one hand, acquisitions like the ones carried out by HEINEKEN, which acquired FEMSA in 2010, Asia Pacific Breweries in 2012 and Lagunitas in 2017, and the purchases of Grupo Modelo and SABMiller by AB InBev. On the other hand, the expansion of the leading brands to emerging markets, like Asia Pacific.
Premiumization: Based on their size and manufacturing capacity, breweries can be either microbreweries or macro breweries. Given the market entry facilities, microbreweries are registering a remarkable growth over the last few years, leveraged by increased consumer willingness to experiment locally produced premium beer. Besides, the growth in consumption of light beer (premium) is expected to register a higher CAGR in comparison with strong beer. The facts that more consumers are increasing their preferences to low calories and low alcohol products, combined with the rising number of female consumers in the age group of 21 to 30 years old, can be another premiumization indicator.
This trend is also levered by China, which with 460.000m liters produced in 2016 is the country with the highest volume of beer production. In this market, premium lager consumption is expected to increase in 4.000m liters until 2021 as an outcome of urbanization and western culture influence, particularly in younger groups, who are looking for higher quality beers, imported ones, or craft ones.
Segment overview
Europe: Over the last years, beer industry on Europe has witnessed moderate growth. Economic challenges which affect market growth and increased health concerns that are switching consumers preferences, were translated on inferior performance of crucial markets like Germany, France and UK. In terms of value, the registered CAGR over the period 2012-2016 was 1,5%, although revealing no growth in 2016 compared to the previous year, keeping the market valued on nearly €195.000m. Besides the 1,5% growth rate on this segment, Germany and UK, which together comprise 37,2% of European beer market, grew at lower CAGR level, 0,9% and 0,5%, respectively. The market value´s forecast is positive, since it is expected an acceleration up to 4,9% CAGR until 2021, with an acceleration on growth of major markets, reaching a total of nearly €250.000m. Concerning consumption volumes, have decay around 1,8% CAGR, to approximately 30.000m liters, being expected that until 2021 these volumes will continue to fall at a stable CAGR of 0,02%.
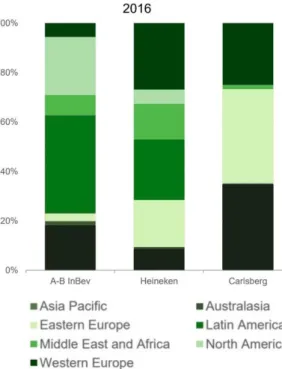
Europe is a market segment very consolidated, since the 3 key players combine, comprise 50% of market share, with HEINEKEN the main player, followed by AB InBev and Carlsberg. On trade is the major via of beer commercialization, with 64% stake, with hyper and supermarkets having a weight of only 23,4%.
Americas: The analysis of this segment distinguish North America (United States and Canada, and Mexico included) from Brazil.
The first group is dominated by United States (79,5% weight), and is valued on approximately €160.000m, recording a CAGR of 4,2% from 2012 to 2016. This line of growth is expected to remain stable until 2021, when the market is predictable to be
Source: Heineken Passport
Source: Market Line Beer & Cider
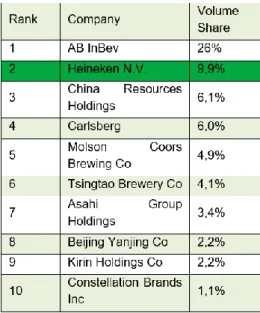
Source: Market Line Beer & Cider Table 3: Top 10 companies´ volume market share
-2% -1% 0% 1% 2% 3% 4% Europe North America South America Asia Pacific 2016-2021 2012-2016 Figure 17: Volume´ CAGR by region (in percentage´ average)
Figure 18:Goods and services purchases by supply sector (in percentage)
worth nearly €200.000m, largely determined by economic stability, with an impact on rising disposable income. Due to health awareness, the growth is limited especially among young consumers. However, Canadian market will probably decline with a CAGR of 0,1%, while Mexican market will increase at a CAGR of 5,6%. It is estimated that in 2021 the United States, Mexican and Canadian markets reach, respectively, €160.000m, €20.000m and €16.855m. In terms of volumes, the CAGR is likely to be constant, at 1,2% average until 2021, increase from 34.000m liters up to 36.000m liters.
In line with Europe, on trade segment is the fundamental way of commercialization, followed by hyper and supermarkets, with both having a combine weight of 73,6%. Here, the market is very consolidated as well, with the main players together leaving only 25% share to minor competitors.
In South America, Brazil is the key market, since it is by significant difference the largest producer and consumer of this segment with 20% on total America´s segment. However, the value´s growth of 6,8% CAGR verified during the period 2012-2016, will probably slowdown to 3,1% CAGR until 2021, in which the market will likely be valued on €39.700m. The robust growth, despite the economic slowdown, was due to higher demand for smaller packaging variants and changes on consumption patterns. South Africa: This country is the first alcohol consumer on Africa, even if economic challenges affected the overall market. The pattern of consumption is being marked by increasing focus on authenticity and innovation. Due to that, demand is changing their preferences to local and smaller brewers. Based on these tendencies, this market is expected to grow at 23% CAGR until 2021, reaching a value of €11.860m.
Asia Pacific: Given a solid growth verified during the period 2012-2016, the market is valued on €205.740m, being expected to grow at 5,9% CAGR, up to €274.000m, driven by stronger growth expected on China (6,6% CAGR), and increasing market volumes on South Korea and India. Although this increase, market volumes are likely to slightly decrease over the next period at a 1,7% CAGR, to 57.078m liters.
Differences compared to other regions can be seen at consolidation level. Most of the market share of this segment is delivered to small consumers, and not to main players, since the stake to minor players is 56,4% today.
Supply analysis
Brewers´ supply is made throughout distinct types of goods and services. This research is focused on the sectors with most weight among them, such as packaging industry and raw materials provided by agriculture.
Packaging industry: It represents nearly 30% of total brewers supply. Among total packaging, glass bottles, metal cans and kegs have 44,2%, 24,7% and 20,7% share, respectively.
Glass designated to packaging market was valued in €45.000m upon 2016, but the forecast is to grow at 4,5% CAGR until 2024. The slice designated to serve beer industry has been rising, accounting 20% of overall market, and it is estimated to grow at an equal CAGR of 4,5% due to increasing availability of varied sizes and shapes of beer bottles and innovations in chemical composition and design. On Asia Pacific it is located 40% of this industry, due to increasing demand of beer, huge customer base and developments on hospitality sector. In North America the growth is expected to be at 3% CAGR, also due to a well-developed pharmaceutical industry, which can impact the bottle manufacturing cost.
Despite glass remains chemically inert and pure on contact with many substances, allowing product safety, some handicaps like brightness, higher cost and transportation difficulties are increasingly demand for plastic materials on packaging industry, and these will likely hamper the share of glass on packaging.
Source: Market Line Beer & Cider
Figure 19:Packaging materials by type (in percentage)
Figure 20:Global market vs Heineken 2011-2016 yoy (in percentage)
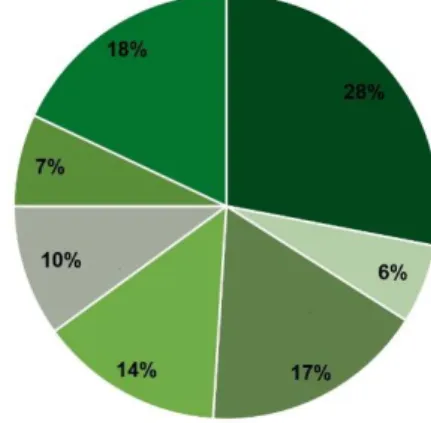
Figure 21: Regional market share (in percentage)
Cans are usually made from aluminum due to its light weight and ease of recycling. The global demand for cans is increasing and it is mainly due to breweries growth and shifts on packaging necessities, with 46% and 45% weight, respectively. New breweries represent only 3% of demand increase.
New US legislation for aluminum may impact beer industry, since President Donald Trump announced that imported aluminum would be subject of tariffs. In the US, one of the main markets of beer, 52% of aluminum is imported, and despite the willingness of most breweries to stop import these metals, the internal supply is not enough, so these companies must continue their productions with imported products. On a per-can basis, the 10% tariff add may be considered low to beer consumers, because a six pack will only cost 6 cents more. But for brewers, production expenses may increase heavily, and may result on loss of sales.
Raw materials: It represents nearly 20% of total brewers supply, being barley, the main agriculture product used to produce beer. Despite its production costs followed a stable trend, which is expected to continue in 2018, barley prices have increased in 2017 after several years following a decreasing movement. In 2018 it is also expected that barley prices, per bushel, increase between 6% to 20%, driven essentially by tightening supplies and demand increases.
Competitive analysis
Over the last years, concerning the volumes’ growth, HEINEKEN went from outperform the global market in 2012, boosted by the growth of its key markets and by the acquisition of Asia Pacific Breweries, to struggle and underperform global market in 2013. Such a trend is explained by the weak performance of Heineken® in the US, after this, it overlaps again for three consecutive years, levered by premiumization trend and strong performances of several key markets, such as Brazil, Mexico and Asian markets.
Market share: HEINEKEN´s volume share continues to improve and to fix a solid second place, with 10% share, benefiting from the strong growth of emergent markets and from the acquisition of Lagunitas in 2017, despite the increasing gap registered to the major player, AB InBev. In fact, the main player always had an acquisition strategy to support its development, since the expansion to Asia Pacific markets, where the company gain the lead on South Korean by reacquire Oriental Brewery, and by purchasing Siping Ginsber and three major Big Boss breweries on Chinese market. In 2016, AB InBev acquired SABMiller, extending its advantage over competitors by having 26% market share.
Considering other important players roles in the market, China Resources saw its market share increase 6,0%, to 6,1%, achieving the third place globally driven by its light growth on its home market. Molson Coors and Asahi improve substantially their market shares in 2016, from 3,1% and 1,1%, to 4,9% and 3,4%, respectively. The first one entered in a joint venture in the US, where it took full control of MillerCoors, while Asahi purchase SABMiller´s European businesses, including total rights of brands like Peroni and Grolsch, in a move that gave the company for the first time, a foothold in the key Western European markets, as well as Eastern European interest.
HEINEKEN vs AB InBev competition: The dispute for market between the two larger brewers is generally intensifying, with the strategy to gain market share varying between companies´ segments, with the exception that both are increasing their focus on premiumization.
In the US, where HEINEKEN as a strong focus on premium lager market, AB InBev exceed HEINEKEN in nearly 1.000m litters concerning standard lager, which means an overlap of 4,4%. Related to premium beer, the difference between both companies is only 0,9%, despite the efforts made by AB InBev to gain market share across younger generations. Constellation Brands are the number one player on sales in premium US market.
Regarding standard lager, Russia and UK are the markets where the difference is more pronounced and where HEINEKEN has low expression. China and Brazil are markets
Source: Brewers of Europe
Source: Heineken Passport
0 1 2 3 4 5 Rivarly intensity Threat of new competitors Suppliers bargaining power Availability of substitutes Clients bargaining power
Figure 22: Porter 5 forces
with an intense and equilibrated competition but with little advantage to the main player, while in Italy and Netherlands, HEINEKEN dominates.
Cider market consolidation: Cider market is on the same way as beer market, since its top five brewers have together 49% of market share. Considering the top ten breweries, only around 38% market share is left to small competitors. In this product segment, the trend is also premiumization. The main competitor is HEINEKEN, which increase its market share in 2016, up to 17,3%, especially due to expansion strategy to emerging markets and the introduction of new flavors in key markets. Despite the leadership on beer market and the acquisition of SABMiller, in the cider market AB InBev has only 3,7% share, being only the number 6. For its turn, Carlsberg, which registered an increase to 5,1% share due to its dominance in the most promising cider, Eastern Europe, occupies the fifth place on cider market. For their turn, both second and third players decrease market shares, at the same time as Boston Beer Co saw the decline in US cider market affecting their shares.
Competitive positioning
Porter 5 Forces
Rivalry Intensity (strong): Consolidation is highly present on beer industry. All the top players are large brewers capable of benefiting from economies of scale, with low marginal fixed costs, and capable of promoting their main brands, making them easily identifiable by the public. The degree of rivalry is intensified by the low difference concerning the relation price/quality between standard beers and by the low changing costs. Besides consolidation, the number of microbreweries offering craft beer is high, especially on emergent markets.
Threat of new competitors (moderate): To enter this market requires significant investments. Nevertheless, since premiumization is present in the market, a company can enter the market as a microbrewery and get good margins, recovering from initial investment. To become a larger company is much more difficult, because although the supply is accessible, good contracts to start mass production are harder to obtain, as well as entry on trade channels, since these retail houses demand high margins. In some countries, government regulation can be a barrier to enter the market.
Suppliers bargaining power (moderate): The main players incorporate some vertical integration to have more control about their supply. If this is not the case, long term contracts are made with independent suppliers of their raw materials. The facts that there are no substitutes products for raw materials, and the importance given to the quality of those products increase the supply power. The same happens to packaging materials, utilities and transportation costs.
Clients bargaining power (moderate): Low switching costs to the final consumer is the main force of clients’ power. However, there are some cases in which retailers may have some power to negotiate quantity discounts, since on trade business is the major channel to consumers. Yet, since this is generally not the case, and one final consumer do not represent a big stake of companies´ revenues, there is no discount possibilities. Availability of substitutes (low): The main substitutes for beer are other alcoholic drinks, such as spiritual drinks and wine, which are a lot more expensive. In some key markets, drinking beer is part of cultural tradition while people are hanging out, decreasing the preference for other drinks.
SWOT Strengths
World most international brewer: The strong presence in more than 70 countries allow the company to monitor the growth of several emergent markets and to attract new
Source: Heineken Passport
Source: Personal Analysis
Heineken®
Tecate
Kaiser
Amstel
Tiger
Figure 23: Heineken´ top 5 brands
Figure 24: Asia Pacific beer market share by volume (in percentage)
consumers. It gives HEINEKEN the capacity to generate more revenues and to mitigate various economical and financial risks associated to certain activities in some countries.
Premium focus: HEINEKEN is one of the leading companies on premium market. This allow the company to follow premiumization trend in developed and emergent markets. Brand innovation: The company´s commitment to innovation increase HEINEKEN competitive advantage by being the first to launch some products. The large portfolio proves that the company can adjust itself to new consumer´s preferences and tastes Marketing Strategies: HEINEKEN is one major sponsor of UEFA Champions League, and in February 2017 extended its contract in another three years, adding lots of visibility to the brand since its one of the most viewed competitions worldwide. Besides, it has a lot of innovating marketing strategies.
Vision oriented towards sustainability: The commitment to be a sustainable company in all the value chain can enhance both short-term and long-term performance of the company. Besides the advantages value delivered to all stakeholders, it is a way to obtain new investors, since future results are more likely to be positive. Sustainable programs are one key point on the expansion plans to the company.
Long history: Long history and successful past of HEINEKEN, both in internal market and international expansion give the company creditability concerning several aspects like its values and business management.
Weaknesses
Limited presence in some markets: Despite the strong presence across many regions, it still lacks presence in some growing markets as Sub-Saharan markets, which are recognized as low income consumers, and Australian market, which is a country with high beer consumption per capita.
Western Europe: The company, despite the strong and growing presence across many markets, continues to have most of its revenues on Westerns Europe market, where the industry is stagnant and has low growing margins.
Lawsuits against: The company is currently defending itself against some legal proceeding. This can affect company´s results and the interest of some potential investors, as well as deteriorate HEINEKEN brand.
Opportunities
Asia Pacific: Asia Pacific, although its present size, has capability to grow a lot more and to become the main beer market. The acquisition of Asia Pacific Breweries brings HEINEKEN an opportunity to explore and to evolve in this market, thus surpassing the Western Europe stagnation problem.
US: The acquisition of the remaining 50% share of Lagunitas Brewing Company, which now reports to HEINEKEN America gives conditions to take a rare opportunity advantage on the US market, since HEINEKEN´s Mexican brands are performing well on it.
Global growing demand: Demand forecasts are positives, with the expected CAGR fixed on 5,6% until 2021. Merger and acquisition strategies followed by HEINEKEN will help to catch up and to absorve new market opportunities as to increase market share on consolidated markets.
Increasing health awareness: HEINEKEN, although its major operations are on alcoholic beverages market, has experienced significant improvement on low and zero alcohol markets. This is an opportunity as it shows the ease of adaptation to new consumption patterns.
Higher quality standards: Consumers are increasing their standards related to beer quality. Which concerns HEINEKEN, the brand is recognized for high quality production compared to most of its peers.
Source: Heineken Passport
Threats
Macro challenges: Even though global economy is facing a recovery cycle, leveraged mainly by emergent economies growth, macroeconomic challenges on some beer key markets may impact the industry wealth.
Gap to AB InBev: AB InBev latest strategies led to a record gap concerning market shares, consolidating HEINEKEN as the second largest brewery. Related to this, the huge presence of the rival on Sub-Saharan and Latin America markets can negatively impact the future growth of HEINEKEN.
Increasing health awareness: Despite the opportunity related to this topic, there are always the threat of HEINEKEN decrease its revenues due to increasing health awareness.
Raw material: Although HEINEKEN uses forward contracts to mitigate this risk, price fluctuations due to higher demand from other markets and non-availability of necessary raw materials can impact gross margins and/or the stability of operations.
Legislation: Tighter legislation in some markets imposed by their governments can highly affect companies’ revenues and operations.
The recommendation to HEINEKEN is a HOLD with a target price of €91,55/sh for 2018YE issuing a FCFF method with an upside potential of 5,3% comparing to the December 31 closing price of €86,93/sh, with low-risk. Adjusted Present Value and Free Cash Flow to Equity supports this hold recommendation point of view with €90,48/sh and €88,82/sh, respectively, with both indicating that HEIA is currently undervalued.
Key value drivers and potential catalysts
The entering on Asia Pacific market and the stronger bet on American market: through the acquisitions of Asia Pacific Breweries and the remaining 50% piece of Lagunitas, respectively, HEINEKEN is solidifying its position in exploring new opportunities in markets that are not consolidated. On these markets it is possible to increase profitability decrease production costs. Throughout the forecasted period (2018 to 2022), it is expected that these segment´s influence on total revenues will increase, mainly due to the consolidated beer volumes: in the Americas, during the next five year, volumes are likely to increase 16,8%, while in Asia Pacific the growth is expected to be 41%.
Cider market is gaining importance on HEINEKEN´s portfolio: Although this market is following the European trend of consolidation (since the top five brewers combined have almost 50% share) it has been registering a demand growth worldwide. Currently HEINEKEN is the market share´s leader, and recent investments made by the company confirms that cider will gain influence on its portfolio.
Solid cash flow generation: the evaluation period between 2018 and 2022 is expected to be marked by the constant cash flows, mainly explained by operating activities, which will allow the company to have cash to settle its debt and to continuing the investment on market´s new opportunities. Linked to this cash generation are the Earnings Per Share (EPS), which are expected to increase from €3,4 in 2017 to €6,1 in 2022F. Dividends per Share (DPS) are also likely to grow from €1,77 to €2,81 during the same forecasted period.
Valuation method
In order to evaluate HEINEKEN, it was used three different valuation methods. Absolute valuation models used were the Discounted Cash Flow (DCF), the Adjusted
5.
Investment Summary
Source: Personal Analysis
Source: Personal Analysis
Table 5: DCF price target computations
Figure 25: Predicted FCFF for valuation period, including trendline
Figure 27: Regional percentage of revenues in 2022F
Present Value (APV), Free Cash Flow to Equity (FCFE). As complementary models it was used the Dividends Discount Model (DDM), which is another absolute method, and the relative valuation model, where it was used the Market Multiples approach. However, to perform final conclusions, only the first three absolute models are considered, being the DCF, the principal one.
Risks to achieve price target
Investors should be aware for the impact that the cost of capital for the Terminal Value has on the price target: one of the main assumptions in long-term WACC relies on the computation for the risk-free rate assumed. The 3,91% for the Rf was based on the assumption that current 10Y German bunds yields will not be maintained in the future, so the forecast was made having in consideration the 5Y average of the period before crisis - 31/12/2002 to 31/12/2007, for German bunds with 10Y maturity.
The impact of the predicted inflation: Selling prices have a lot of influence on the expected revenues, of which will derive a major part of the remaining assumptions. Besides, the 1,9% terminal growth rate was based on the expected inflation for 2022 of Netherlands, meaning that this recommendation is very dependent of this prediction.
Forecast analysis
On this section there are explained the items that were forecasted with more complex procedures, and the ones that derive directly from internal business analysis (business description), industry analysis and competitive positioning.
Revenues
To forecast the revenues for the period 2018-2022, the company´s revenues were divided by their operating segments: Europe; Americas; Africa, Middle East & Eastern Europe; Asia Pacific and Head Office and Other/eliminations.
Instead of forecasting directly the nominal value of revenues, the forecast is made by segment, both for beer volumes, based on the industry analysis, and for the selling price.
Europe: Since the European market is highly consolidated, there are short space to increase the revenues. Until 2019, the volumes are expected to slowly decrease at 1% and 0,5%, which is an inferior rate than the market, since HEINEKEN is at the moment outperforming it. From 2020, the volumes are expected to starting increase, first at a 1% rate, and in 2022 at a 2,5%, especially due to cider trend and premiumization, categories where HEINEKEN is leader and specialist.
Americas: Since the nominal growth on 2017 was related to acquisitions, the previous value of 2016 was fixed and this one expected to grow at a constant rate of: the average yoy% of 2014, 2015 and 2016, less 2% related to industry expectations for the volumes. The volume related to the last acquisitions is expected to grow at 3%, and slowdown to 2% in 2020.
Africa, Middle East & Eastern Europe: The macroeconomic conditions continue to be the same as the previous years in this region, so the expected growth that result from that will be assumed as constant. The good predictions for South Africa´ volumes, the new brewery on Mozambique and the triple digit growth of Strongbow will increase the previous growth in 2017 of 4,43% for 5% in 2018. This growth is expected to be maintained until 2020 and then slowly decrease to 4% in 2022.
Americas: Market volumes on this region are expected to decrease from 2019. Since HEINEKEN is investing here and outperforming the market, it will be assumed that in 2018 the growth will continue as the average of the last 4Y plus 1% related to the
6.
Valuation
Source: Personal Analysis
Source: Personal Analysis
increasing strong presence on cider market. From 2019 forwards, the growth will slow down to 6% until 2022.
Head Office and Other/eliminations: This segment is predicted to grow considering the estimations for global inflation.
All the computations for the Revenues can be consulted on Appendix 7.
Selling price
The selling price for the period 2013-2017 is the average that results from the total revenues divided by total consumption volumes, for each region. Based on that, the predicted price for the forecasted period 2018-2022 has in consideration the price selling prices of 2017 and the expected inflation for the different regions.
COGS (Raw materials, consumables and services)
Over the historical period, the company assumed a stable percentage of COGS, compared to its revenues. The range of this percentage went from 63,46% and 61,86%. Considering the short movements on the supply side, COGS are expected to be the average of 62,70% of the last five years in percentage of revenues.
Personnel expenses
With no indicators that might influence changes on personnel expenses, this item shown a similar behavior during the historical period as COGS. With a minimum percentage of sales of 15,69% (2016) and maximum of 16,22% (2017), the percentage´s historical average of 16,06% was assumed for the forecasted period 2018F-2022F.
CAPEX
HEINEKEN computes both PP&E and Intangible Assets values by assuming the sum of all investments made that occur in each item, subtracted by all costs. For the period 2018F-2022F, CAPEX is the value that is added to the accumulated costs of both items. Accumulated costs are expected to grow at a YOY% equal to the average of the historical period. 5,7% for PP&E and 19,9% for Intangible Assets. Both values make sense since the company is continuously investing in emergent markets.
Amortization, depreciation and impairments
In line with CAPEX, this item for PP&E is computed by the average (53,97%) of the historical period of the accumulated amortization, depreciation and impairments, in percentage of total costs of the previous year. The nominal value to appear on cash flow statement is the difference between consecutive years.
On Intangible Assets, since the percentage was constantly increasing during 2013-2017, it was assumed a percentage of accumulated total costs for the period 2018F-2022F of 14,5%. On this item, the value appearing on cash flow statement is also de difference between consecutive years.
Loans and borrowings
It is important to refer that these items, both current and non-current loans and borrowings and also bank overdrafts and commercial papers were computed in a different way compared to the values referred on the cash flow statement for their proceeds and repayments (financing activities). So, the values that appear on balance sheet and cash flow statement are explained in the correspondent appendixes, while all Loans and Borrowings computations can be consulted on Appendix 8.
Interests
Since the company discriminate each type of its obligations and disclose information, like the terms and the debt repayment schedule, interests for each year are computed
Source: Personal Analysis
Figure 28: Short-term borrowings through the forecasting period
Figure 29: Long-term borrowings through the forecasting period