Original article (short paper)
Two water environment adaptation models
enhance motor behavior and improve the success
of the lactate minimum test in swimming rats
Adriano Alves de Lima Cláudio Alexandre Gobatto Leonardo Henrique Dalcheco Messias
Pedro Paulo Menezes Scariot Lucas Dantas Maia Forte
Júlia Odas Santin
Fúlvia de Barros Manchado-Gobatto Universidade Estadual de Campinas, Limeira, SP, Brasil
Abstract — Aims: This study was designed to investigate the effects of 14 water environment adaptation days on motor behavior and physiological condition of swimming rats. Methods: Sixty male Wistar rats were divided into four groups— baseline (Bl) and control (Co) groups—which did not perform the water environment adaptation; and sub (SubAnT) and (SupraAnT) anaerobic threshold groups, which performed 14 water environment adaptation days with sub or supra anaerobic threshold progressive loads (from the tenth day), respectively. The climbing-swimming prevalence (i.e. motor behavior) was analyzed during the water environment adaptation days. Lactate minimum test (LMT) parameters and muscular/hepatic glycogen content in addition to serum creatine kinase were also measured. Results: Animals from SubAnT and SupraAnT groups presented a lower climbing-swimming pattern throughout the extent of the experiment (p=0.000), especially after the 5th session. These results were achieved without an improvement in the LMT results or glycogen/creatine kinase. In addition, improvements of 26.6% and 25% for the LMT success rate (i.e. LMT reliability) were obtained only for SubAnT and SupraAnT animals. Conclusion: Overall, we demonstrated that a water environment adaptation period is necessary for lowering the climbing-swimming pattern without physiological improvement.
Keywords: water environment adaptation, swimming pattern, lactate minimum test, success rate, rats.
Introduction
Although rodents have a recognized, innate swimming ability1,
studies have demonstrated that luminosity2, water temperature3,4
and the time of day5 may inluence swimming performance
in these animals. Furthermore, a discussion about the water environment adaptation was already initiated6, but its relevance
remains speculative and untested. Moreover, a myriad of lengths of water environment adaptation periods is evidenced in litera-ture7,8, 9,10,11,12, which impairs a solid discussion of this issue. In
addition to the above-mentioned factors, can water environment adaptation affect a rodent’s swimming performance, especially in terms of motor behavior (i.e. swimming pattern) and physi-ological conditions (i.e. aerobic and anaerobic capacities)? If so, what procedures should be done before the main experiment to properly adapt the rats to the water environment?
In our view, there are three main aims during the water environment adaptation period. First, studies have discussed
how stressful factors can inluence physiological responses to
exercise13,14,15,16. Stress can affect brain and cognitive functions,
in addition to impairing motor learning process17,18. Authors have
pointed that one response to this stressful condition is a distinct swimming pattern, such as climbing1. Considered as a deliberate
attempt to escape from the swimming tank, rats may over-spend energy sources during this swimming pattern, which in turn may
be relected in the physiological condition during the extent of
the experiment. Therefore, the water environment adaptation period must be considered to avoid non-desired swimming pat-terns, such as climbing. Second, the adaptation period cannot provide positive improvements in the physiological condition (i.e. aerobic and anaerobic capacities). If these improvements were achieved, then the main experiment could be biased and also provide dubious results because animals will already have submitted to stimuli that could confound the training effects. Lastly, the water environment adaptation should improve the success rate of physiological evaluations like the lactate mini-mum test (LMT)17, which has been used to determine aerobic
and anaerobic parameters18,19,20.
This study was designed to investigate the effects of 14 water environment adaptation days on motor behavior and the physiological condition of swimming rats. To investigate dif-ferent swimming adaption protocols, animals were submitted to sub and supra anaerobic threshold intensities during this period. Intensities above and below the anaerobic threshold were chosen since its use is common in experiments involv-ing swimminvolv-ing rats18,19,21. The main hypothesis of this study
in the LMT, performing a continuous swimming pattern; and b) since it is hypothesized that a lower climbing pattern will be performed throughout the experiment, a higher lactate minimum test success rate will be achieved after the water environment adaptation period in both groups.
Methods
Animals
Sixty male Wistar rats (Rattus norvegicus albinos) weighing 360.8±2.5 g at the start (77 days) and 405.6±3.2 g at the end of experiment (90 days) were used and obtained from the State University of Campinas central vivarium . Animals were housed in collective polysulfone cages (5 rats/cage, 5331 cm3/rat, 49
cm in length, 34 cm in width, and 16 cm in height). The labo-ratory room was maintained with a
controlled temperature
(23 ± 1 °C), relative humidity (45–55%), and noise (<
80 decibels) in a photoperiod of 12 h of light and 12 h
of darkness.
The same group of rats was kept together since weaning (21-days-old) until the end of the experiment. Free access to water and food (Labina-Purina®) were allowed for the extent of the experiment. All experiments were conducted according to The National Institutes of Health’s Guide for the Care and Use of Laboratory Animals. This study was approved by the institutional ethics committee (CEUA-UNICAMP, pro-tocol number: 3113-1).Experimental groups
Animals were randomly allocated in four groups: a baseline group (Bl: n=12), in which no intervention was implemented,
since the rats were only euthanized prior to initiation of the study; a control group (Co: n=16) in which rats only performed the LMT before and after the extent of the experiment; a sub anaerobic threshold group (SubAnT: n=16) in which rats performed the LMT before and after the extent of the experiment but also experienced 14 days of water environment adaptation with a sub anaerobic threshold progressive load (in terms of volume) from the tenth day; and a supra anaerobic threshold group (SupraAnT: n=16) in which rats were submitted to procedures similar to those of the SubAnT group but with a supra anaerobic threshold progressive load from the tenth day. The experimental period lasted 14 days, and rats were kept under these interventions from 77 to 90 days old. The climbing-swimming pattern was analyzed during the adaptation period for SubAnT and SupraAnT groups. Animals from the Co, SubAnT and SupraAnT groups were euthanized immediately after the latter LMT, and gluteus maximus, gastrocnemius (white and red portion), soleus and liver glycogen content in addition to blood creatine kinase concentration were analyzed immediately and 24 h after euthanasia.
Water environment adaptation protocols
Animals from the SubAnT and SupraAnT groups were adapted to water swimming for 14 days at the same time (from 6:00 to 8:00 a.m.). Water temperature was kept at 31±1 °C according to previous recommendations22. The irst nine water environment
adaptation days were similar for both groups. During these days animals progressively adapted to water swimming. From the tenth day, animals were adapted with loads below (SubAnT) and above (SupraAnT) the anaerobic threshold (Table 1). The intensity was based on the animal’s body mass and weights were attached by elastics on the animals’ thorax. For deep water environment adaptation sessions, a cylindrical tank was used (30 cm diameter x 120 cm depth).
Table 1. Water environment adaptation protocols applied throughout the extent of the experiment.
Session SubAnT group SupraAnT group
1° Shallow water (3cm), 15 min without load
2° Shallow water (3cm), 15 min without load
3° Shallow water (3cm), 15 min without load
4° Deep water (80cm), 2 min without load
5° Deep water (80cm), 4 min without load
6° Deep water (80cm), 6 min without load
7° Deep water (80cm), 8 min without load
8° Deep water (80cm), 10 min without load
9° Deep water (80cm), 5 min with 3 % of BM
10 Deep water (80cm), 7 min with 3 % of BM Deep water (80cm), 3 min with 5% of BM + 5 min without load
11° Deep water (80cm), 9 min with 3 % of BM Deep water (80cm), 1 min with 9% of BM + 5 min without load 12° Deep water (80cm), 11 min with 3 % of BM Deep water (80cm), 1 min with 11% of BM + 5 min without load 13° Deep water (80cm), 13 min with 3 % of BM Deep water (80cm), 30 s with 13% of BM + 5 min without load 14° Deep water (80cm), 15 min with 3 % of BM Deep water (80cm), 30 s with 15% of BM + 5 min without load
Swimming pattern analysis
The climbing-swimming pattern was analyzed throughout the water environment adaptation period. Footage was made by a Full HD camera (Sony HDR-P J200 30x Optic Zoom) positioned at 80° on the cylindrical tank surface. The climbing pattern is a known swim-ming pattern of rodents23 that occurs mainly in the irst minutes of
the swimming exercise24; therefore, it was considered during the irst three minutes of each adaptation day. The videos were individu -ally analyzed by the researchers, and the time (seconds) in which rats performed the climbing-swimming pattern was recorded. This analysis was performed from the 4th adaptation session, in which animals were submitted to the irst deep water (80 cm) contact.
Considered as an escape behavior of naive animals23, this pattern
is similar to continuous swimming, except that the rat’s forepaws and forelimbs break the water’s surface rhythmically25.
Lactate minimum test (LMT)
The lactate minimum test suggested for humans26 and later reined
for swimming rats17 was applied. This test consists of three phases: i)
hyperlactatemia induction; ii) passive recovery; and iii) incremental exercise test. Two brief high-intensity bouts at 13% of the body mass
were conducted for hyperlactatemia induction. The irst bout lasted
30 s, and after 30 s of passive recovery, animals were submitted to the second bout, in which they swam until exhaustion. The time to exhaustion (Te) from the latter bout was considered as an anaerobic parameter20. After the hyperlactatemia induction, animals stayed in
9 min of passive recovery to allow lactate extrusion from myocytes
to the blood stream (phase 2). A blood sample (25 μl) was collected
from the tail at the ninth minute and placed in microtubes (1.5 ml)
with 400 μl of trichloroacetic acid. Right after the passive recovery,
rats began the incremental test of 5-min stages (4, 4.5, 5, 5.5 and 6%
of body mass) with 0.5% workload increment during the irst ive
stages (i.e. 6%); from the sixth stage and beyond, a 1% increment
was imposed until the animal’s exhaustion. Blood samples (25 μl)
were collected at the end of the stages. Considering that animals initiated the incremental test with high blood lactate concentrations,
a blood lactate clearance is expected during the irst incremental
stages, and further a blood lactate increase in the latter stages. The “U” shaped curve between blood lactate concentration (y-axis) and intensities (x-axis) allows the zero gradient determination from a 2th order polynomial it17. This parameter is coined as the lactate
minimum intensity (LMTint), and considered as an aerobic parameter. The LMTint relects the intensity in which the rate between blood lactate appearance and disappearance in the bloodstream are bal-anced (i.e. anaerobic threshold)26. The total time (TT) performed
during the incremental test was also analyzed. Successful test rate (SR) criteria were considered as the “U” shape form presence and
the polynomial it R² ≥0.80.
Euthanasia
Animals were anesthetized (intraperitoneal injection) with 40 mg/kg sodium thiopental, and after the loss of foot and cornea
relexes, muscles (gluteus maximus, gastrocnemius and soleus) were surgically collected in vivo and immediately frozen at -20 °C. Subsequently, upper lobe liver samples were collected from the abdominal cavity and also frozen at -20 °C.
Glycogen content and blood creatine kinase/lactate analysis
Gluteus maximus, gastrocnemius (red and white portion) and soleus fractions of 200–250 mg and 100 mg of liver tissue were weighed right after euthanasia. Samples were digested in 30% potas-sium hydroxide (KOH). Sodium sulfate (Na2SO4) was added, and
the glycogen precipitate was puriied using 70% ethanol. Phenol
(C6H5OH, 10 μl) and sulfuric acid (H2SO4, 2 ml) were used with the colorimetric method, and glycogen content of the tissues was analyzed by the absorbance at a 490 nm wavelength27.
To determine the creatine kinase (CK-NAC) concentration in
blood, 5 μl of serum was mixed with a reagent kit: imidazole (100
mmol/L), creatine kinase (30 mmol/L), ADP (2 mmol/L), glucose (20 mmol/L), NADP (2 mmol/L), hexokinase (2.500 U/L), glucose 6P (2.000 U/L), Mg (10 mmol/L) and AMP (5 mmol/L). The
CK-NAC absorbance (U/L=∆ absorbance/min x 3.333) was read at a 340 nm wavelength in the irst, second, and third minutes after the
reagent inclusion and sample were mixed.
The blood lactate concentration was analysed enzymatically28.
Samples were shaken in a magnetic stirrer and centrifuged (3000
rpm), and 50 μl of supernatant was mixed with 250 μl of reagent for
1 h. Samples were read at 340 nm wavelength and expressed in mM.
Statistical analysis
Statistical analyses were conducted using a statistical software package (Statistic 7.0, Statsoft, Tulsa, USA). Data are presented as mean ± standard deviation (SD). Data normality and
homoge-neity were conirmed by Shapiro-Wilk’s test and Levene’s test,
respectively. A comparison of LMT parameters and glycogen/ CK content and the climbing-swimming pattern throughout the extent of the experiment was proceeded by two-way ANOVA (Te, LMTint, [Lac] at LMTint, R², TT, glycogen content or serum CK – dependent; moment and group – factorials). The two-way ANOVA for repeated measures was used for a comparison of the climbing-swimming pattern prevalence during the extent of the experiment (climbing-swimming pattern prevalence – dependent; water adaptation sessions and group – factorials). A Scheffé post-hoc test was used in every analysis. The factorial parameters in
both analyses were considered as effect interaction. Conidence
intervals (CI–95%)29 were calculated for SD with α=0.05 (σ/√n). Statistical signiicance was set at P<0.05.
Results
5th session. Our results indicate that the lowering of the
climbing-swimming pattern occurred regardless of the water environment adaptation protocol, since differences were only found for the session effect (p=0.000) (group – p=0.542; interaction – p=0.976).
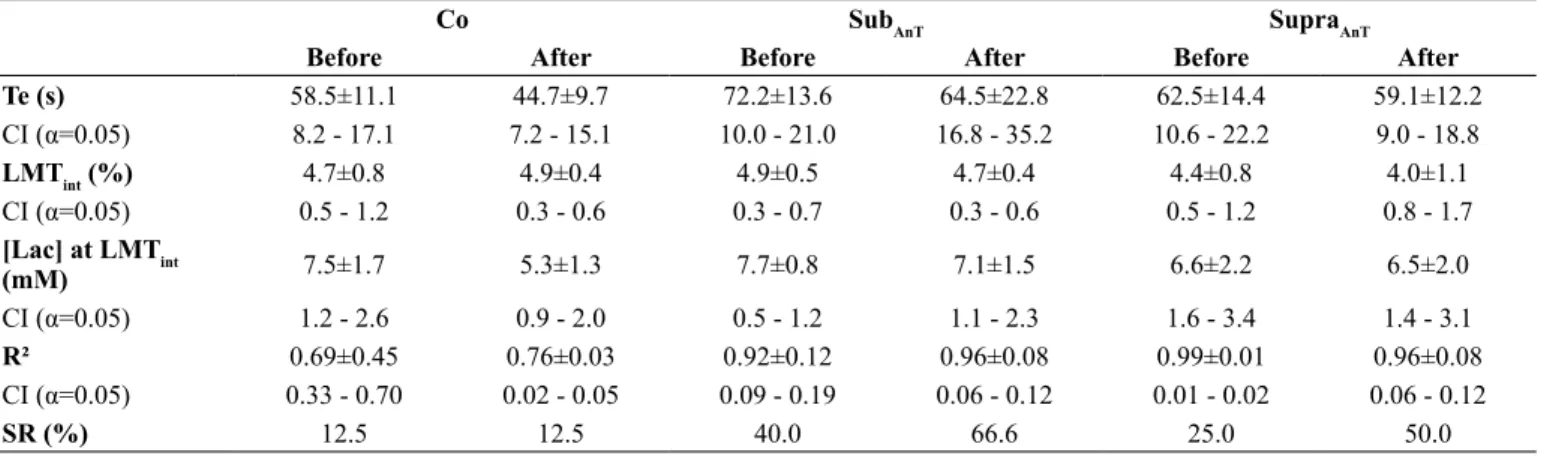
Table 2. Time to exhaustion (Te), lactate minimum intensity (LMTint), blood lactate concentration at lactate minimum intensity ([Lac] at LMIint), R² from the 2nd order polynomial it and success rate (SR) before and after the extent of the experiment for control (Co), sub anaerobic threshold
(SubAnT) and supra anaerobic threshold (SupraAnT) groups.
Co SubAnT SupraAnT
Before After Before After Before After
Te (s) 58.5±11.1 44.7±9.7 72.2±13.6 64.5±22.8 62.5±14.4 59.1±12.2
CI (α=0.05) 8.2 - 17.1 7.2 - 15.1 10.0 - 21.0 16.8 - 35.2 10.6 - 22.2 9.0 - 18.8
LMTint (%) 4.7±0.8 4.9±0.4 4.9±0.5 4.7±0.4 4.4±0.8 4.0±1.1
CI (α=0.05) 0.5 - 1.2 0.3 - 0.6 0.3 - 0.7 0.3 - 0.6 0.5 - 1.2 0.8 - 1.7
[Lac] at LMTint
(mM) 7.5±1.7 5.3±1.3 7.7±0.8 7.1±1.5 6.6±2.2 6.5±2.0
CI (α=0.05) 1.2 - 2.6 0.9 - 2.0 0.5 - 1.2 1.1 - 2.3 1.6 - 3.4 1.4 - 3.1
R² 0.69±0.45 0.76±0.03 0.92±0.12 0.96±0.08 0.99±0.01 0.96±0.08
CI (α=0.05) 0.33 - 0.70 0.02 - 0.05 0.09 - 0.19 0.06 - 0.12 0.01 - 0.02 0.06 - 0.12
SR (%) 12.5 12.5 40.0 66.6 25.0 50.0
CI – Upper and lower conidence limits for SD.
The LMT results are shown in Table 2. No interactions were found considering the Te (p= 0.361), LMTint (p=0.847), [Lac] at LMTint (p=0.560) and R² (p=0.665). While the SR was unaltered for the Co group after the experiment, improvements of 26.6% and 25% were obtained after the adaptation period for the SubAnT and SupraAnT groups, respectively. Animals submitted to the swimming adaption protocols also presented higher TT when compared to the Co group (interaction – p=0.013; Co after x SubAnT after – p=0.000; Co after x SupraAnT after – p=0.014) (Figure 2).
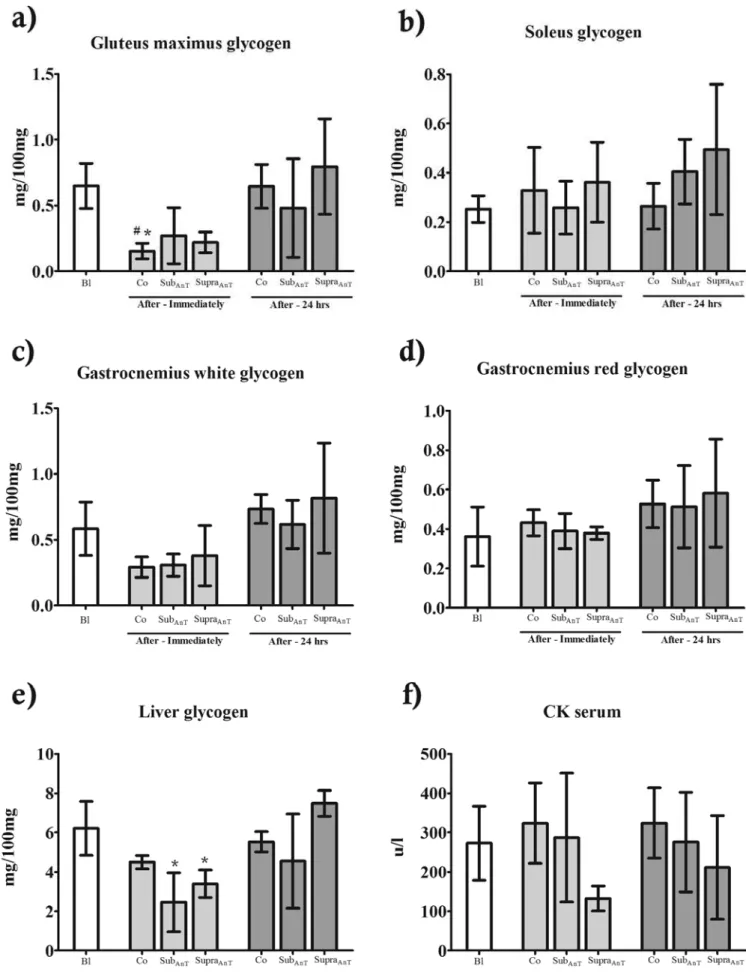
Regarding the glycogen content, signiicant differences were
only found in gluteus maximus (Figure 3a) (Co immediately x Bl – p=0.026; Co immediately x SupraAnT 24 h) and liver (Figure 3e) (SubAnT immediately x SupraAnT 24 h – p=0.028; SupraAnT
immediately x SupraAnT 24 h – p=0.034). No differences were obtained for the serum CK(Figure 3f).
Discussion
Accepting our main hypothesis, rats submitted to 14 days of water environment adaptation with sub and supra threshold intensities presented a lowering climbing-swimming prevalence without physiological adaptations. Secondarily, animals from both groups (i.e. SubAnT and SupraAnT) performed more incremental stages in the lactate minimum test, resulting in an increased lactate minimum success rate after the water environment adaptation period.
Figure 1. Climbing swimming pattern prevalence throughout the fourteen water environment adaptation sessions for sub anaerobic threshold (SubAnT)
and supra anaerobic threshold (SupraAnT) groups. *Indicate signiicant
difference from the 4th and 5th water environment adaptation sessions.
Figure 2. Total time (TT) performed during the incremental test before and after the extent of the experiment for control (Co), sub anaerobic threshold (SubAnT) and supra anaerobic threshold (SupraAnT) groups. *
Indicate signiicant difference from SubAnT and SupraAnT after the water
Figure 3. Muscle/hepatic glycogen content and serum creatine kinase (CK) comparison between baseline (Bl), control (Co), sub anaerobic threshold (SubAnT) and supra anaerobic threshold (SupraAnT) groups.
Although reports have shown that luminosity, time of day and water temperature have an effect on swimming rats2,3,4,5, we
presented novel data regarding the water environment adaptation
period inluencing the climbing-swimming pattern prevalence. The
fact that studies have not been concerned with the proper water environment adaptation raises questions about its importance on experimental procedures involving swimming rats. Why do rodents that are not adapted to the swimming exercise present a high prevalence of a climbing pattern? Is this swimming pattern related to the learning process and stressful factors? Dawson and Horvath1 suggest that the climbing-swimming pattern is a relec
-tion of a stress condi-tion resulting from swimming inexperience of rodents. Furthermore, literature has demonstrated that stress modulates brain and cognitive functions30, as well as a decline in
the learning process via corticosteroid effects on the hippocampus31.
Therefore, since the stress condition of inexperienced swimming rats is evidenced by the prevalence of the climbing-swimming pattern, our suggestion is that water environment adaptation pe-riod is relevant for decreasing stress, improving the swimming learning process, and therefore, reducing the climbing pattern.
Despite the lowering climbing-swimming pattern relevance’s,
how does the decreased prevalence inluence the LMT success
rate? This relationship can be attributed to some factors. The lower stressful responses presented during the swimming exercise (i.e. lower climbing-swimming prevalence) was important for a rodent not to spend unnecessary energy13,14. As a consequence, more
incre-mental stages could be performed, which are directly related with the LMT success rate. Studies showed the zero gradient from the 2nd polynomial it is more reliable when more incremental stages
are performed32,33. Our evidence strengthens these statements, since
low TT (Figure 2) along with the unaltered success rate (12.5 %) (Table 2) were present in the Co group after the adaptation period. Once the success rate is important in terms of the LMT parameters’ estimation reliability (e.g. LMTint and Te), the lower climbing-swimming prevalence directly impacts the LMT. This is supported by improvements of 26.6% and 25% in the LMT success rate presented by animals from the SubAnT and SupraAnT along with the decreased climbing-swimming prevalence (Figure 1).
One important and undesired factor throughout the water environment adaptation period is physiological condition im-provements. As previously mentioned, whether these improve-ments were achieved, then training effects (for instance) can be confounded by the stimuli to which animals were already exposed. It is a fact that the swimming rats could be altered the
physi-ological parameters according to the speciic stimuli imposed.
Conversely, our evidence demonstrated that the different aerobic (SubAnT) and anaerobic (SupraAnT) stimuli did not improve the rat’s
physiological condition in a speciic manner. This statement is
supported by the unaltered aerobic (LMTint and [Lac] at LMTint) and anaerobic (Te) parameters in both groups after the water environment adaptation period.
Along with the unaltered aerobic and anaerobic parameters, no improvements were achieved regarding the muscular/hepatic glycogen content and serum CK. The lower glycogen content in gluteus maximus and liver immediately after the LMT (Figure 3a and 3e) can be attributed to the signiicant participation of
these muscles during the test. The gluteus maximus is excessively
required for swimming rats34, and its necessity for providing
energy without oxygen may result in lower content immediately after the LMT. As the liver regulates the serum glucose levels, it is possible to suggest that the LMT required glucose from this organ to supply muscles involved in the swimming exercise, especially during the hyperlactatemia induction and the latter incremental stages. On the other hand, these differences were only found in acute manner. No chronic super-compensation of glycogen content resulted from the water environment adaptation period, since baseline results were not different from glycogen content after 24 h of the LMT.
All of these results lead us to ask our main question again. Is the water environment adaptation period really necessary? Our results demonstrated that along with the decreased prevalence of the climbing pattern, rodents submitted to the swimming adaption also performed more stages in the lactate minimum test, resulting in a high success rate; furthermore, all of these improvements took place without physiological adaptations. Our data contribute to the knowledge regarding what must be considered to avoid dubious results from experiments involving swimming rats. Subsequent studies are encouraged to use the water environment adaptation protocols proposed in this paper, since demonstrated its importance. In addition, we suggest that future studies may chose the water environment adaptation protocol based on the characteristics of the main experiment. For instance, training interventions composed of low intensity and volume can use the SubAnT protocol from the main experiment, since rats will be already exposed to similar stimuli.
The improvements that were similar in both groups rein-force the application of individualized intensities based on the anaerobic threshold during the water environment adaptation period. Future investigations can compare the motor behavior and physiological condition of rodents submitted to individualized and non-individualized intensities during the water environment adaptation period. Lastly, since the Figure 1 demonstrated that the prevalence of the climbing-swimming pattern decreased mainly
over the irst ive days, subsequent studies can investigate whether
fewer water environment adaptation days provide the same results as the period analyzed in the present study. This perspective may save time for studies that will use or evaluate swimming rats.
Conclusion
We provided novel data regarding the effects of 14 water environ-ment adaptation days on motor behavior and the physiological condition of swimming rats. Our results demonstrated that the application of individualized intensities during the adaptation period were effective in decreasing the prevalence of climbing-swimming without physiological improvements.
References
2. Beck W, Gobatto C. Effect of high wavelengths low intensity light during dark period on physical exercise performance, biochemical and haematological parameters of swimming rats. Acta Physiol Hung. 2016; 103(1):112-9.
3. Foss CR, Horvath SM. Reactions of wild and albino mice in response to forced swimming. Proc Soc Exp Biol Med. 1965; 120(3):588-92.
4. Sandi C, Loscertales M, Guaza C. Experience-dependent facilitat-ing effect of corticosterone on spatial memory formation in the water maze. Eur. J. Neurosci. 1997; 9(4):637-42.
5. Beck WR, Ribeiro LFP, Scariot PPM, Reis IGM, Gobatto CA. Time of day effects on aerobic capacity, muscle glycogen content and performance assessment in swimming rats. Sci Sports. 2014; 29:319-23.
6. Metzger MM, Riccio DC. Adaptation to exercise in the rat: lack of associative control. Psychobiology. 1996; 24:85-90.
7. Higashida K, Kim SH, Higuchi M, Holloszy JO, Han DH. Normal adaptations to exercise despite protection against oxidative stress. Am J Physiol Endocrinol Metab . 2011; 301(5):E779-84. 8. Gobatto CA, de Mello MA, Sibuya CY, de Azevedo JR, dos Santos
LA, Kokubun E. Maximal lactate steady state in rats submitted to swimming exercise. Comparative biochemistry and physiology Part A. Molecular & integrative physiology. 2001; 130(1):21-7. 9. Fujimoto E, Yamaguchi W, Terada S, Higuchi M, Tabata I.
Change in PGC-1alpha expression in rat skeletal muscle after low-intensity prolonged swimming exercise. J Physiol Anthropol. 2011; 30(1):23-7.
10. Chien KY, Huang CC, Hsu KF, Kuo CH, Hsu MC. Swim training reduces metformin levels in fructose-induced insulin resistant rats. Journal of pharmacy & pharmaceutical sciences : a publication of the Canadian Society for Pharmaceutical Sciences, Societe canadienne des sciences pharmaceutiques. 2012; 15(1):85-93. 11. Chen YC, Lee SD, Kuo CH, Ho LT. The effects of altitude
train-ing on the AMPK-related glucose transport pathway in the red skeletal muscle of both lean and obese Zucker rats. High Alt Med Biol. 2011; 12(4):371-8.
12. Manchado-Gobatto FB, Gobatto CA, Contarteze RVL, Papoti M, Mello MAR. Máxima fase estável de lactato é ergômetro-dependente em modelo experimental utilizando ratos. Rev Bras Med Esporte. 2006; 12:259-62.
13. Hoyer S, Lannert H. Long-term effects of corticosterone on behavior, oxidative and energy metabolism of parietotemporal cerebral cortex and hippocampus of rats: comparison to intra-cerebroventricular streptozotocin. J Neural Transm (Vienna). 2008; 115(9):1241-9.
14. Laugero KD, Gomez F, Manalo S, Dallman MF. Corticosterone infused intracerebroventricularly inhibits energy storage and stimulates the hypothalamo-pituitary axis in adrenalectomized rats drinking sucrose. Endocrinology. 2002; 143(12):4552-62. 15. Richter CP. On the phenomenon of sudden death in animals and
man. Psychosom Med. 1957; 19:191-8.
16. Contarteze RV, Manchado Fde B, Gobatto CA, De Mello MA. Stress biomarkers in rats submitted to swimming and treadmill running exercises. Comparative biochemistry and physiology Part A, Molecular & integrative physiology. 2008; 151(3):415-22. 17. McEwen BS, Sapolsky RM. Stress and cognitive function. Curr.
Opin. Neurol. 1995; 5(2):205-16.
18. Morris R. Developments of a water-maze procedure for study-ing spatial learnstudy-ing in the rat. J. Neurosci. Methods. 1984; 11(1):47-60.
19. de Araujo GG, Papoti M, Manchado Fde B, de Mello MA, Gobatto CA. Protocols for hyperlactatemia induction in the lactate mini-mum test adapted to swimming rats. Comparative biochemistry and physiology Part A, Molecular & integrative physiology. 2007; 148(4):888-92.
20. de Araujo GG, Papoti M, Delbin MA, Zanesco A, Gobatto CA. Physiological adaptations during endurance training below anaer-obic threshold in rats. Eur J Appl Physiol. 2013; 113(7):1859-70. 21. de Araujo GG, Papoti M, Dos Reis IG, de Mello MA, Gobatto
CA. Physiological responses during linear periodized training in rats. Eur J Appl Physiol. 2012; 112(3):839-52.
22. Scariot PP, Manchado-Gobatto Fde B, Torsoni AS, Dos Reis IG, Beck WR, Gobatto CA. Continuous Aerobic Training in Individualized Intensity Avoids Spontaneous Physical Activity Decline and Improves MCT1 Expression in Oxidative Muscle of Swimming Rats. Front Physiol. 2016; 7:132.
23. de Araujo GG, Papoti M, Manchado-Gobatto Fde B, de Mello MA, Gobatto CA. Monitoring chronic physical stress using biomarkers, performance protocols and mathematical functions to identify physiological adaptations in rats. Laboratory animals. 2013; 47(1):36-42.
24. Harri M, Kuusela P. Is swimming exercise or cold exposure for rats? Acta Physiol Scand. 1986; 126(2):189-97.
25. Kregel KC, Allen DL, Bootth FW, Fleshner MR, Henriksen EJ, Musch TI, et al. Resource book for the design on animals exercise protocols Bethesda, MD; 2006.
26. Reis IGM. Análise de parâmetros de força e padrão de nado de ratos controle e obesos, a partir de um sistema de aquisição de sinais em natação atada. Inluência da intensidade do exercício da densidade corporal. Rio Claro, SP: State University of São Paulo; 2010.
27. Desai KH, Sato R, Schauble E, Barsh GS, Kobilka BK, Bernstein D. Cardiovascular indexes in the mouse at rest and with exercise: new tools to study models of cardiac disease. Am J Physiol. 1997; 272(2 Pt 2):H1053-61.
28. Tegtbur U, Busse MW, Braumann KM. Estimation of an individual equilibrium between lactate production and catabolism during exercise. Med Sci Sports Exerc. 1993; 25(5):620-7.
29. Dubois M, Gilles KA, Hamilton JK, Rebbers PA, Smith F. Colorimetric method for determination of sugars and related substances. Anal. Chem. 1956; 28:350-6.
30. Engel PC, Jones JB. Causes and elimination of erratic blanks in enzymatic metabolite assays involving the use of NAD+ in alkaline hydrazine buffers: improved conditions for the assay of L-glutamate, L-lactate, and other metabolites. Anal Biochem. 1978; 88(2):475-84.
31. Hopkins W G. A spreadsheet for deriving a conidence interval, mechanistic inference and clinical inference from a p value. Sports science. 2007; 11:16-20.
Corresponding author
Fúlvia de Barros Manchado-Gobatto.
University of Campinas, Department of Sport Sciences, Laboratory of Applied Sport
Physiology. Pedro Zaccaria Street, 1.300, Jardim Santa Luíza, Limeira, São Paulo.
Email: [email protected]
Manuscript received on August 26, 2016 Manuscript accepted on October 11, 2016
Motriz. The Journal of Physical Education. UNESP. Rio Claro, SP, Brazil - eISSN: 1980-6574 – under a license Creative Commons - Version 3.0 33. Beck WR, Araújo GG, Gobatto CA. Methods of exercise
inten-sity and lactatemia determination of lactate minimum test in rats Comparative Exercise Physiology. 2012; 8:113-6.