Antonio Castro and Eugenio Oliveira
LIACC-NIAD&R, Faculty of Engineering, University of Porto, R. Dr. Roberto Frias, 4200-465 Porto, Portugal [email protected], [email protected]
Keywords: Distributed Multi-Agent Systems, Airline Operations Control, Operations Recovery, Disruption Management.
Abstract: An airline schedule very rarely operates as planned. Problems related with aircrafts, crew members and passengers are common and the actions towards the solution of these problems are usually known as operations recovery or disruption management. The Airline Operations Control Center (AOCC) tries to solve these problems with the minimum impact in the airline schedule, with the minimum cost and, at the same time, satisfying all the required safety rules. Usually, each problem is treated separately and some tools have been proposed to help in the decision making process of the airline coordinators. In this paper we present the implementation of a Distributed Multi-Agent System (MAS) that represents the several roles that exist in an AOCC. This MAS deals with several operational bases and for each type of operation problems it has several specialized software agents that implements heuristic solutions and other solutions based in operations research mathematic models and artificial intelligence algorithms. These specialized agents compete to find the best solution for each problem. We present a real case study taken from an AOCC where a crew recovery problem is solved using the MAS. Computational results using a real airline schedule are presented, including a comparison with a solution for the same problem found by the human operators in the Airline Operations Control Center. We show that, even in simple problems and when comparing with solutions found by human operators in the case of this airline company, it is possible to find valid solutions, in less time and with a smaller cost.
1 INTRODUCTION
One of the most important concerns in an airline company is the Operations Control. Through operations control mechanisms the airline company monitors all the flights checking if they follow the schedule that was previously defined by other areas of the company. Unfortunately, some problems arise during this phase (Kohl and Karish, 2004). Those problems are related with crew members (for example, a crew member that did not report for duty), aircrafts (for example, a malfunction or a delay due to bad weather) and passengers. When any of these problems appear it is necessary to find solutions for them. The Airline Operations Control Centre (AOCC) is composed by teams of people specialized in solving the above problems under the supervision of an operation control manager. Each team has a specific goal (for example, to guarantee that each flight has the necessary crew members) contributing to the common and general goal of having the airline operation running with few
problems as possible. The process of solving these problems is known as Disruption Management (Kohl et al., 2004) or Operations Recovery.
Based on the observations we have done on an AOCC of a real airline company we hypothesize that the objective of solving the operations recovery problems with the less cost as possible, will be much easier to achieve if we include information in the decision process related with various costs as well as if we take advantage of the fact that airlines usually have different operational bases with specific resources. Regarding crew recovery problems, we predict that if we take into account payroll information like hour salary and perdiem value of each crew rank, and costs related with hotels and
extra-crew travel between the different operational
bases, the solution will be less expensive. The same principle can be applied to aircraft recovery and passenger recovery if we use costs related with that domain. We also hypothesize that the use of different algorithms to solve the same problem (in crew and aircraft recovery) will contribute to the
robustness of the system. We predict that using different algorithms (genetic algorithms, heuristic, etc.) in comparison with using always the same algorithm, to solve the same problem, will permit to always find the best solution (according to the criteria defined by the company) and to always find a solution, especially taking into account the fact that we might benefit from solutions presented by other operational bases.
In this paper we approach this problem so that it can be solved by a Multi-agent System (MAS) that represents the Operational Control Center of the airline company. We use specialized agents, each one implementing Artificial Intelligence algorithms, simple heuristic algorithms and/or Operations Research mathematical models, to find the best solution to a specific problem related with crew, aircrafts or passengers. We expect to obtain a considerable decrease in the costs of the solutions for the problems found when compared with the costs of the solutions found by the current method used in the airline we have observed. We also expect that the heterogeneity of the algorithms, specialized in different types of problems, will allow to find solutions especially for the non-trivial problems, contributing, in this way, to the robustness of the system.
The rest of the paper is structure in the following way. Section 2 presents some work of other authors regarding operations recovery. Section 3 presents our proposal of a MAS for airline operations recover, including the architecture of the MAS, the algorithm used to choose the best solution and an example of the application of our MAS. Section 4 presents the scenario we setup to evaluate our system as well as the results of the evaluation. Section 5 presents the conclusion of our work.
2 STATE
OF
THE
ART
Traditionally, the Operations Recovery Problem has been solved through Operations Research (OR) techniques. The paper (Barnhart et al., 2003) gives on overview of OR applications in the air transport industry. The literature that exists related with this subject is usually divided according to the specific resource to be recovered. The most common division is by aircraft, crew and passengers. However, it is also possible to find papers related with more general approaches as well as related with integrated recovery approaches. We will present here the most recent published papers according to (Clausen et al., 2005). We divided the papers in four areas: general approaches, crew recovery, aircraft recovery and integrated recovery. For a more
detailed explanation of the papers as well as for older papers related with each of these subjects, please consult (Clausen et al., 2005).
General Approaches: In (Kohl et al., 2004) the author’s reports on the experiences obtained during the research and development of project DESCARTES (a large scale project supported by EU) on airline disruption management. The current (almost manual) mode of dealing with recovery is presented. They also present the results of the first prototype of a multiple resource decision support system.
Aircraft Recovery: The most recent paper considering the case of aircraft recovery is dated from 2002 (Rosenberger et al., 2001). The proposed model addresses each aircraft type as a single problem. They formulate the problem as a Set Partitioning master problem and a route generating procedure. The goal is to minimize the cost of cancellation and retiming, and it is the responsibility of the controllers to define the parameters accordingly. To solve the master problem in due time, a heuristic is used to select only a subset of aircraft to be involved in the Set Partitioning problem. This approach results in running times between 6 and 16 seconds for 3 real-size problem instances. It is included in the paper a testing using SimAir (Rosenberger et al., 2002) simulating 500 days of operations for three fleets ranging in size from 32 to 96 aircraft servicing 139-407 flights.
Crew Recovery: In (Abdelgahny et al., 2004) the flight crew recovery problem for an airline with a hub-and-spoke (a system of air transportation in which local airports offers air transportation to a central airport where long-distance flights are available) network structure is addressed. The paper details and sub-divides the recovery problem into four categories: misplacement problems, rest problems, duty problems, and unassigned problems. Based on detailed information regarding the current plan and pool of problems, the recovery problem is solved in steps. Several means are used for recovery, including delaying, swapping, deadheading (extra-crew) and the use of stand by crew. The proposed model is an assignment model with side constraints. Due to the stepwise approach, the proposed solution is sub-optimal. Results are presented for a situation from a US airline with 18 problems.
Integrated Recovery: It is uncommon to find literature dedicated specifically to the passenger recovery problem. We believe the main reason for this is the fact that the passenger problems can be minimized if we solve the aircraft and crew problems. However, we would like to point out a recent paper (Bratu and Barnhart, 2006) that, although presenting an integrated recovery approach, has a strong emphasis on reducing
passenger arrival delays. This paper presents two models that considers aircraft and crew recovery and through the objective function focuses on passenger recovery. These are based on the flight schedule network. Although crew is incorporated into the models they do not consider how to recover from disrupted crews. To test the models an AOCC simulator was developed, simulating domestic operations of a major US airline. It involves 302 aircrafts divided into 4 fleets, 74 airports and 3 hubs. Furthermore, 83869 passengers on 9925 different passengers’ itineraries per day are used. Three different scenarios with different levels of disruption are presented. Execution times ranges from 201 to 5042 seconds. For all scenarios are generated solutions with reductions in passenger delays and disruptions.
Lettovsky’s Ph.D. thesis (Lettovsky, 1997) is the first presentation of a truly integrated approach in the literature, although only parts of it are implemented. The thesis presents a linear mixed-integer mathematical problem that maximizes total profit to the airline while capturing availability of the three most important resources: aircraft, crew and passengers. The formulation has three parts corresponding to each of the resources, that is, crew assignment, aircraft routing and passenger flow. In a decomposition scheme these three parts are controlled by a master problem denominated the Schedule Recovery Model.
Finally, we would like to point out a tool called DART (Decision-Aided Rescheduling Tool) (Martins and Morgado, 1996) that was developed to control the flight operations of IBERIA (the Spanish airline company). DART controls airline operations by gathering real time world-wide information about fleet and crew situation and providing decision support for handling incidents. It covers the daily execution of the ideal flight plan and is responsible for tracking and solving any irregularities that might arise during its execution. The authors claim that DART has been able to solve some difficult problems, proposing, in some cases, better solutions than those proposed by the re-scheduling experts. The paper does not present any comparative results.
3 A MAS FOR OPERATIONS
RECOVERY
3.1 General
Description
As stated before we approached this problem by developing a distributed multi-agent system (MAS) that represents the Airline Operations Control Center (AOCC). Some of the Agent/MAS characteristics
that make us adopt this paradigm are the following (Wooldridge, 2002):
Autonomy: MAS models problems in terms of autonomous interacting component-agents, which are a more natural way of representing task allocation, team planning, and user preferences, among others.
Distribution of resources: With a MAS we can distribute the computational resources and capabilities across a network of interconnected agents avoiding problems associated with centralized systems.
Scalability: A MAS is extensible, scalable, robust, maintainable, flexible and promotes reuse. These characteristics are very important in systems of this dimension and complexity.
A high-level graphical representation of the MAS architecture is presented in Figure 1.
Figure 1: MAS Architecture.
The square labeled BASE A shows the part of the MAS that is installed in each operational base of the airline company (e.g., NYC, LHR and LAX). Each operational base has its own resources that are represented in the environment, for example, Crew
Roster and Aircraft Roster are databases of
schedules for the crew members and aircrafts, respectively. Other resources represented are the
airport information system (to be able to get
information regarding boarding gates and delays),
legacy systems (to access information regarding
costs, among others) and a knowledge database for the learning capabilities of the MAS (this characteristic of the MAS will not be explained in
this paper). Each operational base has also software agents that represent roles in the AOCC. The Crew
Recovery Agent, Aircraft Recovery Agent and Pax Recovery Agent are dedicated to solve crew, aircraft
and passengers problems, respectively, and should be seen as sub-organizations inside the MAS. The
Apply Solution Agent applies the solution found and
authorized in the resources of the operational base. Finally, each operational base has a Broker Agent that is responsible for all the interactions between other operational bases and the Electronic Market. The MAS also has the possibility to interact with an electronic market of airline resources such as aircrafts and crew members, through the Company
Broker. According to (Kohl et al., 2004) “research
on recovery operation to this date only deals with a single airline. Cooperation between airlines is not supported”. With this approach we try to foster the cooperation between airlines. More information about this electronic market can be found in (Malucelli et al., 2006). The MAS was developed using JADE (Bellifemine et al., 2004) as development platform and as the run-time environment that provides the basic services for agents to execute. The MAS was developed based on a previous analysis and design by Castro and Oliveira (Castro and Oliveira, 2005).
3.2 Sub-organization
Architecture
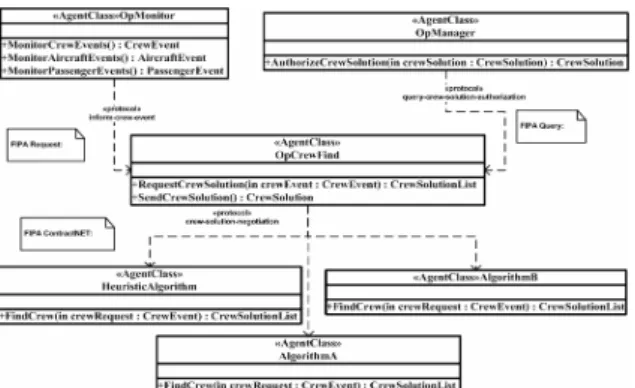
As stated before, the Crew, Aircraft and Pax Recovery agents as presented in Figure 1 should be seen as sub-organizations. These sub-organizations have their own architecture with their specialized agents. Figure 2 shows the architecture for Crew
Recovery (corresponding to the Crew Recovery Agent in figure 1) in a UML diagram. The
architecture for Aircraft Recovery and Pax Recovery are very similar.
Figure 2: Crew Recovery sub-organization architecture. The agent class OpMonitor is responsible for monitoring any crew events, for example, crew
members that did not report for duty or duties with open positions, that is, without any crew member assigned to a specific role on board (e.g., captain or flight attendant). When an event is detected, the service MonitorCrewEvents will initiate the protocol
inform-crew-event (FIPA Request) informing the OpCrewFind agent. The message will include the
information necessary to characterize the event. This information is passed as a serializable object of the type CrewEvent. Figure 3 shows the attributes of the
CrewEvent class.
Figure 3: Crew Events.
The OpCrewFind agent detects the message and will start a CFP (call for proposal) through the
crew-solution-negotiation protocol (FIPA contractNET)
requesting to the specialized agents
HeuristicAlgorithm, AlgorithmA and AlgorithmB of
any operational base of the airline company, a list of solutions for the problem. Each agent implements a different algorithm specific for this type of problem. When a solution is found a serializable object of the type CrewSolutionList is returned in the message as an answer to the CFP. Figure 3 shows the attributes of the CrewSolutionList class. The OpCrewFind agent collects all the proposals received and chooses the best one according to the algorithm in Table 1:
Table 1: Multi-criteria algorithm.
foreach item in CrewSolution list
totalDuty = monthDuty+credMins if (totalDuty-dutyLimit) > 0 credDuty = totalDuty-dutyLimit else credDuty = 0 end if perdiemDays = (endDateTime-dutyDateTime perdiemPay = perdiemDays*perdiemValue dutyPay = credDuty*(hourSalaryValue/60) cost = (dutyPay+perdiemPay)*baseFactor end foreach
order all items by cost desc select first item on the list
The algorithm in Table 1 is implemented in the service SendCrewSolution and produces a list ordered by the cost (a multi-criteria cost) that each solution represents. Table 2 explains each of the computed values in the algorithm in Table 1.
Table 2: Computed values. totalDut
y
Monthly duty minutes of the proposed crew member after assigning the new duty credDut
y
Number of minutes to be paid case the crew member exceeds the monthly duty limit
dutyPay Cost of duty computed according to the hour salary of the crew member perdiem
Days
Number of days of work for the specific duty
perdiem Pay
Cost of duty computed according to the perdiem value of the crew member base
Factor
If the crew member belongs to the same operational base where the problem happened, the value is equal to one. Otherwise, it will have a value greater than one.
Cost The sum of the cost of the perdiem plus duty multiplied by the base factor.
The first solution of the list in descendant order by cost corresponds to the less expensive one. The
SendCrewSolution service initiates the protocol query-crew-solution-authorization (FIPA Query)
querying the OpManager agent for authorization. The message includes the serializable object of the type CrewSolution as shown in Figure 3.
3.3 Example
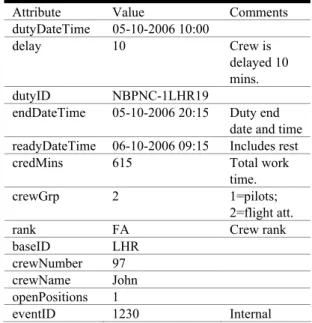
As a simple example, consider the following situation: Airline Company A has two operational bases, one in London (LHR) and another in Paris (ORY), each with 150 crew members. On a specific day a crew member of the London base did not report for duty and it was necessary to find another crew member to replace him. In our MAS the
OpMonitor agent of LHR base, would detect and
characterize the event according to Table 3.
The agent starts the inform-crew-event protocol that includes the information from the CrewEvent, informing the OpCrewFind agent. This agent starts a CFP through the crew-solution-negotiation protocol requesting all the solutions from the specialized agents in both operational bases.
Table 3: Event characterization.
Attribute Value Comments
dutyDateTime 05-10-2006 10:00
delay 10 Crew is
delayed 10 mins. dutyID NBPNC-1LHR19 endDateTime 05-10-2006 20:15 Duty end
date and time readyDateTime 06-10-2006 09:15 Includes rest
credMins 615 Total work
time.
crewGrp 2 1=pilots;
2=flight att.
rank FA Crew rank
baseID LHR crewNumber 97 crewName John openPositions 1
eventID 1230 Internal
The OpCrewFind agent receives the solutions as a CrewSolutionList from each agent according to Table 4 (this table does not show all the information that is included in the CrewSolutionList returned by the agents, like for example, the crew number and name).
Table 4: CrewSolutionList data.
base ID rank hour Salary Value per diem Value duty Limit month Duty base Factor LHR FA 43 71 7800 7600 1 ORY FA 30 71 7800 8120 1,3 LHR FA 17 31 7800 8500 1 LHR FA 14 31 7800 7950 1 ORY FA 14 31 7800 5000 1,3
The service SendCrewSolution of agent
OpCrewFind computes the values indicated in Table
2 for each item of the CrewSolutionList and orders them, according to the algorithm indicated in Table 1. The result of this operation is indicated in Table 5.
Table 5: Ordered CrewSolutionList data. Base ID total Duty cred Duty duty Pay per diem Days per diem Pay cost ORY 5615 0 0 1 31 40 LHR 8565 765 178 1 31 209 LHR 8215 415 297 1 71 368 LHR 9115 1315 372 1 31 403 ORY 8735 935 467 1 71 699
As it is possible to see, the solution with less cost is solution number 5 (table 4) listed in first place in table 5. In this particular example, it is a crew member from a different operational base that is considered the best solution to substitute the one that did not report for duty. The SendCrewSolution service initiates the protocol
query-crew-solution-authorization querying the OpManager for
authorization. The message includes the serializable object CrewSolution with the complete information, as presented in Table 6.
Table 6: CrewSolution serializable object. Attribute Value dutyID NBPNC-1LHR19 dutyDateTime 05-10-2006 10:00 endDateTime 05-10-2006 20:15 readyDateTime 06-10-2006 09:15 baseID ORY crewGrp 2 rank FA crewNumber 147 crewName Marie seniority 15 dutyPay 0 perdiemPay 31 cost 40
4 SCENARIO
AND
EXPERIMENTS
4.1 Scenario
To evaluate our MAS we have setup a scenario that includes 3 operational bases (A, B and C). Each base includes their crew members each one with a specific roster. The data used corresponded to the real operation of June 2006 of base A. We have simulated a situation where 15 crew members, with different ranks, did not report for duty in base A. The events did not happen at the same day and each
one corresponds to a crew member that did not report for a specific duty in a specific day.
After setting-up the scenario we found the solutions for each crew event using two methods. In the first method we used a real user from the AOCC, with the current tools available, to find the solutions. The user uses software that shows the roster of each crew member in a Gantt chart for a specific period. The user can scroll down the information, filter according to the crew rank and base, and sort the information by name, month duty, etc. Each user has a specific way of trying to find the solutions. However, we have observed that, in general, they follow these steps:
First: Open the roster for a one month period, starting two days before the current day.
Second: Filter the roster by crew rank and base, where the base is equal to the base where the crew event happened and crew rank is equal to the crew member that did not report for duty.
Third: Order the information by month duty, in an ascendant order and by seniority in a descendent order.
Fourth: Visually, they scroll down the information until they found a crew member with an open space for the period of time that corresponds to the duty to be assigned. This period of time takes into consideration the start and end time of the duty and also the time required for resting (ready date time). Fifth: If they do not found a crew member in the base specified, they try to find it in another base, filtering the information accordingly.
Sixth: They assign the duty to the first crew member they found.
In the second method we have used the sub-organization Crew recovery of our MAS as indicated in Section 3.2.
4.2 Results
The data (partial) obtained using method 1 is presented in Table 7 and the data obtained using method 2 in Table 8. We point out that the data in columns marked with an asterisk were calculated manually, according to the formulas in the algorithm presented in Table 1. The reason for this is that the information system that is available for the users does not include information related with any kind of payroll.
Table 7: Solutions obtained through method 1. Base ID time (sec) rank duty Pay (*) perdiem Pay (*) cost (*) A 90 FA 0 72 72 B 115 FA 0 72 86,4 A 75 CPT 942,9 106 1048,9 A 100 FA 939 144 1083 B 120 FA 0 72 86,4 B 100 CPT 777 212 1186,8 B 105 FO 0 148 177,6 A 80 SFA 687,65 72 759,65 B 110 SFA 0 144 172,80 C 110 CPT 0 212 296,8 A 110 FA 0 72 72 C 120 FA 0 72 100,8 B 115 FA 0 72 86,4
Table 8: Solutions obtained through method 2. Base
ID
time(sec) rank duty Pay perdiem Pay cost A 20 FA 0 72 72 B 31 FA 0 72 86,4 B 18 CPT 0 106 127,2 C 27 FA 563,4 62 875,6 B 32 FA 0 72 86,4 C 26 CPT 0 212 296,8 A 25 FO 0 144 144 B 15 SFA 229,17 72 361,4 B 29 SFA 0 144 172,8 C 23 CPT 0 212 296,8 A 27 FA 0 72 72 C 31 FA 0 72 100,8 B 32 FA 0 72 86,4
The Solution part of table 9 shows the number of solutions found in each operational base. The Time part of the table shows how long it took to find the solutions in each base. The Total Costs shows the cost of the solutions by each of the crew ranks involved: CPT (Captains), FO (First Officers), SFA (Senior Flight Attendants) and FA (Flight Attendants). It also shows the costs by each of the operational bases.
Table 9 presents the results that compare the two methods.
5 CONCLUSIONS
From the results we can see that our MAS obtains valid solutions faster and with less costs when compared with the current method used in a real airline company. Regarding our first hypothesis we
were expecting a considerable decrease in the costs of the solutions found by our MAS. From the results obtained (see Table 9) we can see that:
Table 9: Comparison of the results.
Method 1 Method 2 Met1/ Met2 Total % Total % % Solution: - Base A 7 47 3 20,0 -57,1 - Base B 6 40 7 47,0 16,7 - Base C 2 13 5 33,0 150,0 Time (sec) 101 100 25 24,8 -75,3 - Base A 88 21 24 24,0 -72,7 - Base B 110 27 24 24,0 -78,2 - Base C 115 28 26 26,0 -77,4 Total Costs: 7039,6 100 3839,3 54,5 -45,5 Costs Rank: - CPT 2532,5 36,0 720,8 18,8 -71,5 - FO 720,0 10,2 499,2 13,0 -30,7 - SFA 932,5 13,3 534,2 13,9 -42,7 - FA 2854,6 40,6 2085,1 54,3 -27,0 Costs Base: - Base A 4845,5 92,4 288,0 11,2 -94,0 - Base B 1796,4 34,3 1275,8 49,8 -29,0 - Base C 397,6 7,6 2275,5 88,8 472,3 Cost(SolutionMAS(3839,3))<Cost(SolutionMet1(7039,6))
It represents a decrease of 45.5% on the costs. Our hypothesis was accepted. Of course that we cannot infer that our MAS will always produce solutions that cost 45.5% less. It is not even possible to say that, in average, this decrease is valid. For that we need to evaluate much more situations, in different times of the year (we might have seasoned behaviours) and, then, find an average value. However, taking into consideration that our method includes information that is not available in the current method of the airline (for example, hour
salary, perdiem value, lodging and extra-crew travel), and that this information has an immense
impact on the total cost, we can state that our method will never produce more expensive solutions.
From the results we can also obtain other interesting conclusions. These conclusions can be expressed by the following formalism:
1. Time(SolutionMAS(25s))< Time(SolutionMet1(101s))
2. Cooperation(SolutionMAS(BaseB(47%))) > Cooperation(SolutionMet1(BaseB(40%))) and
Cooperation(SolutionMAS(BaseC(33%))) > Cooperation(SolutionMet1(BaseC(13%)))
Regarding 1) our method was 75.3% faster than method two. The use of a computerized system to find and evaluate the solutions is the reason for our method to be faster than the present method used in the airline. Regarding 2) we can see that the cooperation between different operational bases has increased with our method, because we evaluate all the solutions found (including the ones from different operational bases where the event happened) and choose the one with less cost. In method one, they choose the first one they find, usually from the same base where the event was triggered. This cooperation is also possible to be inferred from the costs by base. In Table 9 it is possible to see that the costs of base C had an increase of 472.32% while base A and base B decreased 94% and 29%, respectively. This means that our method used more resources from other bases than the base where the problem happened (base A).
Regarding our second hypothesis we expected to increase the robustness of our system using heterogeneous algorithms to find solutions to the same problem, at the same time. We were not able to collect enough data to analyze the impact on robustness as the result of using different specialized agents. Preliminary results show that, most of the times, the MAS presents at least one solution even when the human operator cannot found one. Apparently this is the result of using different techniques to tackle the problem. However, the solution might have a cost that, when compared with other ways of solving the problem (for example, cancelling the flight), might be unacceptable. This tells us that our MAS need to have access to more information. For example and in the case of cancelling the flight, it would be important to have access to the cost of compensations due to passengers in these situations. In the future we will try to prove this hypothesis.
This paper has presented a distributed multi-agent system as a possible solution to solve airline operations recovery problems, including sub-organizations with specialized agents, dedicated to solve crew, aircraft and passenger recovery problems. We have detailed the architecture of our MAS regarding the sub-organization dedicated to solve crew recovery problems, including agents, services and protocols. We have introduced a multi-criteria algorithm for selecting the solution with less cost from those proposed as part of the negotiation process. A simple example was presented, following, step-by-step, our proposed method. A
case study, taken from a real scenario in an airline company where we tested our method was also presented and we discuss the results obtained. We have shown that our method produces faster and less expensive solutions when compared with the present method used in the airline company.
Further work is required in testing our method for large periods of time and in different times of the year (due to seasoned behaviours). We also need to test our MAS with all the sub-organizations working at the same time (crew, aircraft and passenger) to see the impact that might exist in the results we have presented in this paper. Finally, we would like to apply and test the integration of the EM as presented in (Malucelli et al., 2006).
REFERENCES
Abdelgahny, A., Ekollu, G., Narisimhan, R., and Abdelgahny, K., 2004. A Proactive Crew Recovery Decision Support Tool for Commercial Airlines during Irregular Operations, Annals of Operations
Research, 127, 309-331.
Barnhart, C., Belobaba, P., and Odoni, A., 2003. Applications of Operations Research in the Air Transport Industry, Transportation Science, 37, 368-391.
Bellifemine, F., Caire, G., Trucco, T., and Rimassa, G., 2004 JADE Programmer’s Guide. JADE 3.3, TILab S.p.A.
Bratu, S., and Barnhart, C., 2006. Flight Operations Recovery: New Approaches Considering Passenger Recovery, Journal of Scheduling, 9,3, 279-298. Castro, A., and Oliveira, E., 2005. A Multi-Agent System
for Intelligent Monitoring of Airline Operations,
Proceedings of the Third European Workshop on Multi-Agent Systems, (Brussels, Belgium), 91-102.
Clausen, J., Larsen, A., and Larsen, J.,2005. Disruption
Management in the Airline Industry – Concepts, Models and Methods. Technical Report 2005-01,
Informatics and Mathematical Modeling, Technical University of Denmark, DTU.
Kohl, N., Larsen, A., Larsen, J., Ross, A., and Tiourline, S., 2004. Airline Disruption Management –
Perspectives, Experiences and Outlook. Technical
Report CRTR-0407, Carmen Research.
Kohl, N., and Karish, S., 2004. Airline Crew Rostering: Problem Types, Modeling and Optimization, Annals of
Operations Research, 127, 223-257.
Lettovsky, L.,1997. Airline Operations Recovery: An
Optimization Approach, Ph.D. Thesis, Georgia
Institute of Technology, Atlanta, USA.
Malucelli, A., Castro, A., and Oliveira, E., 2006. Crew and Aircraft Recovery Through a Multi-Agent Electronic Market, Proceeding of IADIS e-Commerce 2006, (Barcelona, Spain), 51-58, ISBN: 972-8924-23-2.
Martins, J., and Morgado, E., 1996. Managing Flight Operations, Proceedings of ATTIS’96, (London, England).
Rosenberger, J., Johnson, E., and Nemhauser, G., 2001.
Rerouting aircraft for airline recovery, Technical
Report TLI-LEC 01-04, Georgia Institute of Technology.
Rosenberger, J., Schaefer, A., Goldsmans, D., Johnson, E., Kleywegt, A., and Nemhauser, G., 2002. A Stochastic Model of Airline Operations, Transportation Science,
36,4, 357-377.
Wooldridge, M., 2002. When is an Agent-Based Solution Appropriate? Introduction to Multiagent Systems, West Sussex, England: John Wiley & Sons, Ltd., pp. 225-226.