BJRS
06-02 (2018) 01-12Accepted for publication: 2018-04-12
Determination of the kinetic parameters of BeO
thermoluminescent samples using different methods
F. J. Algarve; L. V. E. Caldas
Instituto de Pesquisas Energéticas e Nucleares, Comissão Nacional de Energia Nuclear (IPEN/CNEN), São Paulo, Brazil [email protected], [email protected].
ABSTRACT
The objective of this work was to determine the kinetic parameters of BeO thermoluminescent (TL) samples. The knowledge of the kinetic parameters is important for the general description of the physical characteristics of a thermoluminescent material. Using a linear heating rate of 5Ks-1, the BeO peak temperatures obtained were
(474.7 ± 1.2) K and (620.5 ± 1.2) K, respectively, for the first and second TL peaks. The peak shape and the glow curve area measurement methods and the Urbach formula have been used for the trap parameter determination. A kinetic order of about two was determined for the first peak, whereas the second peak followed the first-order kinetics according to the geometrical factor. The energy activation values obtained using different kinds of measurements are in good agreement, including the Kitis method for deconvolution of the glow curve. Furthermore, the results agree with those presented by other authors.
1. INTRODUCTION
The field of thermoluminescent dosimetry is widely used in personal dosimetry, and year by year new compounds are studied as possible thermoluminescent materials with the objective of having a material more equivalent to biological tissue, and therefore it is necessary to know all the physical characteristics of the substance, as for example the kinetic parameters.
One of these materials is the Beryllium Oxide (BeO). It has an effective atomic number of approximately 7.22, that is similar to the effective atomic number of biological tissue (Zeff ~ 7.6),
presents linearity of response of six orders of magnitude (5µGy until 5Gy), has high sensitivity to mechanical stress, is insensitive to moisture (when in pellet form), and is of low cost of production due to its wide use in the electronic and aerospace industries. However, BeO response presents high fading stimulated by white light, and should preferably be handled under red or yellow light [1][2][3].
The aim of the study is to report the kinetics parameters of BeO and its physical characteristics as a thermoluminescent material.
2. MATERIALS AND METHODS
The study was performed using ceramic BeO in disc form with (4.004 ± 0.003) mm of diameter, (0.771 ± 0.003) mm of thickness and (27.18 ± 0.02) mg of mass. An x-ray diffraction analysis showed that the main impurities are Al (350 ppm), K (749 ppm) and Si (801 ppm) [4]. The thermal treatment at 500°C for 15 min was used throughout the experiments, in order to erase any residual information before the subsequent irradiation. Figure 1 shows an example of BeO glow curve obtained with a linear heating rate of 5.0 K/s and a test dose of 464.8 mGy from an X-rays system of quality RQR 8 (100kV, 10mA; CSR of 3.97 mmAl and additional filtration of 3.2 mmAl).
Figure 1: BeO glow curve obtained with a linear heating rate of 5.0 K/s and a test dose of
464.8 mGy of X-rays (RQR 8).
The experimental apparatus used to read out the TL emission and to record the glow curve is based on a system RISÖ TL/OSL-DA20. For thermal treatment an oven muffin type model MFLO1000 of Provecto Analítica was utilized.
2.1. Methods for determining the frequency factor and activation energy
The Chen method was utilized for the determination of the frequency factor; for the determination of the activation energy the following methods were used [5] [6]:
• Urbach method; • Peak shape methods:
o Chen method; o Grosswiener method; o Lushchik method;
o Halperin and Braner method; o Chen additional formulae; • The area measurement method.
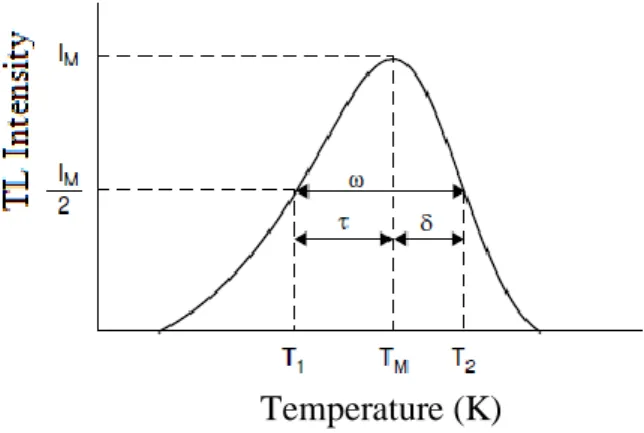
Figure 2: Peak parameters used in the peak shape methods.
TM is the peak temperature, and the temperatures corresponding to the half of the peak intensity are
T1 for temperature lower than TM, and T2 for temperature higher than TM, and:
𝜔 = 𝑇2 − 𝑇1 ; 𝜏 = 𝑇𝑀 − 𝑇1 ; 𝛿 = 𝑇2 − 𝑇𝑀 (1)
2.2. Deconvolution
The deconvolution is a mathematical method to create a curve using some theoretically and /or experimentally determined parameters. In this work the deconvolution process was used to verify if the kinetics parameters determined with various methods are consistent with each other by comparing them with the experimentally curve of TL emission. The method used was developed by Kitis cited by Chen and Pagonis [7].
3. RESULTS AND DISCUSSION
The results were obtained using the described methods. In Table 1 are presented the temperature values (obtained from the TL emission curve), where the maximum intensity of the TL emission occurs and at half of the maximum intensity of the TL emission. In Table 2 are presented the parameters of the peak shape methods.
Table 1: Maximum intensity temperature (TM) and temperatures at half of the maximum intensity
(T1 e T2) of the BeO TL peaks.
TL Peak TM (K) T1 (K) T2 (K) First 475 ± 1 449 ± 1 500 ± 1 Second 620 ± 1 586 ± 1 646 ± 1
Table 2: Parameters used in the peak shape methods.
TL Peak ω (K) (T2 - T1) δ (K) (T2 - TM) τ (K) (T2 - T1) 𝜇 (δ / ω) First 50.4 ± 0.1 25.2 ± 0.1 25.2 ± 0.1 0.500 ± 0.003 Second 59.4 ± 0.1 25.2 ± 0.1 34.2 ± 0.1 0.424 ± 0.003
Using the area measurement method, for the fitting of the TL curves of BeO it was considered that the kinetic order of the first TL peak is between 1.0 and 2.0, and of the second TL peak, between 0.7 and 2.0. The results of the fittings are shown in Figure 3.
Figure 3: Determination of the kinetics order of (a) first TL peak and of (b) second TL peak of
BeO, using the area measurement method.
(b) (a)
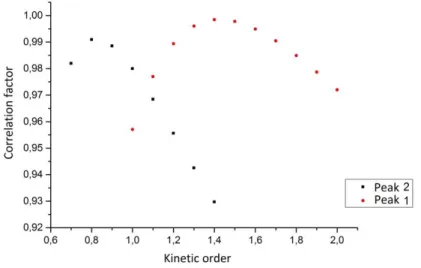
To determine the best linear fit, and consequently the kinetic order, the correlation factor was considered close to 1, as it may be observed in Figure 4.
Figure 4: Correlation factor versus kinetic order of TL peaks 1 and 2 of BeO.
The value of the kinetic order for the first TL peak is (1.40 ± 0.20), and for the second peak it is (0.80 ± 0.20).
The values of the activation energy and of the frequency factor determined in the present work, using the described methods are indicated in Tables 3 and 4; in Tables 5 and 6 are shown the values obtained by Bacci et al[8].
Table 3: Activation energy and frequency factor for the first TL peak of BeO determined in the present work. Method First TL peak Activation energy (eV) Frequency factor (s-1) Kinetic order Urbach 0.9495 ± 0.0004 109 1 Grosswiener 1.226 ± 0.006 (3.07 ± 0.2)× 1012 2 Lushchik 1.315 ± 0.007 (2.89 ± 0.04)× 1013 2 Halperin e Braner 1.234 ± 0.007 (3.72 ± 0.06)× 1012 2 Area 1.149 ± 0.005 (4.53 ± 0.04)× 1011 1.4 ± 0.2 Chen (ω) 1.20 ± 0.01 (1.74 ± 0.03)× 1012 1.6 ± 0.1 (τ) 1.19 ± 0.02 (1.29 ± 0.02)× 1012 1.6 ± 0.1 (δ) 1.20 ± 0.02 (1.68 ± 0.02)× 1012 1.6 ± 0.1 (ω') 1.271 ± 0.001 (9.71 ± 0.01)× 1012 2
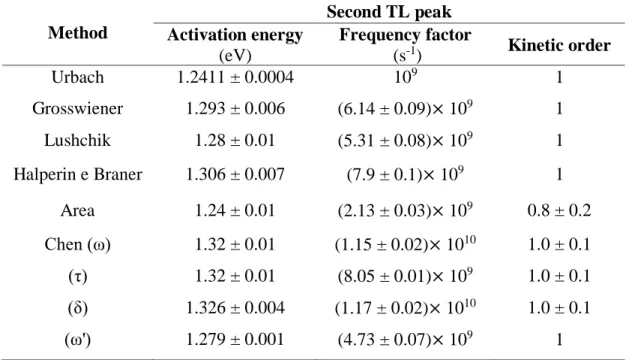
Table 4: Activation energy and frequency factor for the second TL peak of BeO determined in the
present work. Method Second TL peak Activation energy (eV) Frequency factor (s-1) Kinetic order Urbach 1.2411 ± 0.0004 109 1 Grosswiener 1.293 ± 0.006 (6.14 ± 0.09)× 109 1 Lushchik 1.28 ± 0.01 (5.31 ± 0.08)× 109 1 Halperin e Braner 1.306 ± 0.007 (7.9 ± 0.1)× 109 1 Area 1.24 ± 0.01 (2.13 ± 0.03)× 109 0.8 ± 0.2 Chen (ω) 1.32 ± 0.01 (1.15 ± 0.02)× 1010 1.0 ± 0.1 (τ) 1.32 ± 0.01 (8.05 ± 0.01)× 109 1.0 ± 0.1 (δ) 1.326 ± 0.004 (1.17 ± 0.02)× 1010 1.0 ± 0.1 (ω') 1.279 ± 0.001 (4.73 ± 0.07)× 109 1
Table 5: Activation energy and frequency factor for the first TL peak of BeO obtained by Bacci et al [7]. Method First TL peak Activation energy (eV) Frequency factor (s-1) Kinetic order Urbach 0.99 ± 0,01 109 Grosswiener 1.47 ± 0,02 (1.0 ± 0.2)× 1015 2 Lushchik 1.55 ± 0,02 (7.1 ± 0.3)× 1015 2 Halperin e Braner 1.49 ± 0,03 (1.6 ± 0.2)× 1015 2 Area 1.14 ± 0,01 (2.4 ± 0.5)× 1014 1.61 ± 0.04 Chen (ω) 1.45 ± 0,05 (6.4 ± 0.2)× 1014 1.7 ± 0.2 (τ) 1.45± 0,05 (6.4 ± 0.1)× 1014 1.7 ± 0.2 (δ) 1.43 ± 0,05 (3.9 ± 0.3)× 1014 1.7 ± 0.2 (ω’) 1.52 ± 0,01 (3.4 ± 0.2)× 1014 2
Table 6: Activation energy and frequency factor for the second TL peak of BeO obtained by
Bacci et al [7]. Method Second TL peak Activation energy (eV) Frequency factor (s-1) Kinetic order Urbach 1.28 ± 0.01 109 Grosswiener 1.24 ± 0.05 (3.1 ± 0.4)× 109 1 Lushchik 1.36 ± 0.06 (3.0 ± 0.2)× 109 1 Halperin e Braner 1.25 ± 0.06 (3.7 ± 0.4)× 109 1 Area 1.27 ± 0.03 (5.4 ± 0.2)× 109 1.0 ± 0.2 Chen (ω) 1.19 ± 0.08 (1.2 ± 0.2)× 109 1.0 ± 0.1 (τ) 1.19 ± 0.07 (1.2 ± 0.5)× 109 1.0 ± 0.1 (δ) 1.16 ± 0.09 (0.7 ± 0.1)× 109 1.0 ± 0.1 (ω’) 1.29 ± 0.05 (7.9 ± 0.2)× 109 1
Analyzing the results of Tables 3 and 4 it is possible to see the agreement of values obtained using different methods. The values obtained using the peak shape and area measurement methods are more in agreement with each other that the Urbach method for the first TL peak. This occurs because Urbach considered the frequency factor 1 × 10⁹ s-1 in his method [5][8][9].
According to Chen, the values of activation energy involving δ and ω result in an inadequate evaluation, where the equations using τ are more accurate [8].
When comparing the values of Tables 3, 4, 5 and 6 it may be concluded that the activation energies and the frequency factors do not agree. This occurs probably because the BeO samples used in this work have impurities that do not exist in the samples studied by Bacci et al [8] that influence the types of traps present in the material. In Table 7 are presented the impurities found in the BeO samples tested in this work and those by Bacci et al [8], for comparison.
Table 7: Impurities in BeO samples. Impurities
(GROPPO, 2013) Si, K, Fe, Al e Co (BACCI et al, 1989) Mg e Si
The deconvolution of the TL emission curve was obtained using the Kitis method, and considering the values of activation energy and frequency factor obtained with all the methods used in this work. The results are indicated in Figures 5 and 6.
Figure 5: Deconvolution of the TL emission curve of BeO using the values of frequency factor and
activation energy obtained by Chen method and the parameter δ.
Figure 6: Deconvolution of (a) the first TL peak and (b) the second TL peak of the TL emission
curve of BeO, using the values of frequency factor and activation energy of Tables 3 and 4.
Comparing the curves obtained with the deconvolution, using the values of activation energy and frequency factor of Tables 3 and 4, it can be seen that there are no significant differences among them, except in the curve that used the kinetics parameters obtained with Urbach method.
Therefore, any determination method of the frequency factor and activation energy, except that of the Urbach method, is acceptable, from the point of view of the present study.
4. CONCLUSIONS
The kinetics parameters of BeO correspond to the values obtained in all of the methods, except by Urbach method, what is evident in the deconvolution of the TL emission curve when compared with the TL emission curve obtained experimentally. The values of kinetics parameters obtained in this work disagree with those from other studies, possibly because of the different impurities in the samples used in the studies. The impurities interfere in the trap depth of the samples, so the impurities need to be considered in all samples to determine correctly the kinetics parameters.
5. ACKNOWLEDGMENTS
The authors acknowledge the Brazilian agencies FAPESP (Project 2008/57863-2), CNPq (Project 301335/2016-8), CAPES (Project: 1532314) and INCT (Project 573659/2008-7) Radiation Metrology in Medicine, for the partial financial support.
REFERENCES
[1] VIJ, D. R.; SINGH, N. Review thermoluminescence dosimetric proprierties of beryllium oxide.
J. Mater. Sci.v. 32, p. 2791-2796, 1997.
[2] SOMMER, M., JAHN, A., HENNIGER, J. Beryllium oxide as optically stimulated luminescence dosimeter. Radiat. Meas. v. 43, p. 353-356, 2008.
[3] SOUZA, S. O.; YAMAMOTO, T.; d’ERRICO, F. State of the art in solid state dosimetry, In:
Proceedings of the International Joint Conference RADIO, p. 1028 - 1035, 26 - 29 August,
2014. (In Portuguese)
[4] GROPPO, D. P.; CALDAS, L. V. E. Luminescent response from BeO exposed to alpha, beta and X radiations. Radiat. Meas., v. 71, p. 81 – 85, 2014.
[5] FURETTA, C. Handbook of thermoluminescence. World Scientific Publishing, London: England, 2003.
[6] ASLAR, E.; SAHINER, E.; POLYMERIS, G. S.; MERIC, N. Determination of trapping parameters in BeO ceramics in both quenched as well as reconstructed thermoluminescence glow curves using various analysis methods. Appl. Radiat. Isot., v. 129, p. 142 – 151, 2017.
[7] CHEN, R.; PAGONIS, V. Thermally and optically stimulated luminescence: A simulation
approach. Wiley, London: England, 2011.
[8] BACCI, C.; BERNARDI, P.; DAMILANO, A.; FURETTA, C.; RISPOLI, B. Kinetics parameters in BeO thermoluminescent material. J. Phys. D: Appl. Phys., v. 22, p. 1751 – 1757, 1989.
[9] CHEN, R.; McKEEVER, S. W. S. Theory of Thermoluminescence and Related Phenomena. World Scientific, Singapore, 1997.


![Table 5: Activation energy and frequency factor for the first TL peak of BeO obtained by Bacci et al [7]](https://thumb-eu.123doks.com/thumbv2/123dok_br/18290182.882578/8.893.132.762.234.593/table-activation-energy-frequency-factor-peak-obtained-bacci.webp)

