Deposited in Repositório ISCTE-IUL:
2019-05-23
Deposited version:
Post-print
Peer-review status of attached file:
Peer-reviewed
Citation for published item:
Richins, M., Barreto, M., Karl, A. & Lawrence, N. (2019). Empathic responses are reduced to competitive but not non-competitive outgroups. Social Neuroscience. 14 (3), 345-358
Further information on publisher's website:
10.1080/17470919.2018.1463927
Publisher's copyright statement:
This is the peer reviewed version of the following article: Richins, M., Barreto, M., Karl, A. & Lawrence, N. (2019). Empathic responses are reduced to competitive but not non-competitive outgroups. Social Neuroscience. 14 (3), 345-358, which has been published in final form at
https://dx.doi.org/10.1080/17470919.2018.1463927. This article may be used for non-commercial purposes in accordance with the Publisher's Terms and Conditions for self-archiving.
Use policy
Creative Commons CC BY 4.0
The full-text may be used and/or reproduced, and given to third parties in any format or medium, without prior permission or charge, for personal research or study, educational, or not-for-profit purposes provided that:
• a full bibliographic reference is made to the original source • a link is made to the metadata record in the Repository • the full-text is not changed in any way
The full-text must not be sold in any format or medium without the formal permission of the copyright holders. Serviços de Informação e Documentação, Instituto Universitário de Lisboa (ISCTE-IUL)
Av. das Forças Armadas, Edifício II, 1649-026 Lisboa Portugal Phone: +(351) 217 903 024 | e-mail: [email protected]
Accepted Manuscript
DOI: 10.1080/17470919.2018.1463927
Empathic Responses Are Reduced to Competitive but Not
Non-Competitive Outgroups
Matt T. Richins
1, Manuela Barreto
1 2, Anke Karl
1, & Natalia Lawrence
1 1School of Psychology, University of Exeter, Perry Road, Exeter, EX4 4QG, UK2 Lisbon University Institute (CIS/ISCTE-IUL) Av. das Forças Armadas 376, 1600-077 Lisboa, Portugal
+44 (0)1392 722638, [email protected] @DrMattRichins +44 (0)1392 722674, [email protected]
+44 (0)1392 725271, [email protected] @AnkeKarl
+44 (0)1392 724672, [email protected] @DrNatLawrence Please direct correspondence to: Matt T. Richins, +44 (0)1392 722638, [email protected]
This work was supported by the Defence Science Technology Labs under Grant DSTLX-1000083201.
The views expressed in the submitted article are the authors’ and not an official position of the host institution or funder.
Word count: 8654
Number of figures and tables: 2 figures, 1 table Conflict of interest: None declared.
Accepted Manuscript
Empathic Responses Are Reduced to Competitive but Not Non-Competitive Outgroups
Individuals feel more empathy for those in their group (i.e. ingroup members) than those who are not (i.e. outgroup members). But empathy is not merely selective to group distinctions, rather it fluctuates according to how groups are perceived. The goal of this research was to determine whether group-based evaluations can drive biases in self-reported empathy as well as in the underlying neural activity. Participants were asked to rate a target’s physical pain while BOLD responses were recorded via functional magnetic resonance imaging (fMRI). The target was either a member of the ingroup or one of two outgroups, one which was more of a rival to the ingroup than the other. Participants reported more empathy for targets experiencing painful compared to innocuous events showing bias only in favour of their ingroup. Neural responses were stronger while observing painful, compared to innocuous, events but only for targets from the ingroup or the less competitive outgroup. The difference was non-significant and trended in the opposite direction when the target was from the more
competitive outgroup. This provides evidence that empathy is not merely
selective to “us” vs “them” but is more nuanced by whom we refer to by “them”. Keywords: empathy; intergroup; rivalry; pain; fMRI
Accepted Manuscript
Individuals feel more empathy for those in their group (i.e. ingroup members) compared to those who are not (i.e. outgroup members)—this is referred to as empathic bias. Using self-report ratings, researchers have shown that empathic bias can manifest at varying degrees from ambivalence (Stürmer, Snyder, & Omoto, 2005; Tarrant, Dazeley, & Cottom, 2009) to malicious pleasure (i.e. Schadenfreude; Cikara, Botvinick, & Fiske, 2011; Leach, Spears, Branscombe, & Doosje, 2003). Empathic bias can also manifest at the level of neural activity. Xu, Zuo, Wang, and Han (2009), found that participants exhibited stronger blood oxygenation level dependent (BOLD) responses associated with empathy while viewing same-race compared to other-race targets in physical pain. Recent accumulating evidence shows that empathy for others in pain is not just simply always more for ingroup compared to outgroup members, but is dependent on the outgroup and the intergroup context. Indeed, Avenanti, Sirigu, and Aglioti (2010) found that seeing a person being stabbed was associated with a mu suppression effect which was attenuated when the target ostensibly belonged to both a familiar racial outgroup (i.e. a black hand) and an unfamiliar racial outgroup (i.e. a violet-coloured hand). This suggests that biases in processing other-race pain is not only because of visual differences, but appears to be related to prior experiences or
knowledge of a group—triggered by visually salient cues to categorization.
At the self-report level, the extent to which we feel ambivalence or joy to an outgroup member’s pain is determined by whether or not we perceive the outgroup as a possible rival to the ingroup (Chang, Krosch, & Cikara, 2016; Cikara, Bruneau, Van Bavel, & Saxe, 2014). Researchers identified that BOLD responses are similarly
modulated by whether the outgroup is considered to be a rival or not (Cikara, Botvinick, & Fiske, 2011; Hein, Silani, Preuschoff, Batson, & Singer, 2010) or has higher status than the ingroup (Feng et al., 2016). However, one of the limitations of this research is
Accepted Manuscript
that empathy is measured in relation to an ingroup and single outgroup (“us” vs.
“them”), not multiple outgroups to which the ingroup might relate differently (“us” vs. a rival “them” vs. a non-rival “them”). Thus to determine whether or not empathic bias emerges according to how relevant an outgroup is to the ingroup, in terms of rivalry, it is necessary to compare empathic responses not only between the ingroup and an outgroup but also between different outgroups.
Cikara and Fiske (2011), report one of few studies that has measured empathy in relation to multiple different social groups. While reading about another’s experiences of misfortune, researchers found the anterior insula (a region strongly associated with empathy; Lamm, Decety, & Singer, 2011) was least active if the target was from a typically envied social group compared to if they were from a typically pitied, admired, or contemptible social group. On the other hand, they found if the event was positive, and the target typically envied, the insula was more active than it was in any other condition. Given the insula’s involvement in processing pain (Peyron, Laurent, & García-Larrea, 2000) the authors interpreted this activation as indicative of a counter-empathic response (i.e. knowing that someone we envy experienced something good is somehow painful). With these results, Cikara and Fiske showed for the first time that empathising with another’s misfortune is not simply modulated by ingroup-outgroup distinctions, but varies as a function of how the outgroup is evaluated by the individual. At this point, however, it is unclear to what extent these biases are specific to a concern-related empathy (i.e. when responding to another’s misfortunes) or whether biases of this nature also penetrate more automatic forms of empathic processing (such as when responding to another’s physical pain). Previous research indicates that pre-existing experiences with some groups (other-races) modulate one’s processing of their pain (Avenanti, Sirigu, & Aglioti, 2010), but no study has yet measured the extent to which
Accepted Manuscript
specific group-based evaluations, as a result of those prior experiences, can drive biases in empathy for pain while controlling for visually salient cues to categorization.
The goal of the current study was to determine whether group-based evaluations can drive biases in empathy for pain at the self-report and at the level of brain
activation. Brain activation is not only interesting in itself—as it can shed light on the mechanisms through which group biases emerge—but it also allows us to access responses that respondents cannot control, which is especially important when
examining socially desirable responses such as empathy (Tarrant et al., 2009). In this study, we asked participants to observe targets from either the ingroup university or one of two neighbouring outgroup universities as they appeared to experience physically painful or innocuous events. Participants were asked to rate the extent to which they felt empathic or compassion-based responses towards the targets while BOLD responses were recorded via functional magnetic resonance imaging (fMRI). Based on a recent meta-analysis, we expected that observing pictures of another’s pain would lead to increased activation in the insula—in anterior (associated with affective representation of another’s state) but not posterior regions (which is more associated with the direct experience of pain; Lamm & Singer, 2010). We also expected to observe activation in regions that process the felt unpleasantness of physical pain such as the anterior
cingulate (ACC) as well as areas engaged in the inference and representation of mental states such as the medial prefrontal cortex (mPFC) and temporoparietal junction (TPJ; Lamm et al., 2011).
We expected activity in these regions would be modulated by the group membership of the target, but more specifically by how participants evaluated the target’s group in terms of a perceived rivalry with the ingroup. Indeed, others have
Accepted Manuscript
previously highlighted the role that context plays in modulating AI activity during social interaction (Lamm & Singer, 2010). In further support of these predictions, a recent study by Feng et al. (2016) demonstrated that participants exhibited more activity in the AI and anterior medial cingulate cortex (aMCC) when a target in pain was a member of a low compared to high status outgroup. While Molenberghs et al. (2014), found that group membership had no effect on activation in the ACC or AI in their study, they did not measure how the outgroup was perceived by the participants. It is not possible, therefore, to rule out whether participants perceived the outgroup as a relevant rival to the ingroup—which previous research has demonstrated is crucial for the emergence of intergroup empathic bias (Cikara et al., 2014).
In this study, we included items to measure participants’ perceptions of the target groups on a range of attributes relevant to intergroup relations and that have been shown to be key in driving intergroup empathic bias including stereotype content (Cikara & Fiske, 2011) and perceived rivalry (Cikara et al., 2014). We expected that activation in regions associated with empathy for pain (ACC and AI) and other processes related to empathy (i.e. mentalizing; mPFC) would be attenuated while observing outgroup targets compared to ingroup targets in pain. Crucially, however, we expected that this effect would be qualified by the extent to which the outgroup was perceived to be a rival to the salient ingroup, such that there would be less empathy-related activity in response to targets from the relatively more competitive outgroup than to targets from the relatively less competitive outgroup.
Method
Design. This study followed a 2 (event: painful vs. innocuous) x 3 (target group
Accepted Manuscript
of Sussex student)1 x 2 (salient rival: Cardiff University vs. University of Sussex) mixed measures design with the perceived event and target group membership varied within participants, and the salience of rivalry varied between participants. We manipulated the perceived competitiveness of the outgroups by presenting participants with a bogus news article in which the outgroup was either described as a rival to the ingroup or not (refer to Supplementary Materials for further details about the article).
Participants. Sample size was based on an a-priori power analysis (G* Power
[Version 3.1], Faul, Erdfelder, Buchner, & Lang, 2009) (Analysis of Variance
[ANOVA] mixed effects model; power =.80, α = .05; effect size f = .16). The assumed effect size was derived from a within-between interaction on self-reported scores of empathic-concern that emerged from an unpublished pilot of the paradigm (N = 64; see Supplementary Materials). A total of 70 healthy volunteers—with no reported history of psychiatric or neurological disorders, and no current use of any psychoactive
medications—were recruited from the University of Exeter and remunerated with £5 for their time. One participant had to be excluded from the analysis (given extensive
artefacts in the structural scan), leaving 69 participants in total (Mage = 20.57, SD = 3.04,
42 female, all right-handed). The study was approved by both the Ethics Committee of the School of Psychology, University of Exeter, and the Ministry of Defence Ethics Committee. Participant consent was obtained according to the Declaration of Helsinki (World Medical Association, 2013).
Stimuli. Participants viewed photos of individuals that were denoted as either
1 At the time of testing the University of Exeter was ranked 10th in the UK overall, compared to
Accepted Manuscript
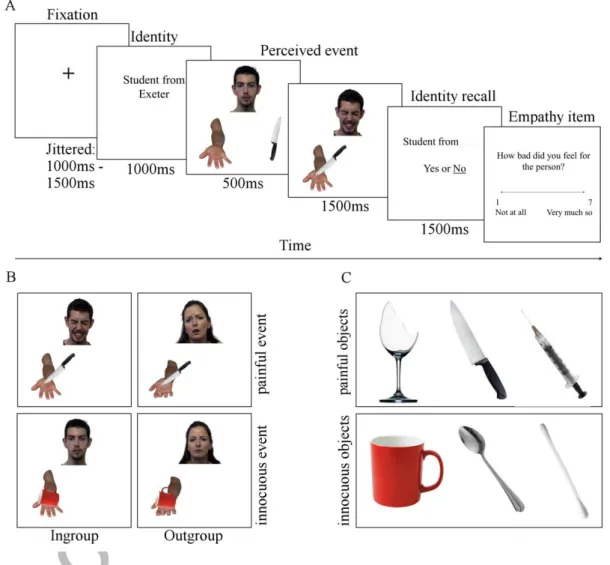
ingroup members or outgroup members experiencing painful or innocuous events (Figure 1FigureB). Participants were told to imagine that the events were happening in real time. Information about the target’s group membership was presented in advance of the event (1000ms).2 The nature of the event was manipulated using common objects that can cause either pain (Figure 1C, upper row) or not (Figure 1C, lower row). Objects across the two categories were semantically matched as closely as possible, for example a Q-tip and syringe are both used to prepare a part of the body for surgery; to clean the area and provide anaesthetic, respectively. The event animations consisted of 2-frame sequences of photographs (Figure 1A). The first frame (500ms) showed a face and hand/arm in neutral position beside an object. In half of the sequences, the object was one of three items that might cause pain (Figure 1C, upper row) and in the other it was one of three semantically-matched innocuous objects (Figure 1C, lower row). The second frame (1500ms) showed the object stimulating the hand, resulting in either a painful or neutral facial expression from the target. No inter-stimulus interval was used between these frames in order to create apparent motion. This paradigm was inspired by one used in (Morrison, Tipper, Fenton-Adams, & Bach, 2013) however has a number of substantial changes (for example, orientation of the perceived hand and the addition of the target’s face) and, for the first time here, is applied to a task involving empathy. Stimuli were created using 20 photographs of faces (10 male, 10 female) adapted from the pain expressions image set in the Psychological Image Collection (PICS;
pics.stir.ac.uk) and photographs of hands and arms (1 male and 1 female) that were created by the researchers of this study. The images of hands and arms were coded to
2 Within each condition, the target’s group membership was held constant throughout the study
Accepted Manuscript
appear in an allocentric perspective to depict a target sitting opposite, and facing, the participant. All photographs were created or edited using GNU Image Manipulation Program version 2.0 (The GIMP team). The photographs were matched for dimension and orientation as well as perceived age and race of the target. The duration of the fixation was randomly jittered (between 1000-1500ms) and inter-stimulus intervals (ISIs) were placed on either side of the animation, given a random duration between 250-1750ms (with the second ISI occupying the remaining time to amount 2000ms for combined ISIs per trial), thus equating a ‘stochastic’ design (Friston, Zarahn, Josephs, Henson, & Dale, 1999). A total of 96 trials, 50% depicting painful events (48), and 33% per university (32), each lasting 10 seconds, were presented in a single run. A new sequence of trials and timings was randomly generated for each participant. All stimuli were presented using E-Prime 2.0 software (Psychology Software Tools, Pittsburgh, PA) on an 800x600 LCD monitor.
Measures. Participants completed self-report measures of perceived group
competence (all alphas > .90), sociability (all alphas > .90), status (all alphas > .80), rivalry (all alphas > .80), and similarity (all alphas > .90) in relation to all three target groups included in the study (for a full account of these measures please refer to Supplementary Materials). Participants responded to 2 items gauging self-focused empathy (i.e. “how painful did the event seem to you?”) and other-focused compassion (i.e. “how bad did you feel for the person?”) Using both items allowed us to discern between responses that are shared with the other (i.e. experience/affect-sharing) compared to responses that are felt for the other (i.e. compassion). Responses were made using a 100 point visual analogue scale (VAS) with a response button-box (4-channel bimanual). This VAS was anchored in the same way as a 7-point Likert scale (1 = Not at all to 7 = Very much), but allowed participants to score anywhere between
Accepted Manuscript
those 7 points.
Figure 1. (A) Trial structure; (B) Example of the four possible events from the combination of the object types (painful and innocuous) and the target group membership (ingroup and outgroup); (C) Object stimuli depicted as causing either painful or innocuous stimulations to the target.
Procedure. After providing written informed consent participants were given a
bogus news article to read which made salient a longstanding rivalry between the ingroup and one of the two outgroups (see Supplementary Materials). To ensure participants had paid attention to the article, they were asked to complete three simple questions (e.g. “According to this article, which of the 2 universities is a long-standing rival to the University of Exeter?”)3 Observing safety protocols, participants were guided to the scanner and presented with standardised instructions via a digital projector system (Epson EMP-74). Participants completed 15 practice trials during the structural scan. At the onset of each trial of the main task, participants were required to memorise the target’s group membership (i.e. a student from one of the target universities), to observe that target experiencing either an innocuous or painful event, recall the target’s group membership in a simple 1-back task, and finally answer an item gauging their self- or other-focused responses to that target’s experience. After this, participants left the scanner and were asked to provide their self-reported impressions of the groups. At completion, participants were debriefed on the background and purpose of the study and
3 Only participants who answered these questions correctly—and thus who processed the
information—were included in the statistical analysis. However, participants were given the opportunity to revise the article at any point, resulting in accurate responses to those items, across the test sample.
Accepted Manuscript
given the opportunity to ask questions.
fMRI image acquisition. Scanning was performed on a 1.5T Philips Gyroscan
(SENSE-Head-8 coil) magnet at the University of Exeter MR centre, UK. Images sensitive to blood oxygenation level dependent (BOLD) contrast were acquired using a T2* weighted gradient echo planar imaging (EPI) sequence (TR = 3000ms, TE = 45, flip angle = 90°, matrix = 80 x 80m, voxel size = 3 x 3 x 3mm, 25mm min slice gap, ascending acquisition) and 520 volumes were acquired per participant. For each participant, functional data were overlaid on a high-resolution T1-weighted anatomical image for registration into standard space and functional localisation (3D T1 FFE, TR = 252 ms, TE = 4.2 ms, voxel size = 0.9mm3, slices = 160, FOV = 230 mm, Flip angle = 30º).
fMRI data analysis. Pre-processing and statistical analysis of functional images
was performed using FMRIBs Expert Analysis Tool (FEAT; FMRIB Software Library, release 5.0, 2012). For each individual participant, standard pre-processing steps were performed. These were: Motion correction (Jenkinson, Bannister, Brady, & Smith, 2002), removal of non-brain tissue (Smith, 2002), spatial smoothing (using a Gaussian kernel of FWHM 5mm), normalisation based on grand-mean intensity, and high-pass temporal filtering (Gaussian-weighted least-squares straight line fitting, with
sigma=50.0s). Registration of functional data to high-resolution T1 structural images and subsequently to Montreal Neurological Institute standardised space was carried out using FMRIB's Linear Image Registration Tool (MCFLIRT; Jenkinson & Smith, 2001). Anatomical locations were determined in the first instance by the Harvard-Oxford anatomical atlas provided with FSL and, in the case of ambiguity, a more detailed paper and digital brain atlas (Mai, Voss, & Paxinos, 2008).
Accepted Manuscript
First level, single-participant analyses were performed using a general linear model with local autocorrelation correction (Woolrich, Ripley, Brady, & Smith, 2001). Each trial was modelled from the onset of the first frame of the animation for a duration of 2 seconds (i.e. until the end of the animation). For a separate, exploratory analysis we also modelled the 4 second response period for the self- and other-focused items,
allowing us to investigate whether regional activity differed during empathic vs compassion-based responses. A design matrix was fitted for each participant with 6 task-related regressors, one for each condition of the 2 x 3 factorial design as well as a regressor for the motion parameters of each orthogonal axis (i.e. to control for head movement; Jenkinson et al., 2002). Main effects of event (ExeterPain + SussexPain + CardiffPain > ExeterNoPain + SussexNoPain + CardiffNoPain) were evaluated to demonstrate whether or not the task engaged empathy-related brain areas. We also tested the main effect of target group membership [(ExeterPain + ExeterNoPain > CardiffPain + CardiffNoPain) + (SussexPain + SussexNoPain > CardiffPain + CardiffNoPain)] and interaction effects between event and target group membership [(ExeterPain > ExeterNoPain + CardiffNoPain > CardiffPain) + (SussexPain > SussexNoPain + CardiffNoPain > CardiffPain)] see Supplementary Details, Table S1 for further clarity of the GLM design. For higher level analyses, participants were analysed according to the between groups condition. Higher level analyses were carried out using FLAME stage 1 (Beckmann, Jenkinson, & Smith, 2003; Woolrich, Behrens, Beckmann, Jenkinson, & Smith, 2004). Activations were thresholded at p < .05, family-wise error rate (FWER) corrected with a cluster-extent based thresholding method. We chose a more conservative cluster-defining primary threshold of p < .001 in line with recent recommendations that a threshold of .05 greatly inflates false-positive rates which are inherent to clusterwise inferences (Eklund, Nichols, & Knutsson, 2016).
Accepted Manuscript
Region of interest analysis. Initially, we examined the effects of target group
membership across the brain by running the main and interaction contrasts at the whole-brain level. We tested the a-priori hypotheses regarding activation in the AI, ACC, and mPFC, by conducting planned analyses using functionally defined regions of interests (ROIs). Functional ROIs were defined using the painful > innocuous events contrast, collapsed across target group membership. To look at differences in activation between the target identities, we extracted the mean percentage signal change in BOLD by expanding a 10 mm radial sphere from the peak voxel of each significant region in the pain > innocuous contrast image. To avoid issues of non-independence, we extracted data from the individual regressors from the first level analysis (and not from contrasts between target identities) using the Featquery tool in FSL. With these, we used SPSS (IBM SPSS Statistics for Windows, version 22.0. Armonk, NY: IBM Corp) to conduct within-group analyses comparing the mean percentage signal change in response to the different target identities.
Results
Self-report ratings. For a detailed report of the group perception measures
please see supplementary materials. In short, participants rated one of the outgroups as more of a rival of the ingroup than the other outgroup, in spite of the salience
manipulation. Specifically, students from Cardiff University were always rated as more competent and similar to the ingroup. They were also evaluated to be of a higher status and as greater rivals to the ingroup than students from the University of Sussex. This led us to expect that responses to the other’s pain would be attenuated for Cardiff targets compared to Sussex targets.
Accepted Manuscript
effect of the event (painful vs. innocuous) on ratings of empathy, F(1, 67) = 1175.37, MSE = 550.14, p <.001, η2=.95. Participants rated events to seem more painful when they depicted painful events (M = 84.84, SD = 15.24) compared to innocuous events (M = 5.79, SD = 1.35), t(68) = 34.54, p <.001, 95% CI [74.48, 83.62], d = 7.31. There was a main effect of target group membership, F(2, 134) = 25.62, MSE = 45.73, p <.001, η2 =.27. Participants rated the pain of ingroup targets to appear more painful (M = 89.08, SD = 14.10) than the pain of Cardiff targets (M = 83.02, SD = 16.54), t(68) = 5.52, p <.001, 95% CI [3.63, 9.49], d =.39, or Sussex targets (M = 81.99, SD = 14.87), t(68) = 7.31, p <.001, 95% CI [5.04, 10.15], d =.49. The difference between Cardiff targets and Sussex targets was non-significant, t(68) = .850, p =.398, 95% CI [-1.94, 4.01].
Manipulating the salient rival had no effect on ratings of empathy when measured in this self-focused way, F(1, 67) = .987, MSE = 603.38, p =.324, η2=.015. There were also no interaction effects between the target’s group membership and the salience manipulation on this measure, F(1, 67) = .157, p = .855, η2=.002.
Compassion. There was a strong main effect of the perceived event on
compassion, F(1, 67) = 849.821, MSE = 671.21, p <.001, η2=.93. Participants reported feeling worse for targets during painful events (M = 82.82, SD = 18.67) than innocuous events (M = 8.57, SD = 1.56), t(68) = 29.37, p <.001, 95% CI [69.21, 79.29], d = 5.60. There was a main effect of target group membership, F(2, 134) = 21.46, MSE = 48.92, p <.001, η2=.24. Participants reported feeling worse for the other in pain if they were an ingroup target (M = 87.08, SD = 18.07) compared to a Cardiff target (M = 82.04, SD = 17.69), t(68) = 5.11, p <.001, 95% CI [2.62, 7.45], d =.28, or a Sussex target (M = 79.41, SD = 19.30), t(68) = 5.85, p <.001, 95% CI [4.46, 10.89], d =.41. There was no difference in how bad they felt for Cardiff targets and Sussex targets, t(68) = -2.11, p
Accepted Manuscript
=.115, 95% CI [-5.72, .43], d = .14. There was also no main effect of the salience manipulation, F(1, 67) = .708, MSE = 919.68, p =.403, η2=.01, nor was there any interaction between the target’s group membership and the salience manipulation on this measure, F(2, 134) = .188, p =.829, η2=.003.
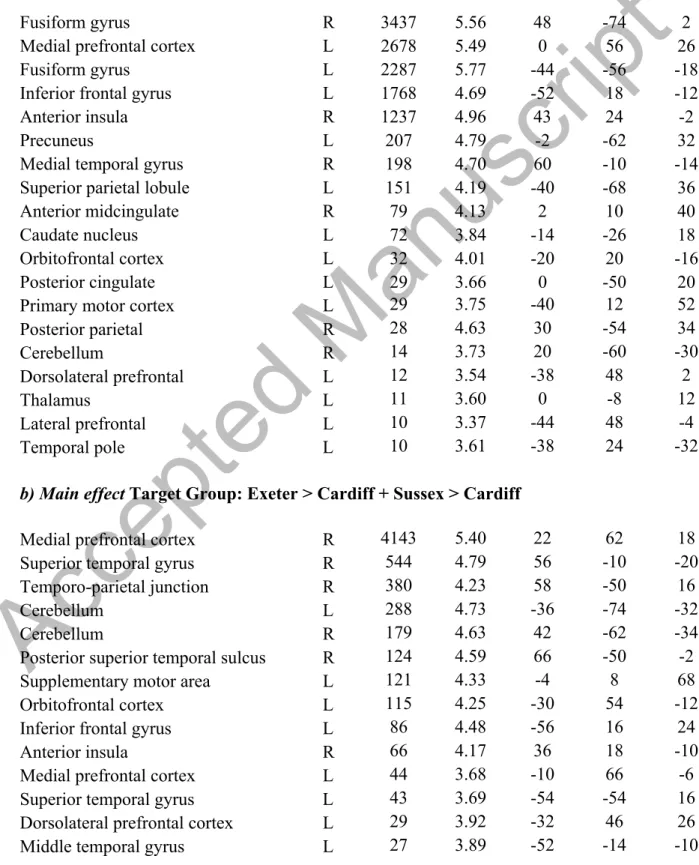
fMRI results. At the whole brain level, participants showed greater activation
when observing painful events compared to innocuous events in large clusters of the bilateral fusiform gyrus (MNI: -44, -56, -18; 48, -74, -2), the medial prefrontal cortex (mPFC; MNI: 0, 56, 26), precuneus (TPJ; MNI: -2, -62, 32), anterior midcingulate cortex (aMCC; MNI: 2, 10, 40), and the anterior insula (AI; MNI: 43, 24, -2; Figure 2 and Table 1). There was also a main effect of the target’s group membership in
activation of the mPFC (MNI: 22, 62, 18), TPJ (MNI: 58, -50, 16), aMCC (MNI: 0, 16, 46), IFG (MNI: 2, -42, -6), and AI (MNI: 36, 18, -19). In the interaction between the perceived event and the target’s group membership, significant clusters emerged in the MPFC (MNI: 0, 40, 36), bilateral IFG (MNI: -54, 16, 28; 58, 20, 22), primary and secondary somatosensory cortices (MNI: 66, -18, 26; -52, -38, 26), precuneus (MNI: 0, -54, 48), and AI (MNI: -40, 6, -12). There were no significant effects of the salience manipulation on regional activity.
Analysing activity within the functionally defined mPFC (defined by the main effect of event; painful > innocuous trials), demonstrated that the effect of the event (as shown in the whole brain analysis, Table 1) was qualified by an interaction between event and group membership, F(2, 136) = 23.09, MSE = .090, p <.001, η2= .26: The mPFC was more active during trials where ingroup members experienced painful (M = .23, SD = .51) compared to innocuous events (M = -.18, SD = .49), t(68) = 8.08, p < .001, 95% CI [.31, .51], d = 1.05. This was also the case when Sussex targets
Accepted Manuscript
experienced painful (M = .09, SD = .42) compared to innocuous events (M = -.12, SD = .37), t(68) = 4.02, p < .001, 95% CI [.10, .31], d = .54. However, the pattern of results
approached significance in the opposite direction when targets from Cardiff were depicted
as experiencing painful (M = .22, SD = .37) compared to an innocuous events (M =
-.14, SD = .39), t(68) = -1.77, p = .084, 95% CI [-.01, .17], d = .18. This interaction further qualified a main effect of the target’s group membership, F(2, 136) = 14.18, MSE = .121, p <.001, η2= .18. The mPFC was more active to the other’s pain if the other was an ingroup member (M = .23, SD = .51) compared to a target from Sussex (M = .09, SD = .42), t(68) = 3.02, p = .01, 95% CI [.03, .27], d = .30, or a target from Cardiff (M = -.22, SD = .37), t(68) = 6.45, p < .001, 95% CI [.28, .63], d = 1.01. The mPFC was also more active when observing Sussex targets compared to Cardiff targets in pain, t(68) = 6.08, p < .001, 95% CI [.18, .44], d = .78. However, there was no effect of the target’s group membership when the trials depicted innocuous events, F(2, 136) = .554, MSE = .067, p =.577, η2= .02. There was also no effect of the salience
manipulation, F(1, 67) = .794, MSE = .628, p =.376, η2= .012, nor any interaction between the manipulation and any other factor in the model.
Regarding the AI, the main effect of the perceived event was qualified by a significant interaction between event and the target’s group membership, F(2, 136) = 3.96, MSE = .09, p =.021, η2= .06. The AI was more active during trials where an ingroup member was depicted experiencing a painful (M = -.06, SD = .33) compared to innocuous event (M = -.25, SD = .35), t(68) = 4.47, p < .001, 95% CI [.11, .28], d = .56, or where a target from Sussex experienced a painful (M = -.06, SD = .28) compared to innocuous event (M = -.26, SD = .36), t(68) = 3.38, p = .001, 95% CI [.08, .32], d = .62. As with the mPFC, there was no difference in AI activity when Cardiff targets were depicted as experiencing painful (M = -.20, SD = .33) compared to innocuous events (M
Accepted Manuscript
= -.22, SD = .33), t(68) = .50, p = .615, 95% CI [-.07, .12], d = .06. There was no main effect of the target group membership, F(2, 136) = 2.09, MSE = .069, p =.127, η2= .03, but this was qualified by the interaction between the event and the target group
membership. The AI was more active to the other’s pain if they were from the ingroup than if they were a student from Cardiff, t(68) = 3.49, p = .003, 95% CI [.04, .24], d = .42, or if the other was from Sussex than if they were from Cardiff, t(68) = 3.53, p = .002, 95% CI [.04, .24], d = .46. However, there was no effect of the target’s group membership when the trials depicted innocuous events, F(2, 136) = .246, MSE = .104, p =.783, η2= .004. There was also no main effect of the salience manipulation, F(1, 67) = .246, MSE = .043, p =.622, η2= .004, nor any interaction between the manipulation and any other factor in the model.
With regard to activation of the aMCC, the main effect of the perceived event was qualified by a significant interaction between event and the target’s group
membership, F(2, 136) = 9.35, MSE = .043, p <.001, η2= .12. The aMCC was more active during trials where an ingroup member was depicted experiencing a painful (M = .03, SD = .26) compared to innocuous event (M = -.07, SD = .27), t(68) = 3.63, p < .001, 95% CI [.05, .15], d = .38, or where a Sussex target experienced a painful (M = .09, SD = .35) compared to innocuous event (M = -.06, SD = .23), t(68) = 3.85, p < .001, 95% CI [.07, .23], d = .51. There was no difference in aMCC activity when
Cardiff targets were depicted as experiencing painful (M = -.09, SD = .31), compared to innocuous events (M = -.04, SD = .32), t(68) = -1.66, p = .103, 95% CI [-.13, .01], d = .16. This interaction also qualified a significant main effect of target’s group
membership, F(2, 136) = 4.91, MSE = .041, p =.009, η2= .07. The aMCC was equally active during trials depicting ingroup targets in pain and Sussex targets in pain, t(68) = -2.00, p = .160, 95% CI [-.14, .02], d = .19, but the aMCC was more active in response
Accepted Manuscript
to ingroup targets in pain compared to Cardiff targets in pain, t(68) = 3.28, p = .005, 95% CI [.03, .21], d = .42, or Sussex targets in pain compared to Cardiff targets in pain, t(68) = 4.62, p < .001, 95% CI [.09, .28], d = .54. There was, however, no effect of the target’s group membership when the trials depicted innocuous events, F(2, 136) = .647, MSE = .041, p =.525, η2= .009. There was no main effect of the salience manipulation, F(1, 67) = .748, MSE = .053, p =.390, η2= .011, nor any interaction between the
manipulation and any other factor in the model.
Item-wise analysis. As a purely exploratory investigation, we analysed the
effect that the self-report item had on neural activations. There was a significant
difference in how participants responded to the two self-reported items, F(1, 68) = 4.23, p =.044, η2= .06. Participants reported significantly lower ratings in response to
compassion-based items (i.e. ‘how bad did you feel for the person?’ M = 82.84, SD = 17.47) relative to empathy-based items (i.e. ‘how painful did the event seem for you?’ M = 84.87, SD = 14.18), t(68) = -2.06, p =.044, 95% CI [-3.99, -.06], d = .13.
There were also significant differences in how participants responded to these items at the level of neural activation. There was significantly more activity in the AI, t (68) = 3.88, p < .001, 95% CI [.26, .80], d = .86, and aMCC, t(68) = 2.11, p = .039, 95% CI [.03, 1.21], d = .48, during the response phase of empathy compared to compassion items. On the other hand, the mPFC was significantly more active while participants responded to compassion compared to empathy items, t(68) = 5.52, p < .001, 95% CI [.21, .44], d = .45.
Figure 2. Self-reported group-based evaluations following primes to intergroup rivalry with each of the outgroups (top left panel), activation map for the event*group
Accepted Manuscript
events (middle left panel), mean percentage signal change in the Medial Prefrontal Cortex (middle right panel), the Anterior Insula (bottom left panel), and the Anterior Midcingulate (bottom right panel). The presented maps were thresholded at p <.05, family-wise error rate (FWER) corrected with a cluster-extent based thresholding method with a cluster-defining primary threshold of p < .001.
Table 1. Results from the full factorial analysis of variance.
Discussion
The goal of this study was to demonstrate whether evaluations about outgroups can drive biases in pain empathy. To do this, we used a between groups manipulation to make salient the belief that a particular outgroup was a rival to the ingroup, more so than another outgroup. We then measured self-reports and BOLD responses while participants watched targets from these groups experiencing physical pain.
The results demonstrated that, in spite of the manipulation, participants always rated targets from one outgroup (students from Cardiff University) as more competent, of higher status, and are greater rivals to the ingroup (students from the University of Exeter) than the other outgroup (students from the University of Sussex). We identified a potential issue in our choice of target universities, in that one outgroup (Cardiff) was geographically more proximal to the ingroup than the other. Recent evidence suggests there is a significant relationship between perceived threat and physical proximity (Xiao & Van Bavel, 2012), and this might explain why, in our study, one outgroup was always evaluated as a greater competitive threat than the other.
We also identified that even after stating Sussex was a longstanding rival to the ingroup university, it had no bearing on how students from Sussex were evaluated in terms of perceived competence, status, and rivalry. There are a number of reasons why
Accepted Manuscript
this might be. It may be that our participants were simply too familiar with Sussex and thus were resistant to any information that presented them differently. If participants were already aware of university league tables in the UK (which is often salient information when prospective students make decisions about which universities to apply to) they might have felt a rivalry but were unwilling to admit it, as this would imply a level of comparability between a lower status university and the one they chose.
Another possibility is that, consistent with our notions about Cardiff, Sussex was just not relevant to our participants in terms of their geographical proximity to the ingroup. Sussex is in the south of the UK and so in a sense has a shared background of similarity with Exeter and Cardiff, but it is not a part of the South West in the same way that the other two are. If geographical proximity is an important predictor of threat, this would explain why students from Exeter expressed no feelings of rivalry with the more distant outgroup university. These suggestions are drawn in the absence of direct empirical evidence, but with an eye toward guiding future research in the field of intergroup threat.
While there were no effects of the salience manipulation, we found effects of the target’s group membership on empathy and compassion. At the self-report level,
participants exhibited a bias in favour of the ingroup compared to either of the two outgroups. This emerged for both compassion (i.e. in how bad they felt for the other) and empathy (i.e. in how painful the stimuli appeared to be). At the level of neural activation, however, we found that in line with our hypotheses there were biases in BOLD responses consistent with the specific relations between the target groups. Specifically, during trials depicting pain we observed activity in regions commonly associated with higher-order representations of another’s states (AI). Consistent with
Accepted Manuscript
existing literature, our empathy task recruited activation in the anterior but not posterior portions of insula—the latter of which is more greatly associated with processing the primary aspects of nociceptive signals (i.e. pain; Craig, 2009; Lamm et al., 2011; Lamm & Singer, 2010). As expected, we also observed activation in regions associated with processing the felt unpleasantness of physical pain (ACC; Rainville, Duncan, Price, & Bushnell, 2011; Singer et al., 2004) and those that support mentalizing processes (mPFC; Frith & Frith, 2006).
Crucially, we found that this difference in neural activation only emerged when the target was from the ingroup or from the less competitive outgroup, Sussex. When the target was from the more competitive outgroup, Cardiff, the difference was not only non-significant, it trended in the opposite direction (i.e. regions were marginally less active during painful events compared to innocuous events). Said another way, if the person being stabbed was from a rival outgroup, their experience of pain was not processed to be any more painful than if they appeared to be lightly touched. This is consistent with recent work that found participants exhibited responses associated with sensorimotor resonance following the observation of painful injections, compared to non-painful touches—but, crucially, only when the target was a member of the ethnic ingroup (Riečanský, Paul, Kölble, Stieger, & Lamm, 2015).
While viewing others in pain, participants exhibited less BOLD activity if the other was from Cardiff compared to if they were from the ingroup university or from the other outgroup, Sussex. There was no difference in how participants responded to targets from the ingroup and from Sussex. This reveals that our processing of another’s pain is not simply attenuated to the outgroup when compared to the ingroup. It shows that, instead, empathy and compassion vary according to specific relations between the
Accepted Manuscript
ingroup and outgroup. We identified that this context-specific bias was not apparent in the self-report responses but was clear at the level of neural activation—which is not subject to social desirability. We highlight, however, that our sample size for this study was powered to detect interaction effects at the self-reported level and was not
necessarily powered to detect effects in the fMRI data—this should be considered a limitation of the current study and thus caution should be assumed in the interpretation of our fMRI findings.
These findings are consistent with previous research but also differ in a number of ways. Cikara and Fiske (2011), for example, found that participants exhibit biases in their concern for specific outgroups and that these biases emerged based on how those groups were evaluated by the individual. They also found that participants exhibited a “counter-empathic” response to typically envied targets. That is, activation of the AI went in the opposite direction than expected given the experimental condition. This reflects to a certain extent the findings that we report here—that AI activity was higher when the rival outgroup experienced an innocuous event compared to a painful event. However, what we found was that empathy was not entirely switched off, nor did participants exhibit joy or reward-related neural activity (as other studies have found; Cikara, Bruneau, & Saxe, 2011).
In this study, participants reported feeling some empathy for a rival’s pain and they still exhibited BOLD activity related to empathy, it was merely relatively lower to that reported/exhibited for the ingroup and less competitive outgroup. It is not entirely clear whether this relative difference was due to a dampening of empathy to a rival’s pain (as Cikara and colleagues suggest, 2011) or an extraordinary amount of empathy for the ingroup (as suggested by Mathur, Harada, Lipke, & Chiao, 2010). What is clear,
Accepted Manuscript
however, is that empathy does not simply switch on and off to an ingroup or outgroup’s pain, it waxes and wanes according to our group memberships and more specifically to the relations between those groups.
An important consideration, here, is that rivalry in this context was presented somewhat more indirectly than in those previously tested (e.g. sporting competitions)— related to status positions rather than realistic conflicts (e.g. for resources). It is also important to note that we did not take measures of the participant’s explicit
identification with the ingroup and this makes it impossible to determine how relevant or meaningful the categorization of ‘student at the University of Exeter’ was when participants responded to the task. We derive support, however, from classic Social Identity Theory (Turner, Hogg, Oakes, Reicher, & Wetherell, 1987) which submits that imposing a social categorisation in the absence of other social relations is sufficient to elicit intergroup bias.
In addition to the main analyses, we ran an item-wise analysis to delineate whether the type of self-reported item was supported by activation of distinct brain regions. We found dissociation between regional activations and self-reports: Whereas empathy recruited more activity in regions associated with experience-sharing (aMCC and AI), compassion recruited more activity in regions associated with understanding other’s mental states (i.e. mentalizing; mPFC). Kanske and colleagues (2016) support such a distinction, describing experience-sharing as broadly ‘feeling with’ another (what we designate as self-focused) (de Vignemont & Singer, 2006), compared to compassion as ‘feeling for’ another (other-focused) (C. D. Batson et al., 1987). This also supports previous work demonstrating that different facets of empathy and processes closely resembling it rely upon distinct neural architecture in the brain (Kanske et al., 2016;
Accepted Manuscript
Lamm et al., 2011; Lamm, Rütgen, & Wagner, 2017; Ochsner et al., 2008; Zaki, Ochsner, Hanelin, Wager, & Mackey, 2007). Taken together, these analyses suggest that our task engaged the affect-sharing components of empathy as well as the more other-focused, compassion. These results also advocate for researchers to pay particular attention to what they ask participants at the self-report level—doing so has important implications for how participants respond.
In sum, we believe this study confirms some of what we already knew about empathy—that it is often reserved for “us” and attenuated to “them”. This study also supports a recently converging notion that empathy is not always determined by “us” and “them” but rather by whom we refer to by “them”. What we show is that group-based evaluations can influence processing of what is an otherwise unambiguously negative event (i.e. physical pain). More broadly, this study provides further evidence that contextual cues (such as social identity) can trigger expectations (such as a particular group is a competitor) that, in turn, can exert a top-down influence on ostensibly automatic perceptual processing (such as pain perception; Decety & Lamm, 2006; Zaki & Ochsner, 2012).
Indeed, social identity processes can penetrate automatic processing at the earliest components of perception (Ratner & Amodio, 2013). And in the context of pain, this can have potentially disastrous consequences for certain groups in society. For example, researchers have identified that individuals from racial minority groups typically receive less pain relief treatment than white individuals in emergency room settings (Pletcher, Kertesz, Kohn, & Gonzales, 2008). This appears to be tied to the inaccurate beliefs that medical practitioners have over the biological differences between whites and racial minorities (Hoffman, Trawalter, Axt, & Oliver, 2016).
Accepted Manuscript
Although a thorough discussion of this is beyond the scope of the current research, our results point toward a growing body of work that suggests even seemingly automatic or bottom-up neural processes are modulated by top-down motivational goals.
References
Avenanti, A., Sirigu, A., & Aglioti, S. M. (2010). Racial bias reduces empathic sensorimotor resonance with other-race pain. Current Biology, 20, 1018–1022. Batson, C. D., Fultz, J., & Schoenrade, P. A. (1987). Distress and empathy: Two
qualitatively distinct vicarious emotions with different motivational consequences.
Journal of Personality, 55, 19–39.
Beckmann, C. F., Jenkinson, M., & Smith, S. M. (2003). General multilevel linear modeling for group analysis in FMRI. NeuroImage, 20, 1052–1063.
Chang, L., Krosch, A. R., & Cikara, M. (2016). Effects of intergroup threat on mind, brain, and behavior. Current Opinion in Psychology, 11, 69–73.
Cikara, M., Botvinick, M., & Fiske, S. T. (2011). Us versus them: Social identity shapes neural responses to intergroup competition and harm. Psychological Science, 22, 306–313.
Cikara, M., Bruneau, E. G., & Saxe, R. R. (2011). Us and them: Intergroup failures of empathy. Current Directions in Psychological Science, 20, 149–153.
Cikara, M., Bruneau, E., Van Bavel, J. J., & Saxe, R. (2014). Their pain gives us pleasure: How intergroup dynamics shape empathic failures and counter-empathic responses. Journal of Experimental Social Psychology, 55, 110–125.
Cikara, M., & Fiske, S. T. (2011). Bounded empathy: Neural responses to outgroup targets’ (mis)fortunes. Journal of Cognitive Neuroscience, 23, 3791–3803.
Accepted Manuscript
Nature Reviews Neuroscience, 10, 59–70.
CUG. (2016). University Subject Tables 2016. Retrieved July 26, 2017, from
https://www.thecompleteuniversityguide.co.uk/league-tables/rankings/?y=2016 de Vignemont, F., & Singer, T. (2006). The empathic brain: How, when and why?
Trends in Cognitive Sciences, 10, 435–441.
Decety, J., & Lamm, C. (2006). Human empathy through the lens of social neuroscience. The Scientific World, 6, 1146–1163.
Eklund, A., Nichols, T. E., & Knutsson, H. (2016). Cluster failure: Why fMRI
inferences for spatial extent have inflated false-positive rates. Proceedings of the
National Academy of Sciences, 113, 7900–7905.
Feng, C., Li, Z., Feng, X., Wang, L., Tian, T., & Luo, Y. J. (2016). Social hierarchy modulates neural responses of empathy for pain. Social Cognitive and Affective
Neuroscience, 11, 485–495.
Friston, K., Zarahn, E., Josephs, O., Henson, R. N., & Dale, A. M. (1999). Stochastic designs in event-related fMRI. NeuroImage, 10, 607–619.
Hein, G., Silani, G., Preuschoff, K., Batson, C. D., & Singer, T. (2010). Neural responses to ingroup and outgroup members’ suffering predict individual differences in costly helping. Neuron, 68, 149–160.
Hoffman, K. M., Trawalter, S., Axt, J. R., & Oliver, M. N. (2016). Racial bias in pain assessment and treatment recommendations, and false beliefs about biological differences between blacks and whites. Proceedings of the National Academy of
Sciences, 113, 201516047.
Jenkinson, M., & Smith, S. (2001). A global optimisation method for robust affine registration of brain images. Medical Image Analysis, 5, 143–56.
Accepted Manuscript
robust and accurate linear registration and motion correction of brain images.
NeuroImage, 17, 825–841.
Kanske, P., Böckler, A., Trautwein, F.-M., Lesemann, F. H. P., & Singer, T. (2016). Are strong empathizers better mentalizers? Evidence for independence and interaction between the routes of social cognition. Social Cognitive and Affective
Neuroscience, 9, 1–10.
Lamm, C., Decety, J., & Singer, T. (2011). Meta-analytic evidence for common and distinct neural networks associated with directly experienced pain and empathy for pain. NeuroImage, 54, 2492–2502.
Lamm, C., Rütgen, M., & Wagner, I. C. (2017). Imaging empathy and prosocial emotions. Neuroscience Letters. doi:10.1016/j.neulet.2017.06.054
Lamm, C., & Singer, T. (2010). The role of anterior insular cortex in social emotions.
Brain Structure and Function, 214, 579–591.
Leach, C. W., Spears, R., Branscombe, N. R., & Doosje, B. (2003). Malicious pleasure: Schadenfreude at the suffering of another group. Journal of Personality and Social
Psychology, 84, 932–943.
Mai, J. K., Voss, T., & Paxinos, G. (2008). Atlas of the human brain. Elsevier/Academic Press.
Mathur, V. A., Harada, T., Lipke, T., & Chiao, J. Y. (2010). Neural basis of
extraordinary empathy and altruistic motivation. NeuroImage, 51, 1468–1475. Molenberghs, P., Bosworth, R., Nott, Z., Louis, W. R., Smith, J. R., Amiot, C. E., …
Decety, J. (2014). The influence of group membership and individual differences in psychopathy and perspective taking on neural responses when punishing and rewarding others. Human Brain Mapping, 35, 4989–4999.
Accepted Manuscript
painful actions: The sensorimotor integration of pain and action information.
Human Brain Mapping, 34, 1982–1998.
Ochsner, K. N., Zaki, J., Hanelin, J., Ludlow, D. H., Knierim, K., Ramachandran, T., … Mackey, S. C. (2008). Your pain or mine? Common and distinct neural systems supporting the perception of pain in self and other. Social Cognitive and Affective
Neuroscience, 3, 144–160.
Peyron, R., Laurent, B., & García-Larrea, L. (2000). Functional imaging of brain responses to pain. A review and meta-analysis (2000). Clinical Neurophysiology,
30, 263–288.
Pletcher, M. J., Kertesz, S. G., Kohn, M. A., & Gonzales, R. (2008). Trends in Opioid prescribing by race / ethnicity for patients seeking care in us emergency. Journal of
the American Medical Association, 299, 70–78.
Rainville, P., Duncan, G. H., Price, D. D., & Bushnell, M. C. (2011). Pain affect encoded in human anterior cingulate but not somatosensory cortex pain affect encoded in human anterior cingulate but not somatosensory cortex. Science, 968, 968–971.
Ratner, K. G., & Amodio, D. M. (2013). Seeing “us vs. them”: Minimal group effects on the neural encoding of faces. Journal of Experimental Social Psychology, 49, 298–301.
Riečanský, I., Paul, N., Kölble, S., Stieger, S., & Lamm, C. (2015). Beta oscillations reveal ethnicity ingroup bias in sensorimotor resonance to pain of others. Social
Cognitive and Affective Neuroscience, 10, 893–901.
Singer, T., Seymour, B., Doherty, J. O., Kaube, H., Dolan, R. J., & Frith, C. D. (2004). Empathy for pain involves the affective but not sensory components of pain.
Accepted Manuscript
Smith, S. M. (2002). Fast robust automated brain extraction. Human Brain Mapping,
17, 143–155.
Stürmer, S., Snyder, M., & Omoto, A. M. (2005). Prosocial emotions and helping: The moderating role of group membership. Journal of Personality and Social
Psychology, 88, 532–546.
Tarrant, M., Dazeley, S., & Cottom, T. (2009). Social categorization and empathy for outgroup members. The British Journal of Social Psychology, 48, 427–446. Turner, J. C., Hogg, M. A., Oakes, P. J., Reicher, S. D., & Wetherell, M. S. (1987).
Rediscovering the social group: A self-categorization theory. Basil Blackwell.
Retrieved from http://psycnet.apa.org/psycinfo/1987-98657-000
Woolrich, M. W., Behrens, T. E. J., Beckmann, C. F., Jenkinson, M., & Smith, S. M. (2004). Multilevel linear modelling for FMRI group analysis using Bayesian inference. NeuroImage, 21, 1732–1747.
Woolrich, M. W., Ripley, B. D., Brady, M., & Smith, S. M. (2001). Temporal Autocorrelation in Univariate Linear Modeling of FMRI Data. NeuroImage, 14, 1370–1386.
World Medical Association. (2013). World medical association declaration of Helsinki ethical principles for medical research involving human subjects. JAMA, 310, 2191.
Xiao, Y. J., & Van Bavel, J. J. (2012). See your friends close and your enemies closer: Social identity and identity threat shape the representation of physical distance.
Personality and Social Psychology Bulletin, 38, 959–972.
Xu, X., Zuo, X., Wang, X., & Han, S. (2009). Do you feel my pain? Racial group membership modulates empathic neural responses. Journal of Neuroscience, 29, 8525–8529.
Accepted Manuscript
Zaki, J., & Ochsner, K. N. (2012). The neuroscience of empathy: Progress, pitfalls and promise. Nature Neuroscience, 15, 675–80.
Zaki, J., Ochsner, K. N., Hanelin, J., Wager, T. D., & Mackey, S. C. (2007). Different circuits for different pain: patterns of functional connectivity reveal distinct networks for processing pain in self and others. Social Neuroscience, 2, 276–291.
Accepted Manuscript
Figure 1. (A) Trial structure; (B) Example of the four possible events from the combination of the object types (painful and innocuous) and the target group membership (ingroup and outgroup); (C) Object stimuli depicted as causing either painful or innocuous stimulations to the target.
Figure 2. Self-reported group-based evaluations following primes to intergroup rivalry with each of the outgroups (top left panel), activation map for the event*group
interaction (top right panel), self-reported empathy in response to painful vs. innocuous events (middle left panel), mean percentage signal change in the Medial Prefrontal Cortex (middle right panel), the Anterior Insula (bottom left panel), and the Anterior Midcingulate (bottom right panel). The presented maps were thresholded at p <.05, family-wise error rate (FWER) corrected with a cluster-extent based thresholding method with a cluster-defining primary threshold of p < .001.
Accepted Manuscript
Table 1. Results from the full factorial ANOVA.
Region Side Extent Z MNI
(k) (peak) X Y Z
a) Main effect Perceived Event: Painful > Neutral
Fusiform gyrus R 3437 5.56 48 -74 2
Medial prefrontal cortex L 2678 5.49 0 56 26
Fusiform gyrus L 2287 5.77 -44 -56 -18
Inferior frontal gyrus L 1768 4.69 -52 18 -12
Anterior insula R 1237 4.96 43 24 -2
Precuneus L 207 4.79 -2 -62 32
Medial temporal gyrus R 198 4.70 60 -10 -14
Superior parietal lobule L 151 4.19 -40 -68 36
Anterior midcingulate R 79 4.13 2 10 40
Caudate nucleus L 72 3.84 -14 -26 18
Orbitofrontal cortex L 32 4.01 -20 20 -16
Posterior cingulate L 29 3.66 0 -50 20
Primary motor cortex L 29 3.75 -40 12 52
Posterior parietal R 28 4.63 30 -54 34 Cerebellum R 14 3.73 20 -60 -30 Dorsolateral prefrontal L 12 3.54 -38 48 2 Thalamus L 11 3.60 0 -8 12 Lateral prefrontal L 10 3.37 -44 48 -4 Temporal pole L 10 3.61 -38 24 -32
b) Main effect Target Group: Exeter > Cardiff + Sussex > Cardiff
Medial prefrontal cortex R 4143 5.40 22 62 18
Superior temporal gyrus R 544 4.79 56 -10 -20
Temporo-parietal junction R 380 4.23 58 -50 16
Cerebellum L 288 4.73 -36 -74 -32
Cerebellum R 179 4.63 42 -62 -34
Posterior superior temporal sulcus R 124 4.59 66 -50 -2
Supplementary motor area L 121 4.33 -4 8 68
Orbitofrontal cortex L 115 4.25 -30 54 -12
Inferior frontal gyrus L 86 4.48 -56 16 24
Anterior insula R 66 4.17 36 18 -10
Medial prefrontal cortex L 44 3.68 -10 66 -6
Superior temporal gyrus L 43 3.69 -54 -54 16
Dorsolateral prefrontal cortex L 29 3.92 -32 46 26
Accepted Manuscript
Ventral prefrontal cortex R 26 3.96 20 60 -16
Extrastriate body area L 24 3.43 -56 -72 6
Anterior insula L 20 3.58 -46 0 -10 Lingual gyrus L 18 3.72 0 -50 2 Thalamus L 15 3.47 -10 -20 20 Posterior insula R 15 3.70 36 -32 10 Intraparietal sulcus R 14 3.29 48 -42 52 Anterior cingulate R 14 3.79 2 28 20 Anterior midcingulate L 14 3.51 0 16 46 Premotor cortex L 13 3.59 -30 -2 44 Orbitofrontal cortex L 13 3.36 -32 20 -8
Fusiform face area R 11 3.76 46 -64 -8
Fusiform gyrus L 10 3.48 -68 -30 -8
c) Interaction: Perceived Event * Target Group [(EP>EN + CN>CP) + (SP>SN + CN>CP)]
Medial prefrontal cortex L 1167 4.75 0 40 36
Extrastriate cortex L 860 4.34 -52 -72 2
Inferior frontal gyrus L 576 4.79 -54 16 28
Inferior frontal gyrus R 553 4.71 58 20 22
Superior temporal gyrus R 306 4.21 48 -28 -4
Orbitofrontal cortex R 145 3.81 50 38 -12
Occipito-temporal cortex R 122 4.45 50 -64 -6
Temporo-parietal cortex R 121 3.86 50 -68 16
Posterior insula L 111 4.32 -38 -30 14
Fusiform face area L 109 4.26 -42 -48 -20
Posterior cerebellum L 104 4.11 -10 -88 -24
Intraparietal sulcus R 102 4.74 40 -48 54
Secondary somatosensory cortex L 98 4.29 -52 -38 26
Primary somatosensory cortex R 90 4.02 66 -18 26
Thalamus L 79 4.47 -4 -12 16
Primary motor cortex L 73 4.12 -50 -22 32
Precuneus L 70 3.85 0 -54 48
Superior temporal gyrus L 64 3.74 -62 -10 0
Prefrontal cortex R 62 3.54 34 58 0
Fusiform face area R 56 3.92 48 -42 -20
Primary motor cortex R 53 3.80 50 -22 34
Frontal pole R 53 4.20 26 68 4
Anterior insula L 53 3.57 -40 6 -12
Medial prefrontal cortex L 45 4.17 0 48 0
Superior parietal cortex L 45 3.85 -44 -44 50
Medial temporal gyrus L 38 3.61 -36 -24 -24
Accepted Manuscript
Premotor cortex L 36 4.04 -26 16 56 Occipital cortex L 33 3.74 -32 -98 -8 Amygdala R 33 3.82 28 -10 -18 Hypothalamus L 33 3.85 0 -2 -16 Temporal pole R 31 3.92 46 12 -16 Fusiform gyrus L 30 3.74 -30 -40 -24Ventromedial prefrontal cortex L 30 3.87 0 56 -12
Posterior superior temporal sulcus R 29 3.77 62 -40 -4
Middle temporal gyrus L 27 3.89 -58 -30 -14
Posterior cingulate L 25 3.75 -8 -44 38
Fusiform gyrus L 24 3.62 -22 -88 -12
Lateral occipital cortex L 22 3.68 -38 -84 12
Basal ganglia L 21 3.49 -18 0 6
Parietal lobule R 19 3.70 44 -30 28
Cerebellum L 19 3.70 -40 -78 -30
Dorsolateral prefrontal cortex L 19 3.33 -26 36 34
Supramarginal gyrus R 17 3.72 58 -48 30
Occipital cortex R 11 3.52 42 -72 0
Posterior cingulate R 11 3.50 8 -42 28
Ventral premotor cortex L 11 3.45 -64 -2 24
Caudate nucleus L 10 3.56 -12 26 0
Parietal lobule L 10 3.34 -54 -32 46
Anterior cingulate R 10 3.56 16 44 16
Anterior cingulate L 10 3.32 0 34 12
d) Main-effect Other-focussed > Self-focussed
Medial prefrontal cortex L 6628 5.79 -2 56 26
Precunues R 1639 5.39 2 -66 32
Dorsolateral prefrontal cortex L 1249 4.86 -46 26 36
Temporo-parietal junction R 986 4.90 48 -60 26
Temporo-parietal junction L 577 4.80 -54 -68 28
Temporal pole R 508 5.07 54 12 -32
Middle temporal gyrus L 447 5.06 -62 -16 -14
Caudate nucleus L 295 4.59 -8 6 10
Anterior superior temporal gyrus R 215 4.54 60 -12 -12
Frontal pole L 78 4.06 -32 62 2 Anterior insula R 75 3.70 58 26 6 Cerebellum R 61 3.97 10 -56 -38 Cerebellum L 41 4.08 -38 -68 -30 Orbitofrontal cortex L 39 3.99 -28 24 -20 Thalamus L 38 3.80 -4 -16 6
Accepted Manuscript
Premotor cortex L 26 3.63 -48 8 38
Supplementary motor area L 21 3.68 -4 0 50
Premotor cortex R 18 3.83 64 8 16
Brainstem R 15 3.72 4 -24 -26
Primary sensorimotor cortex L 14 3.70 -2 -34 60
Intraparietal sulcus R 12 3.77 32 -42 38
Intraparietal sulcus L 10 3.62 -34 -44 42
Note: The presented activations were thresholded at p < .05, family-wise error rate (FWER) corrected with a cluster-extent based thresholding method with a cluster-defining primary threshold, p < .001. A minimum voxel-level threshold of 10 mm was applied to all contrasts.
Accepted Manuscript
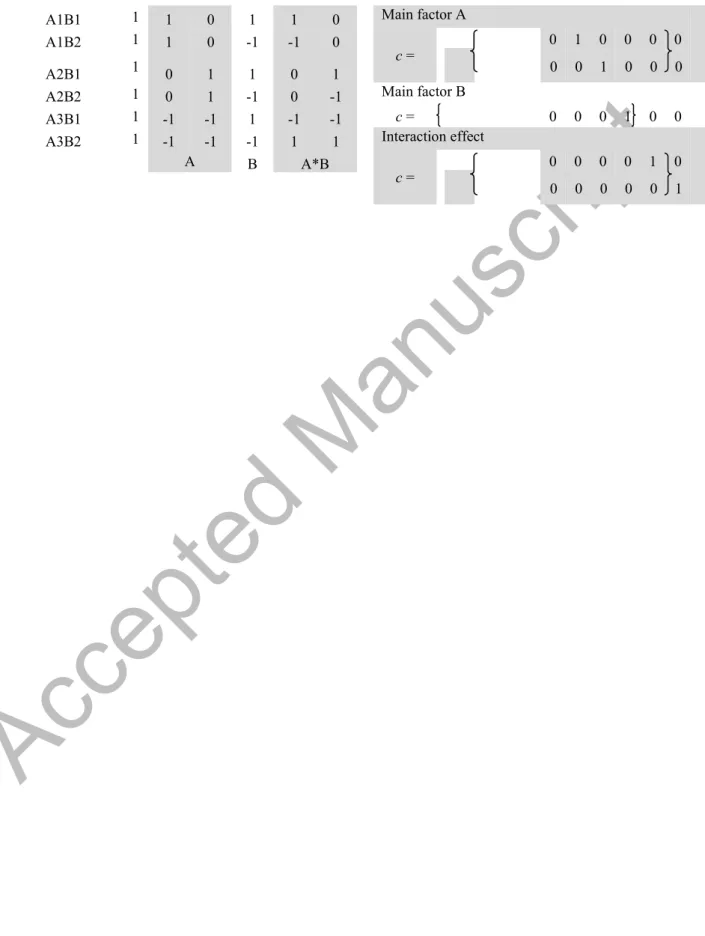
Table S1. Design matrices for the fMRI GLM higher analysis. The contrasts denote the main effects for Target Group (A) and Perceived Event (B) as well the interaction effects (A*B).
A1B1 1 1 0 1 1 0 Main factor A
A1B2 1 1 0 -1 -1 0 c = 0 1 0 0 0 0 A2B1 1 0 1 1 0 1 0 0 1 0 0 0
A2B2 1 0 1 -1 0 -1 Main factor B
A3B1 1 -1 -1 1 -1 -1 c = 0 0 0 1 0 0
A3B2 1 -1 -1 -1 1 1 Interaction effect
A B A*B c = 0 0 0 0 1 0 0 0 0 0 0 1
Accepted Manuscript
Table S2. Results from the pilot study showing mean ratings of empathy in response to the outgroups following priming to intergroup rivalry
Sussex Cardiff Sussex Cardiff
Rivalry No Rivalry
82.19a (17.34) 75.64b (10.98) 77.18a (21.09) 86.33a (10.67)
Note: N = 64. The rating scale ranged from 1 (not at all) to 100 (very much so). Standard deviations are given in parentheses. Within a row,
Accepted Manuscript
Supplementary Materials
Self-report ratings. Participants evaluated the target groups on a range of
measures associated with intergroup relations using 7 point Likert scales (1 = Not at all to 7 = Very much). The measures included perceived group competence (3 items, all alphas > .80; to what extent do you think that students of the University of Exeter are
generally perceived as [competent/capable/intelligent] within British society?),
sociability (3 items, all alphas > .80; adapted from Fiske, Cuddy, Glick, & Xu, 2002; to
what extent do you think that students of the University of Exeter are generally perceived as [warm/friendly/trustworthy] within British society?), status (4 items, all
alphas > .90; to what extent do you think that Exeter [University is/students are]
[prestigious/high status]?), rivalry (2 items, all alphas > .80, adapted from Doosje,
Ellemers, & Spears, 1995; to what extent do you see Cardiff students as
[rivals/competitors] to students from the University of Exeter?), and similarity (2 items,
all alphas > .80, adapted from Simon, 1992; to what extent do you think that students at
Cardiff University are [similar/comparable] to students from the University of Exeter?)
All items were completed by reference to all of the groups, so participants completed these five times, with the exception of perceived similarity and rivalry—these items were only asked with reference to the outgroups since they were always asked in relation to the ingroup.
Salience manipulation. To manipulate the salience of the perceived rivalry
between the ingroup and the two outgroups, participants were given a bogus news article to read. The content of this article can be seen below. Note that this version of the article presents Cardiff as the salient rival but in the other version the content is identical with the exception that Cardiff and Sussex switch places.
Accepted Manuscript
“The University of Exeter is now ranked 93rd in the Times Higher Education World University Rankings, placing it among the very best institutions across the globe. The new ranking marks a
significant rise for the University, having leapt from 154th last year. With this, Exeter may yet
reclaim pole position as the top university in the South of the UK—for that, however, we still need to overtake our longstanding rival university, Cardiff. There are currently 3 top universities in the South: Exeter, Cardiff, and Sussex, all of which are well-known for a high level of graduate training and academic prowess. It is Cardiff University, however, that we consistently meet in both academic and sporting conflicts: Over the past years Exeter have met Cardiff on the battlefield matching victory with defeat, leaving no clear overall victor. Both universities are members of the prestigious Russell Group and, as such, offer their graduates the best
opportunities for employment. Recent records indicate that graduates of Cardiff, however, are currently far more likely to be employed within 6 months of graduating and earn a salary that is, on average, £4k more than graduates from Exeter or Sussex. As we rise in the world’s rankings, perhaps our latest graduates can begin to close the gap, but there’s work to do. Professor Sir Steve Smith, Vice-Chancellor of the University of Exeter, had this to say: ‘Please don’t think that our job is done. Our goal is long term sustainable achievement. Let’s make our next goal to be the best in the South.’ With this new accolade, we ask the students of Exeter: Can we beat Cardiff and reclaim our crown?”
Results
Competence and sociability. A mixed measures analysis of variance (ANOVA)
revealed a significant effect of target identity on perceived group competence, F(2, 134) = 39.82, MSE = .385, p <.001, η2 = .37. Participants rated students from the ingroup as significantly more competent (M = 5.93, SD = .73) than students at Cardiff (M = 5.40, SD = .94), t(68) = 6.19, p <.001, 95% CI [.32, .75], d = .63, and students at Sussex (M = 4.99, SD = 1.07), t(68) = 8.87, p <.001, 95% CI [.68, 1.19], d = 1.03. Participants also perceived students at Sussex to be less competent than students from Cardiff, t(68) = -3.32, p =.005, 95% CI [-.70, -.10], d = .41. There was no overall main effect of the