International Journal of General Medicine
Gastrointestinal morphological alterations
in obese rats kept under hypercaloric diets
Raphael Castiglioni Nascimento
Haryanne Mabel Bruna Nunes Queiroz Roberta Paresque
Departamento de Ciências da Saúde, Centro Universitário Norte do Espírito Santo, São Mateus, ES, Brazil
Correspondence: Roberta Paresque Departamento de Ciências da Saúde, Centro Universitário Norte do Espírito Santo, Universidade Federal do Espírito Santo, BR 101 Norte, Km 60, CEP 29932-540, São Mateus, ES, Brazil Tel +55 27 3312 1558
Email rparesque@gmail.com
Abstract: Hypercaloric diets have been successfully used as experimental models of obesity. This work compared morphological characteristics of inferior gastrointestinal organs. The experiment lasted 10 weeks, during which the rats’ food consumption, body weight, distance between the mouth and neck, distance between mouth and neck, distance between neck and tail, and abdominal circumference were evaluated weekly. After the sacrifice of the rats, 20 variables referring to inferior gastrointestinal morphology were assessed. The results comprised descriptive statistics of the data, analysis of main components, linear correlation, and t-tests. Significant differences were found between the two groups for the variables of abdominal circumference, retroperitoneal fat, ratio between retroperitoneal fat/animal weight, stomach weight, ratio between animal weight/intestine weight and mesentery/animal weight, length of small intestine, length of large intestine, and lateral line of the cecum. The data allow us to state that a hypercaloric diet can be responsible an increase in fat in the abdominal cavity as well as gastrointestinal morphological alterations, principally in stomach development.
Keywords: gastrointestinal morphology; hypercaloric diet; diet-induced obesity
Introduction
Several studies have discussed the effects of high dietary fat on intra-abdominal adiposity and its relationship to obesity and chronic non-transmitted disease.1–5
Experiments using hypercaloric or hyperlipidic diets were successfully applied to reproduce experimental models of obesity,6–11 eg, rats under a high fat diet showed
increased quantities of retroperitoneal (RET) and epididimal (EPI) adipose tissue with tendencies to adipose profile disturbances from 3 weeks on, and also a large increase in corporal weight, which promoted obesity.4,12
Lerario et al1 demonstrated the role of these diets in increasing adipose tissue
stocks in experimental animals and noticed that individuals with greater adiposity also presented higher rates of triglycerides and total cholesterol and lower rates of HDL, risk factors common to obese individuals. Excessive fat consumption was also related to the develop of dyslipidemias in the Zambon et al,5 study which showed increases in
serum concentrations of triglycerides, total cholesterol, and HDL.
In addition, Eguchi et al13 observed a large increase in intake of calories in a
sedentary group fed a high fat diet compared to a sedentary group on a standard caloric diet, thus finding alterations in feeding consumption, body constitution, and concentration of leptin and ghrelin in those fed a high fat diet.
However, results on insulin alterations are conflicting. Some investigations have found that the high-fat diet can increase insulin levels,14–17 whereas others showed
Dove
press
O R I G I N A L R E S E A R C H open access to scientific and medical research Open Access Full Text Article
International Journal of General Medicine downloaded from https://www.dovepress.com/ by 170.83.213.75 on 15-Sep-2020
For personal use only.
Number of times this article has been viewed
This article was published in the following Dove Press journal: International Journal of General Medicine
no difference.3,18 In regards to glycemia, a few studies
have reported a significant increase in this biochemical parameter.15–19
Despite several studies portraying the effects of a hypercaloric diet on organisms, none has assessed possible changes in the microscopic anatomy of the inferior gastrointestinal tract as a whole. Only Duarte et al12 reported
a high fat diet didn’t alter relative pancreas weight, though they registered a tendency toward reduced organ weight. Thus, the aim of this study was to test if there is a relationship between obesity and possible morphological alterations in the inferior TGI.
Materials and methods
This study was done as experimental applied research. An extractive proportional sample was used due to the establishment of two categories: a group receiving a hypercaloric diet and another receiving a standard diet. The data collection was the type of directly documented laboratory research possible in indoor experiments. Data were classified in a quantitative way.21
This project was approved by the ethics committee on the use of animals of Universidade Federal do Espírito Santo (CEUA-UFES), according to Law 11.794, October 8, 2008, under protocol number 031/2010.
Sample design
Twenty-four 22-day-old male Wistar rats (Rattus norvegicus
albinus) were used. The animals were divided into two even
groups taking a hypercaloric diet (n = 12) (group H) or a standard diet (n = 12) (control group) for 10 weeks. During the experimental period, the animals were kept in individual cages at ambient temperature with a light–dark photoperiod of 12 hours (natural light), with free access to water and food.
The control group rats were fed normal caloric commercial diets for rats (Nuvilab, Jundiai, São Paulo, Brazil) with the following content per 100 g of weight: 19.0% protein, 56.0% carbohydrates, 3.5% lipids, 4.5% cellulose, and 5.0% vitamins and minerals for a total of 17.03 kJ/g. The group H diet consisted of a hypercaloric mixture of 15 g of normocaloric Nuvilab (10 g toasted peanuts, 10 g milk chocolate, and 5 g starch cookie)3 per 100 g of weight: 20.0%
protein, 48.0% carbohydrates, 20.0% lipids, 4.0% cellulose, and 5.0% vitamins and minerals for a total energetic content of 21.40 kJ/g.
Five variables were evaluated weekly: food consumption (difference between the offered fraction and the remainder),
corporeal weight, distance between mouth and neck, distance from neck to tail, and abdominal circumference.
The animals were weighed on an analytical scale (Intell Lab™ PD-3000) with 0.1 g precision. The measurements were obtained using an inelastic metric tape, taking the muzzle as cranial reference. The formula to analyze corporeal mass gain was final mass minus initial mass in grams. The weekly measurements occurred at the same time of the day and were taken by the same crew of trained researchers. After 10 weeks, the animals were sacrificed by dislocation of the cervical spine, according to the ethical principles for experimental animals adopted by the Brazilian Collegiate of Experimental Animals.
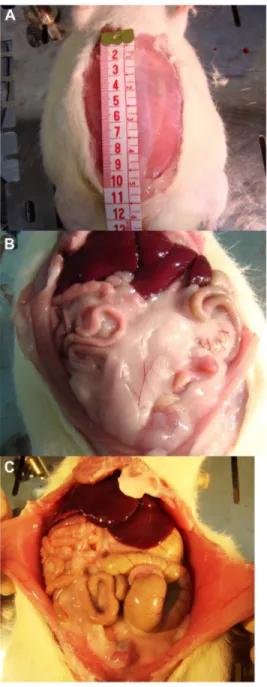
Immediately after death, all the animals were weighed and measured (Figure 1). A surgical incision in the abdominal cavity was performed to compare the topographic localization of organs.
The following organs were collected, analyzed, weighed, and photographed: stomach, small and large intestines, and liver. The stomach was emptied before being weighed. In sequence, the organs were placed on millimeter paper, where traces were taken for posterior morphometric analysis (Figure 2). The white adipose retroperitoneal tissue was also weighed and discharged.
As a whole, 16 gastrointestinal reference variables were considered: ratio of retroperitoneal fat/animal weight, ratio of stomach weight/animal weight, ratio of liver weight/animal weight, ratio of intestines plus mesentery weight/animal weight, related to intestines plus mesentery weight/animal weight, length of small and large intestines, length of bottom of the stomach, length of small and large curvature of the stomach, length of the body of the stomach and the lateral lines of the cecum: C1, C2, C3, C4, C5, and C6.
The ratios were recorded in individual files and tabulated using Excel 2007 software (Microsoft, Redmond, WA, USA). For statistical analyses of data, SPSS 8.0 software (IBM, Armonk, NY, USA) was used. Descriptive statistics of all variables were obtained prior to and after death.
To test the null hypothesis (no morphological differences, gastrointestinal tract inferior in both groups), a t-test was used with P , 0.05 considered significant. In addition, analyses of the main components were done to detect which variables were significant for group discrimination, as well as linear correlations of Pearson’s coefficient for stomach, intestine, and cecum variables in order to detect possible differences in organ development in each group.
Dovepress
Nascimento et al
International Journal of General Medicine downloaded from https://www.dovepress.com/ by 170.83.213.75 on 15-Sep-2020
Results
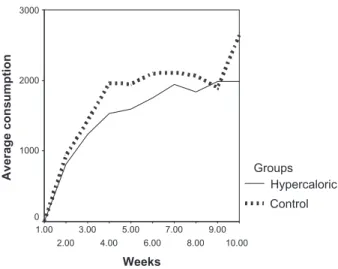
A regular crescent shaped increase in the volume of food consumed weekly by the analyzed groups was observed (Figure 3). It was noticed that the control group consumed more during the experimental period; the maximum measured values for the observed variables in the stomach were also from the control group. However, the lowest values for stomach weight, length of stomach bottom, smaller curvature, and length of the stomach body were all noted in animals in the hypercaloric group. However, t-tests showed significant differences only in stomach weight between the two groups (Table 1).
Concerning liver weight, the hypercaloric group presented the largest average value as well as the highest maximum value for the organ weight. However, t-tests did not show significant difference in the variables researched between the two groups (Table 1).
The animals from the hypercaloric group presented less developed small and large intestines (Table 1). The control group presented higher maximum, average, and least values for weight of intestines and mesentery, and length of small and large intestines when compared to the hypercaloric group.
t-tests showed that there were significant differences in three
out of four variables: ratio of intestine and mesentery weight/ animal weight, and lengthes of small and large intestines (Table 1).
Analyzing the cecum, it was observed that for the measured morphometric variables in this organ (C1, C2, C3, C4, C5, and C6), the control group presented the highest average values, which confirms that in the hypercaloric group inferior gastrointestinal organs presented a lower degree of volumetric development (Table 1). t-test showed significant differences for variables C2, C3, and C4 between the two groups (Table 1).
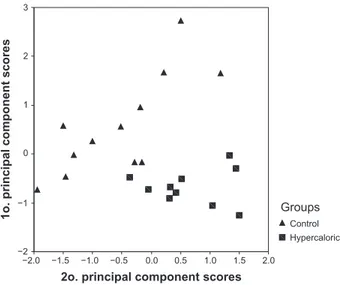
In the main component analyses, there was no assumption from the groups established by the a priori diets, which permitted greater exploitation of the degree of homogeneity within and between the groups, and yet a clear pattern of separation among individuals was observed, making it possible to observe the well-delimited segregation of both groups (Figure 4).
The correlation patterns in the control group were high for the stomach and cecum measurements, suggesting a shared pattern for the development of these organs. Significant results (P , 0.05) were obtained for the correlation matrices (Tables 2 and 3).
The lowest correlation values were between the lateral cecum measures belonging to the large intestine, where the correlation values were not significant (Table 4). The mesentery fold from intestines of the hypercaloric group had excessive fat accumulation, mainly in the central area and around the blood vessels that nourish the intestines, compared to the mesentery of control group animals (Figure 5). In the control group mesentery, it was possible to observe the border from the fold to the capillary net that extends to the intestines (Figure 5).
Stomachs from the hypercaloric group were of a smaller size with greater wrinkling in the walls were observed (91.6%, n = 12) compared to control group animals (Figure 5). At the
Figure 1 Surgical incision in abdominal cavity (A), and evaluation of abdominal
cavities in the hypercaloric group (B) and control group (C).
Dovepress Gastrointestinal changes in hypercaloric rats
International Journal of General Medicine downloaded from https://www.dovepress.com/ by 170.83.213.75 on 15-Sep-2020
same time, it was observed that the stomachs of the control group animals were less deformed.
Concerning the retroperitoneal stock of fat it was observed that the volume presented was notably larger in animals from the hypercaloric group compared to the control group (Figure 5). The fat completely filled the rear of the abdominal cavity completely and partially blanketed the kidneys, which are retroperitoneal organs. The genital and urinary organs also suffered dislocation due to the fat stock, and were displaced lower in the pubic area.
Bottom body
Stomach
Length large intestine
Length small intestine
Figure 2 Layout for obtaining the variables: in the stomach, the greater curvature, lesser curvature, body, and bottom are identified; in the large intestine, identifies the length
and cecum portions (C1, C2, C3, C4, C5 and C6) are identified; and in the small intestine the length is identified.
10.00 9.00 8.00 7.00 6.00 5.00 4.00 3.00 2.00 1.00 3000 2000 1000 0 Weeks
Average consumption Groups
Hypercaloric Control
Figure 3 Graphical comparison of average food consumption between the control
and hypercaloric groups.
It was possible to better visualize the abdominal aortic artery, the right kidney artery, the spinal muscles and seminal vesicles in the upper abdominal cavity of control group animals (Figure 5), due to less retroperitoneal fat deposition.
Comparisons of morphometric variables
The rats fed the hypercaloric diet showed a greater volume of accumulated fat in the retroperitoneal region. The difference between the highest maximum and minimum values of retroperitoneal fat accumulation in the control and hypercaloric groups reached 20.09 g and 7.32 g, respectively (Table 1). This difference was also seen in the highest average ratios between retroperitoneal fat/animal weight. Statistical testing confirmed the differences were significant for these two variables between the two groups (Table 1).
As for the stomach, the highest average values of organ weight, length of the stomach bottom, length of the larger curvature of the stomach, and length of the stomach body were all presented by the control group animals (Table 1). This result shows that this organ was less developed in animals in the hypercaloric group. It was also noted that the highest average value of food consumption in the control group was superior to the hypercaloric one. The average consumption in the control group was superior until the
Dovepress
Nascimento et al
International Journal of General Medicine downloaded from https://www.dovepress.com/ by 170.83.213.75 on 15-Sep-2020
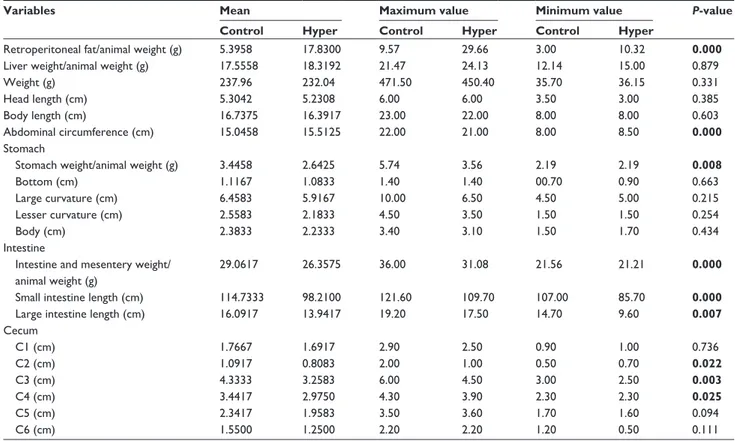
Table 1 Descriptive analysis and t-tests comparing control and hypercaloric groups
Variables Mean Maximum value Minimum value P-value
Control Hyper Control Hyper Control Hyper
Retroperitoneal fat/animal weight (g) 5.3958 17.8300 9.57 29.66 3.00 10.32 0.000
Liver weight/animal weight (g) 17.5558 18.3192 21.47 24.13 12.14 15.00 0.879
Weight (g) 237.96 232.04 471.50 450.40 35.70 36.15 0.331
Head length (cm) 5.3042 5.2308 6.00 6.00 3.50 3.00 0.385
Body length (cm) 16.7375 16.3917 23.00 22.00 8.00 8.00 0.603
Abdominal circumference (cm) 15.0458 15.5125 22.00 21.00 8.00 8.50 0.000
Stomach
Stomach weight/animal weight (g) 3.4458 2.6425 5.74 3.56 2.19 2.19 0.008
Bottom (cm) 1.1167 1.0833 1.40 1.40 00.70 0.90 0.663
Large curvature (cm) 6.4583 5.9167 10.00 6.50 4.50 5.00 0.215
Lesser curvature (cm) 2.5583 2.1833 4.50 3.50 1.50 1.50 0.254
Body (cm) 2.3833 2.2333 3.40 3.10 1.50 1.70 0.434
Intestine
Intestine and mesentery weight/ animal weight (g)
29.0617 26.3575 36.00 31.08 21.56 21.21 0.000
Small intestine length (cm) 114.7333 98.2100 121.60 109.70 107.00 85.70 0.000
Large intestine length (cm) 16.0917 13.9417 19.20 17.50 14.70 9.60 0.007
Cecum C1 (cm) 1.7667 1.6917 2.90 2.50 0.90 1.00 0.736 C2 (cm) 1.0917 0.8083 2.00 1.00 0.50 0.70 0.022 C3 (cm) 4.3333 3.2583 6.00 4.50 3.00 2.50 0.003 C4 (cm) 3.4417 2.9750 4.30 3.90 2.30 2.30 0.025 C5 (cm) 2.3417 1.9583 3.50 3.60 1.70 1.60 0.094 C6 (cm) 1.5500 1.2500 2.20 2.20 1.20 0.50 0.111
Note: Bold values indicate P , 0.05. Abbreviation: Hyper, hypercaloric group.
Table 2 Pearson correlations comparing control (n = 12) and hypercaloric (n = 12) groups for intestinal variables
Intestine and mesentery weight Small intestine length Large intestine length
Control Hyper Control Hyper Control Hyper
Intestine and mesentery weight
Pearson correlation – – 0.357 –0.294 0.017 0.033
P-value – – 0.255 0.410 0.957 0.920
Small intestine length
Pearson correlation 0.357 −0.294 – – −0.148 −0.142
P-value 0.255 0.410 – – 0.646 0.695
Large intestine length
Pearson correlation 0.017 0.033 −0.148 −0.142 – –
P-value 0.957 0.920 0.646 0.695 – –
Note: Bold values indicate P , 0.05. Abbreviation: Hyper, hypercaloric group.
ninth week of the experiment, when there was a higher peak in consumption, in the hypercaloric group, which then switched back to the greatest volume of consumption being in the control group in the tenth week of treatment (Figure 3).
Despite the average food consumption by the control group having been higher than the hypercaloric group, which was more noticeable from the third week on, the t-test did not show a significant difference between the groups for this variable.
External anthropometric measurements
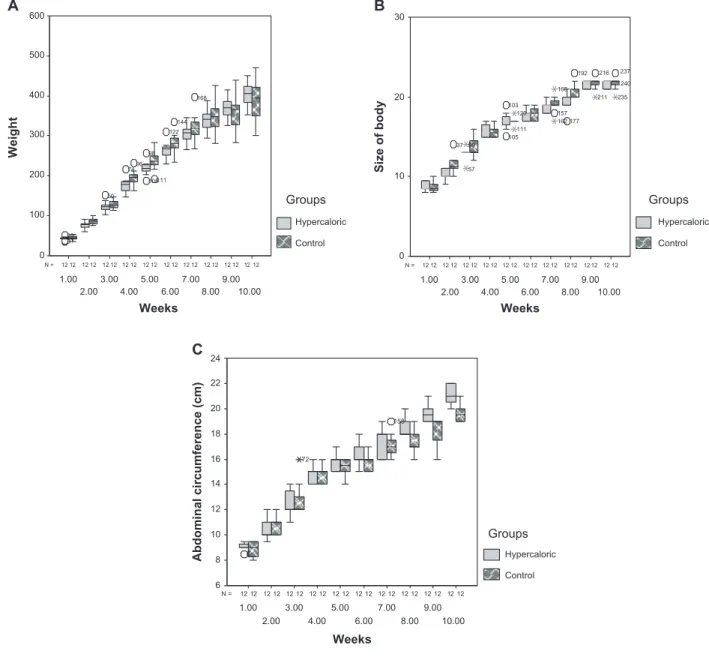
The control group gained more weight during the experimental period, with greater average growth of the head and body compared to the hypercaloric group. On the other hand, the hypercaloric group presented higher average growth in abdominal circumference (Figure 6). The maximum individual values for corporeal weight and head and body growth were recorded in the control group (Table 1). Despite these differences, t-tests did not show significant differences between groups for these variables (Table 1).
Dovepress Gastrointestinal changes in hypercaloric rats
International Journal of General Medicine downloaded from https://www.dovepress.com/ by 170.83.213.75 on 15-Sep-2020
However, a significant difference was confirmed for abdominal circumference, being higher in animals of the hypercaloric group (Table 1).
Macroscopic comparison of inferior
gastrointestinal tract
Comparing the abdominal cavities of rats from the hypercaloric and control groups, we noticed that the dispersal and macroscopic arrangement of gastrointestinal and adjacent structures, such as the genitourinary organs, appeared in different locations (Figure 5). In rats of the hypercaloric group, the inferior gastrointestinal tract was
blanketed by the peritoneum, associated with an excessive layer of fat. Yet in this group, the involution of abdominal organ size of the cecum (initial structure of large intestine) and part of the small intestine was clear compared to the control group.
In the abdominal cavity of control group rats, it was possible to see the abdominal organs better due to the absence of large amounts of fat (seen in group H), and it was noticed that they presented superior size and volume compared to those found in the hypercaloric group (Figure 5). In the hypercaloric group, stomach deformations were detected superficially, and the diet interfered considerably in stomach development.
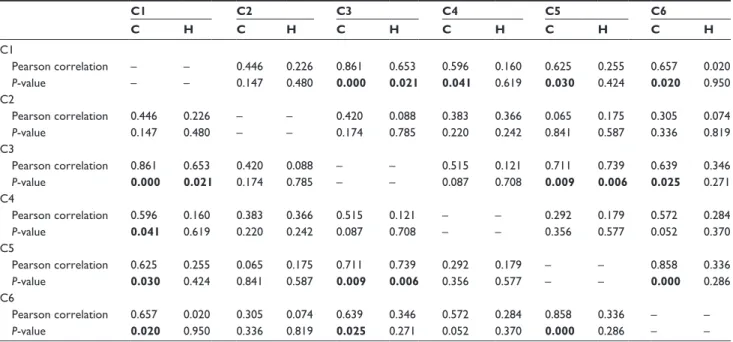
Table 4 Pearson correlation comparing control (C; n = 12) and hypercaloric (H; n = 12) groups for cecum variables
C1 C2 C3 C4 C5 C6 C H C H C H C H C H C H C1 Pearson correlation – – 0.446 0.226 0.861 0.653 0.596 0.160 0.625 0.255 0.657 0.020 P-value – – 0.147 0.480 0.000 0.021 0.041 0.619 0.030 0.424 0.020 0.950 C2 Pearson correlation 0.446 0.226 – – 0.420 0.088 0.383 0.366 0.065 0.175 0.305 0.074 P-value 0.147 0.480 – – 0.174 0.785 0.220 0.242 0.841 0.587 0.336 0.819 C3 Pearson correlation 0.861 0.653 0.420 0.088 – – 0.515 0.121 0.711 0.739 0.639 0.346 P-value 0.000 0.021 0.174 0.785 – – 0.087 0.708 0.009 0.006 0.025 0.271 C4 Pearson correlation 0.596 0.160 0.383 0.366 0.515 0.121 – – 0.292 0.179 0.572 0.284 P-value 0.041 0.619 0.220 0.242 0.087 0.708 – – 0.356 0.577 0.052 0.370 C5 Pearson correlation 0.625 0.255 0.065 0.175 0.711 0.739 0.292 0.179 – – 0.858 0.336 P-value 0.030 0.424 0.841 0.587 0.009 0.006 0.356 0.577 – – 0.000 0.286 C6 Pearson correlation 0.657 0.020 0.305 0.074 0.639 0.346 0.572 0.284 0.858 0.336 – – P-value 0.020 0.950 0.336 0.819 0.025 0.271 0.052 0.370 0.000 0.286 – –
Note: Bold values indicate P , 0.05.
Abbreviations: C, control group; H, hypercaloric group.
Table 3 Pearson correlations comparing control (n = 12) and hypercaloric (n = 12) groups for stomach variables
Bottom Large curvature Lesser curvature Body
Control Hyper Control Hyper Control Hyper Control Hyper
Bottom Pearson correlation – – 0.605 −0.597 0.307 −0.065 0.628 −0.050 P-value – – 0.037 0.040 0.332 0.841 0.029 0.878 Large curvature Pearson correlation 0.605 −0.597 – – 0.811 0.520 0.777 0.091 P-value 0.037 0.040 – – 0.001 0.083 0.003 0.779 Lesser curvature Pearson correlation 0.307 −0.065 0.811 0.520 – – 0.739 0.227 P-value 0.332 0.841 0.001 0.083 – – 0.006 0.478 Body Pearson correlation 0.628 −0.050 0.777 0.091 0.739 0.227 – – P-value 0.029 0.878 0.003 0.779 0.006 0.478 – –
Note: Bold values indicate P , 0.05. Abbreviation: Hyper, hypercaloric group.
Dovepress
Nascimento et al
International Journal of General Medicine downloaded from https://www.dovepress.com/ by 170.83.213.75 on 15-Sep-2020
In the hypercaloric group, results of comparisons between matrices were lower for stomach, intestine, and cecum measurements, suggesting a low shared correlation pattern. The results were significant only for one correlation in the stomach, and two cecum (Tables 2–4).
Discussion
Although the rats of the hypercaloric group consumed less food throughout the experiment, the difference in consumption between the groups was not significant. The reduction in food consumption noticed in the hypercaloric group can be related to the increased quantity of energy present in this type of diet when compared to the standard one. Duarte et al12 also observed that daily consumption of
their diets did not differ between control and hypercaloric groups.
Even though the hypercaloric group consumed less throughout the experiment, it had an expressive increase in abdominal fat development and greater growth in abdominal circumference. Considering the data gained in this study, and conclusions in the literature, it can be inferred that the high-calorie diet influenced greater accumulation of abdominal fat but not weight gain directly, which can be confirmed by the excessive retroperitoneal fat found in the hypercaloric group and the absence of expressive differences between the groups.
According to Bellaver,22 these diets can enhance the
quantity of adipose tissue stored in experiment animals. This author has also observed that individuals with greater adiposity present higher rates of triglycerides and total cholesterol, and reduced HDL, risk factors common to obese
individuals. Zambon et al5 suggested that high-fat diets
reduce feeding efficiency and increase metabolic efficiency, which could explain why the hypercaloric diet did not present statistically expressive results regarding weight gain.
Duarte et al12 determined that rats submitted to the same
kind of hypercaloric diet over 15 days presented a higher rate of weight gain compared to control rats. Probably, the discrepancy among different results found in the literature5,12
is due to the timing of rat maintenance on the mentioned diet, eg, rats in Zambon et al5 were under a hyperlipid diet
for 11 weeks.
As for the quantitative comparison of the abdominal cavities of the control and hypercaloric groups, it was observed that macroscopic disposal and arrangement of gastrointestinal organs and adjacent structures diverged. The macroscopic analyses of hypercaloric group individuals, including inferior gastrointestinal organs, showed that they were blanketed with an excessive fat layer associated with the peritoneum, which was also observed in the mesenteric
2o. principal component scores
2.0 1.5 1.0 0.5 0.0 −0.5 −1.0 −1.5 −2.0
1o. principal component scores
3 2 1 0 −1 −2 Groups Control Hypercaloric
Figure 4 Scatter plot showing the separation of the two groups from the first
principal component scores versus the second principal component scores.
Figure 5 Abdominal cavities and their viscera in the control group (A, C, E, and G) and hypercaloric group (B, D, F, and H). (A and B) Stomachs of control and
hypercaloric groups, respectively. These images show deformations in hypercaloric stomach. (C and D) Abdominal cavities of control and hypercaloric groups,
respectively. (E and F) Intestines and mesentery of control and hypercaloric
groups, respectively. (G and H) Front view of retroperitoneal fat in the control and
hypercaloric groups, respectively.
Dovepress Gastrointestinal changes in hypercaloric rats
International Journal of General Medicine downloaded from https://www.dovepress.com/ by 170.83.213.75 on 15-Sep-2020
fold of the intestines, principally in the central region around major blood vessels. The cecum (initial structure of the large intestine) and part of the small intestine showed no evolution compared to the control group, except the stomach, which showed larger size, less incurving, and higher wrinkling of the wall. Concerning the average accumulated fat in the retroperitoneal area, the hypercaloric group presented a higher expressive value compared to the control group, a difference that was also verified by the higher average retroperitoneal fat/animal weight ratio.
Studies by Duarte et al12 and Bernardes2 reported that rats
on a palatable fat diet, from the third week on, had an increase in retroperitoneal adipose tissue (RET) and epididimal (EPI) fat, with a tendency to a disturbed lipoid profile. These
findings call attention to the danger of the mass increases in visceral adipose tissue in the hypercaloric group, since fat accumulation in the abdominal area has been reported as a determining factor in developing insulin resistance, and also for this tissue being more active metabolically than peripheral adipose tissue. The increase in the relative weight of brown adipose tissue was explained by way of hypertrophy of white adipose tissue is directly associated with the secretion of leptin, a hormone that exacerbates the expression of detachment in brown adipose tissue, producing the weight increase in this tissue.
With regard to the liver expressive differences in the weight of this organ were not found between the two groups. Nevertheless, Zambon et al5 reported that a high-fat diet
12 12 12 12 12 12 12 12 12 12 2 1 12 12 12 12 12 12 12 12 12 N = 10.00 9.00 8.00 7.00 6.00 5.00 4.00 3.00 2.00 1.00 600 500 400 300 200 100 0 168 144 111 96 122 105 98 74 50 11 9 10 12 12 12 12 12 12 12 12 12 12 2 1 12 12 12 12 12 12 12 12 12 N = 10.00 9.00 8.00 7.00 6.00 5.00 4.00 3.00 2.00 1.00 30 20 10 0 235 237 240 211 216 192 157 162 168 111 120 37 177 105 103 57 58 50 12 12 12 12 12 12 12 12 12 12 2 1 12 12 12 12 12 12 12 12 12 N = 10.00 9.00 8.00 7.00 6.00 5.00 4.00 3.00 2.00 1.00 24 22 20 18 16 14 12 10 8 6 158 72 56 A B C Weight Groups Weeks Weeks Weeks Groups Size of body Abdominal circumference (cm) Hypercaloric Control Groups Hypercaloric Control Hypercaloric Control
Figure 6 Box-plot graphics (A) comparing the weight, (B) comparing the body size, and in (C) comparing the abdominal circumference.
Dovepress
Nascimento et al
International Journal of General Medicine downloaded from https://www.dovepress.com/ by 170.83.213.75 on 15-Sep-2020
led to the development of adiposity, and the increased percentage of fat accumulation in the liver was responsible for dyslipidemias.
For the stomach, expressive differences were found for the variables weight of organ and the weight of organ/animal weight ratio. The correlations associated with the stomach measurements of rats from the group control were increased in their dimension, suggesting that the development of this organ be modulated as a whole. By contrast, the stomachs of rats under the hypercaloric diet presented lower value correlations, suggesting loss of modular development in this organ.
Referring to the intestine, statistical testing also showed significant differences for the following variables: relative weight of intestine and mesentery/animal weight and lengths of small and large intestines between the groups. It was also observed that for the morphometric variables measured in the cecum – C1, C2, C3, C4, C5 and C6 – the control group presented the highest average values for all the items. However, the test presented expressive differences only for the C2, C3, and C4, between the groups.
For the variables analyzed in the cecum, the correlation measurements of the organ for the treated group showed significance only for the length of laterals C1 and C3 and between C3 and C5. Correlations for the measures of the cecum of control group rats were present between C1 and C4, C1 and C5, C1 and C6, C3 and C5, and C3 and C6, and were all greater in dimension, suggesting that the development of this organ is modulated as a whole. Once again, the cecums of rats under the hypercaloric diet presented lower values between correlations, suggesting the loss of modular development of this organ.
The differences in correlations between the groups can be explained by external factors, being hormonal variation, muscle-and-bone interactions, neuromuscular control, diets, and even intrinsic factors belonging to other module (adjacent) organs, which interact indirectly or by epigenetic factors,23 yet the degree to which these
factors contribute to organ integration is still an open question.24
It was clearly observed in this study that this kind of diet consumed interferes in the development of the inferior gastrointestinal tract. The null hypotheses were therefore disproved and alternative hypotheses accepted that hypercaloric diets cause anatomical changes in the gastrointestinal tract of rats and may serve to warn of the possible risks that these changes could provoke in the functioning of the organism as a whole.
Acknowledgments
The authors would like to thank Irlei Gonçalves de Souza for technical support, the Pró-Reitoria de Pesquisa e Pós Graduação and Physiology Department of the Universidade Federal do Espírito Santo, anonymous reviewers, and Adriana Nunes Moraes and Ana Carolina Melchiors for their comments on the manuscript.
Disclosure
The authors report no conflicts of interest in this work.
References
1. Lerario DDG, Gimeno SG, Franco J, Lunes M, Ferreira SR. Weight excess and abdominal fat in the metabolic syndrome among Japanese-Brazilians. Rev Saude Publica. 2002;36(1):4–11. Portuguese. 2. Bernardes D, Manzoni MSJ, Souza CP, Tenório N, Dâmaso AR.
Effects of a high-fat diet and swimming moderate training on postexercise metabolism in male adult rats. Rev Bras Educ Fis Esp. 2004;18(2):191–200. Portuguese.
3. Estadella D, Oyama LM, Dâmaso AR, Ribeiro EB, Oller Do Nascimento CM. Effect of palatable hyperlipidic diet on lipid metabolism of sedentary and exercised rats. Nutrition. 2004;20(2):218–224. 4. Cesaretti MLR, Kohlmann OJ. Experimental models of insulin
resistance and obesity: lessons learned. Arq Bras Endocrinol Metab. 2006;50(2):190–197. Portuguese.
5. Zambon L, Duarte FO, Freitas LF, et al. Effects of two different types of swimming exercise on adiposity and lipid profile in rats with exogenous obesity. Rev Nutr. 2009;22(5):707–715. Portuguese.
6. Tschöp M, Heiman ML. Rodent obesity models: an overview. Exp Clin
Endocrinol Diabetes. 2001;109(6):307–319.
7. Velloso LA. The brain is the conductor: diet-induced inflammation overlapping physiological control of body mass and metabolism. Arq
Bras Endocrinol Metabol. 2009;53(2):151–158.
8. Thomas TR, Pellechia J, Rector RS, Sun GY, Sturek MS, Laughlin MH. Exercise training does not reduce hyperlipidemia in pigs fed a high-fat diet. Metabolism. 2002;51(12):1587–1595.
9. Petry CJ, Ozanne SE, Wang CL, Hales CN. Effects of early protein restriction and adult obesity on rat pancreatic hormone content and glucose tolerance. Horm Metab Res. 2000;32(6):233–239.
10. Dobrian AD, Davies MJ, Prewitt RL, Lauterio TJ. Development of hypertension in a rat model of diet-induced obesity. Hypertension. 2000;35(4):1009–1015.
11. Da Silva AS, Pauli JR, Ropelle ER, et al. Exercise intensity, inflam-matory signaling and insulin resistance in obese rats. Med Sci Sports
Exerc. 2010;42(12):2180–2188.
12. Duarte ACGO, Fonseca DF, Manzoni MSJ, et al. High-fat diet and secretory capacity of insulin in rats. Rev Nutr. 2006;19(3):341–348. Portuguese.
13. Eguchi R, Cheik NC, Oyama LM, et al. Effects of the chronic exercise on the circulating concentration of leptin and ghrelin in rats with diet-induced obesity. Rev Bras Med Esporte. 2008;14(3):109–113. Portuguese. 14. De Schepper JA, Smitz JP, Zhou XL, Louis O, Velkeniers BE, Vanhaelst
L. Cafeteria diet-induced obesity is associated with a low spontane-ous growth hormone secretion and normal plasma insulin-like growth factor-I concentrations. Growth Horm IGF Res. 1998;8(5): 397–401. 15. Nascimento AF, Sugizaki MM, Leopoldo AS, et al. A hypercaloric
pellet-diet cycle induces obesity and comorbidities in Wistar rats. Arq
Bras Endocrinol Metabol. 2008;52(6):968–974.
16. De Moraes C, Camargo EA, Antunes E, de Nucci G, Zanesco A. Reac-tivity of mesenteric and aortic rings from trained rats fed with high caloric diet. Comp Biochem Physiol A Mol Integr Physiol. 2007;147(3): 788–792.
Dovepress Gastrointestinal changes in hypercaloric rats
International Journal of General Medicine downloaded from https://www.dovepress.com/ by 170.83.213.75 on 15-Sep-2020
International Journal of General Medicine
Publish your work in this journal
Submit your manuscript here: http://www.dovepress.com/international-journal-of-general-medicine-journal
The International Journal of General Medicine is an international, peer-reviewed open-access journal that focuses on general and internal medicine, pathogenesis, epidemiology, diagnosis, monitoring and treat-ment protocols. The journal is characterized by the rapid reporting of reviews, original research and clinical studies across all disease areas.
A key focus is the elucidation of disease processes and management protocols resulting in improved outcomes for the patient.The manu-script management system is completely online and includes a very quick and fair peer-review system. Visit http://www.dovepress.com/ testimonials.php to read real quotes from published authors. 17. De Moraes C, Davel AP, Rossoni LV, Antunes E, Zanesco A. Exercise
training improves relaxation response and SOD-1 expression in aortic and mesenteric rings from high caloric diet-fed rats. BMC Physiol. 2008;29:8–12.
18. López IP, Marti A, Milagro FI, Zulet Md Mde L, et al. DNA microarray analysis of genes differentially expressed in diet induced (cafeteria) obese rats. Obes Res. 2003;11(2):188–194.
19. Barnes MJ, Lapanowski K, Conley A, Rafols JA, Jen KL, Dunbar JC. High fat feeding is associated with increased blood pressure, sympathetic nerve activity and hypothalamic mu opioid receptors. Brain Res Bull. 2003;61(5):511–519.
20. Burneiko RC, Diniz YS, Galhardi CM, et al. Interaction of hypercaloric diet and physical exercise on lipid profile, oxidative stress and antioxidant defenses. Food Chem Toxicol. 2006;44(7):1167–1172.
21. Marconi MA, Lakatos EM. Técnicas de Pesquisa. [Technical research], 6th ed. São Paulo: Atlas; 2007. Brazilian.
22. Bellaver L, Vital MA, Arruda AM, Bellaver C. Efeitos da dietilpropiona, energia da dieta e sexo sobre o ganho de peso corporal, peso dos órgãos e deposição de tecidos em ratos. [Effects of diethylpropion, sex and diet energy on body weight gain, weight of organs and tissue deposition in rats] Arq Bras Endocrinol Metab. 2004;5(2):167–172. Brazilian. 23. Zelditch ML, Mizey JM, Sheets HD, Lundrigan BL, Garland T Jr.
Developmental regulation of skull morphology II: ontogenetic dynamics of covariance. Evol Dev. 2006;8(1):46–60.
24. Young NM, Hallgrimsson B, Garland T. Epigenetic effects on integration of limb lengths in a mouse model: selective breeding for high voluntary locomotor activity. Evol Biol. 2009;36(1):88–99.
Dovepress
Dove
press
Nascimento et al
International Journal of General Medicine downloaded from https://www.dovepress.com/ by 170.83.213.75 on 15-Sep-2020