Correlations and Principal Components Analysis for Defining Management
Zones in Cotton
Correlações e análise de componentes principais para definir zonas de
gerenciamento em algodão
DOI:10.34117/bjdv6n2-151
Recebimento dos originais: 30/12/2019 Aceitação para publicação: 14/02/2020
Fabio Henrique Rojo Baio
Federal University of Mato Grosso do Sul, Chapadão do Sul Campus, MS 306 Road, km 105, P.O. 112, Chapadão do Sul/MS - 79560-000, Brazil
Rafael da Silva Faraun
Federal University of Mato Grosso do Sul, Chapadão do Sul Campus, MS 306 Road, km 105, P.O. 112, Chapadão do Sul/MS - 79560-000, Brazil
Paulo Eduardo Teodoro
Federal University of Mato Grosso do Sul, Chapadão do Sul Campus, MS 306 Road, km 105, P.O. 112, Chapadão do Sul/MS - 79560-000, Brazil
E-mail: [email protected]
Alexandra Fagioli da Silva bCEEPA - Santa Mariana/PR, Brazil
Danilo Carvalho Neves
Federal University of Mato Grosso do Sul, Chapadão do Sul Campus, MS 306 Road, km 105, P.O. 112, Chapadão do Sul/MS - 79560-000, Brazil
Gileno Brito de Azevedo
Federal University of Mato Grosso do Sul, Chapadão do Sul Campus, MS 306 Road, km 105, P.O. 112, Chapadão do Sul/MS - 79560-000, Brazil
ABSTRACT
One approach for using variable rate fertilizer applications in precision agriculture is to divide an area into management zones. The objectives were: (i) to identify the chemical, physical and phenological properties that have the highest correlation with the yield; (ii) to use principal component analysis (PCA) to identify what physical, chemical, and phenological properties contribute to greater spatial variability; (iii) and to use these variables in the establishing management zones (MZ) for cotton through fuzzy k-means clustering analysis, associated with the geostatistics technique by the ordinary kriging method. The experiment was carried out in a cotton field in the Chapadões region in 2015. Phenological variables of cotton (plant height, number of bolls, number of capsules, opening percentage and Red Edge vegetation index) and chemical (pH, Ca, Mg, H+Al, V%, Ca/Mg, CEC, K, Al3+ and P) and physical (total soil porosity, soil density, soil moisture, soil mechanical resistance to penetration, clay content, and macro and micro-porosity) attributes of the soil were evaluated to define management zones. The variables that showed the highest correlation with cotton yield were pH, phosphorus, soil moisture measured at 39 and 70 days after cotton emergence (DAE), number of bolls at 107 DAE and red edge vegetation index at 53 DAE. The map with four MZ has a better
representation, being the most indicated in the management of agricultural inputs applications at variable rates aiming to increase the cotton yield in the Brazilian Cerrado.
Keywords: Gossypium hirsutum; precision agriculture; multivariate analysis. RESUMO
Uma abordagem para o uso de aplicações de fertilizantes de taxa variável na agricultura de precisão é dividir uma área em zonas de manejo. Os objetivos foram: (i) identificar as propriedades químicas, físicas e fenológicas que apresentam maior correlação com o rendimento; (ii) usar a análise de componentes principais (PCA) para identificar quais propriedades físicas, químicas e fenológicas contribuem para uma maior variabilidade espacial; (iii) e usar essas variáveis nas zonas de manejo estabelecidas (MZ) para o algodão por meio da análise de agrupamento de médias k nebulosas, associada à técnica de geoestatística pelo método de krigagem comum. O experimento foi realizado em um campo de algodão na região de Chapadões em 2015. Variáveis fenológicas do algodão (altura da planta, número de cápsulas, número de cápsulas, porcentagem de abertura e índice de vegetação da borda vermelha) e química (pH, Ca, Mg, H + Al, V%, Ca / Mg, CEC, K, Al3 + e P) e atributos físicos (porosidade total do solo, densidade do solo, umidade do solo, resistência mecânica à penetração do solo, teor de argila e macro e microporosidade) dos atributos solo foram avaliados para definir zonas de manejo. As variáveis que apresentaram maior correlação com a produção de algodão foram pH, fósforo, umidade do solo medida aos 39 e 70 dias após a emergência do algodão (DAE), número de cápsulas aos 107 DAE e índice de vegetação da borda vermelha aos 53 DAE. O mapa com quatro MZ tem uma melhor representação, sendo o mais indicado na gestão de aplicações de insumos agrícolas a taxas variáveis, visando aumentar a produção de algodão no Cerrado brasileiro.
Palavras-chave: Gossypium hirsutum; agricultura de precisão; análise multivariada. 1 INTRODUCTION
One of the tools that can be used to maximize cotton farmer profitability is precision agriculture. It consists of a series of management techniques performed accurately on smaller land units, unlike conventional management which considers an entire field as uniform area (Baio et al. 2017). In economic terms, the use of this technology makes it possible to prioritize investments in areas where production potential is more effective, ensuring greater economic returns (Amaral et al. 2015). From an environmental point of view, streamlining and reducing the use of inputs should be assessed as one of the main benefits of precision agriculture.
Soil physical and chemical properties, as well as morphological plant characteristics, are commonly evaluated through univariate statistical analysis, which may compromise the interpretations and conclusions of these studies (Fidalski et al. 2007). The interaction among these attributes can be studied by multivariate statistical methods, which allow the points clustering with similar characteristics and allow to obtain a better understanding of the variations of the processes that occur in the soil (Fuentes-García et al. 2018).
Among the available multivariate techniques, principal component analysis (PCA) can be applied satisfactorily, since it does not require the use of replicates and it allows to reduce many variables in linear combinations, called principal components (Johnstone et al. 2018). Each principal
component is estimated so that the first (PC1) retains the most significant fraction of the variability, the second (PC2) retains the second largest, and so on. Also, the method makes it possible to judge the importance of the variables evaluated for each component, i.e., those that present greater weight and are more important from the statistical point of view (Martin et al. 2013).
Establishing management zones technique is defined as a method, using spatial management tools from precision agriculture, which provides an economic approach to improve crop management and reduce harmful environmental impact (Nawar et al. 2017). There are several methods for defining these zones, among which we can mention: remote sensing (Jin et al. 2017), crop yield (Servadio et al. 2017), soil physical and chemical properties (Nawar et al. 2017) and topography maps (Schenatto et al. 2017). One of the alternatives for delimitating management units can be by using Fuzzy logic. Management Zones Analyst software (MZA), using Fuzzy logic, provides a series of procedures for delineating management units from a results analysis (Nawar et al. 2017). The number of management zones can be chosen based on the fuzziness index performance (Albornoz et al. 2018) and/or normalized classification entropy (Shukla et al. 2018). However, techniques that determine what soil-water-plant relationship parameters are most adequate for MZA analysis are scarce in the literature.
In view of the above, this work had as objectives: to identify the soil chemical and physical properties and phenological plant attributes that have a higher correlation with yield; to use principal component analysis to identify what physical, chemical, and phenological properties contribute to greater spatial variability; (iii) and to use these variables in the establishing management zones for cotton through fuzzy k-means clustering analysis, associated to the geostatistics technique by the ordinary kriging method.
2 MATERIALS AND METHODS
The experiment was carried out in a cotton field in the Chapadões region, in an area of 90,9 ha at Amambaí Farm, in the municipality of Chapadão do Céu-GO, in the harvest 2014/15. The corresponding geographical coordinates are: 52°37'17.79"W and 18°21'21.40"S. The soil in the study area is classified as Dystrophic Red Latosol (Santos et al. 2013), correspondent to Oxisol of Soil Taxonomy. Average annual rainfall is 2,196 mm, and the average temperature is 22.5°C, respectively. Region climate is characterized by Köppen classification as the tropical climate with the dry winter season. Its average altitude is 815 m, with predominantly smooth slope relief between 1 and 2%.
Seeding was done on January 10, 2015, without second growing, having as previous crop the common bean. The cultivar used was FM 975WS with spacing between rows of 0.80 m and a stand of one hundred thousand plants per hectare. The basic fertilization was carried out according to the
soil analysis, following the recommendations for cultivation in the cerrado (Freire 2015). The fertilization was 15 kg ha-1 of nitrogen (urea), 81 kg ha-1 of P2O5 (single superphosphate) in the
planting furrow, 90 kg ha-1 of K2O (potassium chloride) applied to the haul and 22 kg ha-1 of nitrogen
(calcium nitrate) topdressing. Phytosanitary treatments and applications of agricultural inputs over the crop development were carried out by monitoring and standards for pest and disease control in the region (Freire 2015).
Sampling points were randomly distributed on the cotton field at 23 DAE (days after emergence), corresponding to the phenological stage V5 (fifth true leaf), according to the classification proposed by (Marur and Ruano 2001). Thirty points were located over the map, using ArcGIS 10.5 software and assigning aleatory ten sampling points per each VI (vegetation index) zone (low, medium and high), according to the classified RE readings at 23 DAE. The points were distributed with ranging sampling distances. At each sampling point, phenological indices of five plants were measured to represent the local variability by their mean. These plants were tagged to identify them for the following samplings. Navigation to the sampling points was possible using the GNSS Trimble Nomad (Sunnyvale, EUA).
For the phenological analysis, the variables measured in the field at each sampling point were: plant height (PH), number of bolls (NB), number of capsules (NC), opening percentage (%OP) and Red edge vegetation index (RE). The height of each plant was measured at the main stem from the soil surface to the insertion point of the last fully expanded leaf. At 26 DAE, ten random sub-samples were taken around each point from the sample grid previously described for the chemical evaluations, making a composite sample in depth 0.0-0.40 m. The pH, calcium (Ca), magnesium (Mg), potential acidity (H+Al), base saturation (V%), calcium/magnesium ratio (Ca/Mg), cation exchange capacity (CEC), potassium (K), aluminum (Al3+) and phosphorus (P) were determined according to methodology proposed by (Teixeira et al. 2017).
For the soil physical analysis, at 39 DAE, undisturbed samples were collected by using a volumetric ring at each point from the random grid at depths 0.0-0.1, 0.1-0.2, 0.2-0.3 and 0.3-0.4 m. It was taken one sample per point per depth. With the values determined in each depth stratum, the averages 0.0-0.4 m were calculated, decreasing the number of variables for composing the PCA. The following properties were determined in the laboratory: total soil porosity (TP, via macro and micro porosity sum), soil density (SD, via gravimetric procedure applied to the soil samples), soil moisture (SM, using deformed soil sample with gravimetric procedure), soil mechanical resistance to penetration (RP, via Stolf impact penetrometer) (Vogel et al. 2017), clay content (CC, applying the densimeter method), macro and micro-porosity (Macro and Micro, respectively). The CC was determined using an aliquot of the soil sampling taken to the chemical analyses. Macro and Micro
were determined using Richard’s pressure plate apparatus SEC-LAB023V2 up to 5.88 kPa (Macro), based on the humidity of the field capacity, and up to 1.47 MPa (Micro), based on the humidity at the permanent wilting point.
The active multispectral sensor used for the RE data collection was the N-Sensor ALS (Yara International ASA, Duelmen, Germany). It is an active canopy optical sensor, emitting its own light source and with spectral readings at the edge wavelengths of the red and near infrared 730 nm and 760 nm, respectively (Baio et al. 2018). N-Sensor was mounted on the cabin top of a John Deere self-propelled sprayer 4730 model (Catalão, Brazil), at the height of 3.10 m from the ground. The range scanned by the sensor has an average width of 3 m along the machine travel. The strides occurred in a width of 30 m. Area scanning to obtain RE was carried out at 23, 35, 53, 91 and 168 DAE.
The harvest was performed by the John Deere cotton harvester 7760 model (DesMoines, EUA), assembled with a harvest monitoring system GreenStar Harvest Doc. Raw data of the point yield were filtered based on their variance, and the upper and lower cut limits were determined (Geiger 2018). After interpolation by the ordinary kriging methodology applying ArcGIS software, the point yield information correlated with the other components was obtained by the points average obtained within a 10 m radius of the control sampling point.
First, Pearson's correlations among chemical, physical and phenological properties were estimated with the yield. Due to a large number of variables in each class, the correlation network was used to express the results graphically. This analysis, as well as the PCA, were carried out using the RBio free software (Bhering 2017). The principal component analysis was applied to the group of chemicals, physical and phenological properties separately. Additionally, yield was inserted into each of the groups to estimate the linear combinations.
After identifying the properties that have higher correlation with yield and more significant contribution to PC1, we used the MZA - Management Zone Analyst software (Albornoz et al. 2018; Debastiani et al. 2018), for defining the management zones. This analysis using the following parameters: fuzzy exponent 1.3; Mahalanobis similarities measures for combined analysis (more than one property); maximum number of interactions 300 and convergence criterion 0.0001. Based on the MZA indices, Fuzzy Performance Index and Image Classification Entropy (ICE). We used as a minimum number of management zones two (1 and 2) and the maximum number of four differentiated management zones (1, 2, 3 and 4).
3 RESULTS AND DISCUSSION
3.1 CORRELATION AMONG PROPERTIES AND YIELD
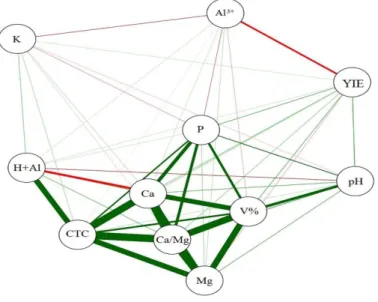
Linear correlations among chemical soil properties and yield (YIE) are presented in Figure 1. It can be observed that the highest correlations were among the variables Ca and Ca/Mg (r=0.8786), but Ca and CEC, Mg and Ca/Mg, CEC and Ca/Mg Also presented correlations higher than 0.80. High and very high levels of Ca, Mg and K and their relationships have a strong relation with crop yield. Nawar et al. (2017) observed low magnitude correlations among Ca, Mg and K levels in the soil with wheat yield.
Figure 1. Pearson's correlation network among soil chemical properties and yield.
**YIE: seed cotton yield; Al3+: Aluminum; pH: hydrogen potential; V%: base saturation percentage; P: Phosphorus; Mg: Magnesium; Ca/Mg: Calcium/Magnesium ratio; Ca: Calcium; CEC: Cation Exchange
Capacity; H+Al: potential acidity; K: Potassium.
Base saturation and Ca and Mg contents increased in the soil reduce K uptake because there is a competitive inhibition among these elements in the uptake phase (Carmeis Filho et al. 2017). Soils in the Cerrado region have low K levels, and the cotton requires about 63 kg of K2O for
producing one ton of seed cotton (Freire 2015). This strong relation among elements is mainly due to the management adopted in the cultivation area, such as adoption of precision agriculture and minimum cultivation, crop rotation and chemical soil corrections, causing a Ca and Mg intake.
Chemical soil property that showed the highest negative correlation with cotton yield was Al3+ (varied from 0.03 to 0.13 cmol dm-3), which is already expected, since it in high concentrations inhibits the plant development, being commonly present in the cerrado soils. There is a greater roots
proliferation under suitable soil correction conditions (Mcl. Bennett et al. 2015). Although the observed correlation between pH and P with yield is low, these were the chemical properties that are closest to YIE in the correlation network and should be considered for obtaining high yields. Based on the results, soil pH values are related to P level, since both are related to root development. P is essential for flowering, fruit development, and boll maturation. In soils with medium and high levels of this nutrient, there is no need to apply high fertilizer rates, so it is suggested that applying 60 to 80 kg ha-1 is sufficient to maintain the soil fertility and cotton yield potential (Freire 2015).
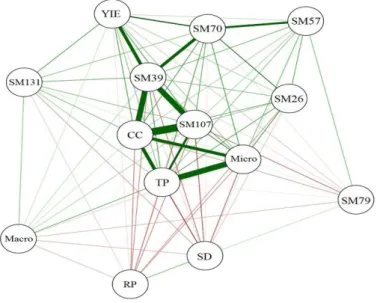
Linear correlations among soil physical properties and yield are presented in Figure 2. The most significant correlations were found among soil moisture variables at 107 DAE and clay content (r=0.9030), being that total porosity at 0.0-40 cm and micro-porosity at 0.0-40 cm also presented correlations greater than 0.80. These attributes are correlated to each other, forming a group in the central fraction of the correlation network.
Figure 2. Pearson's correlation network among soil physical properties and yield.
**YIE: seed cotton yield; TP: total soil porosity; SD: soil density; SM: soil moisture in 26, 39, 57, 70, 79, 107 and 131 days after emergence; RP: soil mechanical resistance to penetration; CC: clay content; Macro:
macro-porosity at 0.0-0.4 m; Micro: micro-porosity at 0.0-0.40 m.
Soil physical properties that present a higher correlation with the seed cotton yield was soil moisture from 39 DAE and, to a lesser magnitude, 70 DAE. Macro, RP, and SD showed no correlation with yield, indicating that the soil probably was not compacted to affect yield. Micro, which is responsible for moisture storage and also governs its availability to plants, and which has a high correlation with soil moisture.
In excess, soil moisture factor causes increased plant cycle stimulating the vegetative growth and damaging the reproductive development. In years with excessive rainfall, yield variability tends to be intensified (Sana et al. 2014). The transport of P is dependent on soil moisture, contributing to the response of P being one of the properties with a higher correlation with yield (Generoso et al. 2017). Also, the P availability resulted in a higher number of the capsule and hence higher production. Linear correlations among phenological variables of cotton and YIE are presented in Figure 3. The highest correlation was between Red edge VI at 23 DAE and Red edge VI at 35 DAE (r=0.8405). A cotton phenological variable that showed the highest correlation with the yield was the number of bolls at 107 DAE.
Generoso et al. (2017) in studies on soil moisture and P diffusion, the higher level of water in the soil resulted in the greater diffusive flux of the element. In other words, the soil moisture at the beginning of the reproductive phase is of extreme importance, which was evidenced in Fig. 2. The adequate water supply and P availability in the soil benefit the cotton yield mainly by increasing the retention of bolls. In line with the highest correlation with verified yield, NB 107DAE, the phase of greater flowering and ripening of reproductive cotton structures. After 80 DAE, cotton uptake significant P amounts. It is also important to highlight the ease that linear correlations can be interpreted using the graphical correlation network technique. The efficiency of this innovative technology has already been proven in other studies that evaluated several variables (Fuentes-García et al. 2018; Johnstone et al. 2018).
4 PRINCIPAL COMPONENTS ANALYSIS
Correlation network showed that a group of chemicals (Fig. 1), physical (Fig. 2) and phenological (Fig. 3) properties are highly correlated with each other, but have a low correlation with yield. Therefore, to summarize the variability observed among each group of attributes, the PCA was performed. According to (Fuentes-García et al. 2018), the selected main components must have eigenvalues greater than 1.00 and in these components the most important variables must have correlations with eigenvalues greater than 0.5. Tus, we chose to use only PC1 because this component obtained eigenvalues greater than 1 in all three analyzes (cotton phenological variables, chemical and physical attributes of the soil). The variables selected in each analysis were those that presented the highest correlation with the eigenvectors in PC1.
Figure 3. Pearson's correlation network among phenological properties and yield.
**YIE: seed cotton yield; PH: plant height at different days after emergence; NB: number of bolls at different days after emergence; NC185: number of capsules at 185 DAE; RE: vegetation index at different
days after emergence.
The first principal component (PC1) retained 39.12% of total variability among soil chemical properties and yield, while the second component captured 17.17% of this variation. These two components accumulated 56.29% of the total variability. The Ca/Mg ratio was a variable that presented greater factorial load in the principal component 1 (PC1), followed by the variables Ca and CEC. This result reiterates the observed correlations among these variables and demonstrates their essential contribution to total variability. Chemical soil variable of more significant contribution to PC2 was H + Al, followed by pH and V%, and pH was one of the variables that presented the highest correlation with cotton yield.
Uribeetxebarria et al. (2018) used the PCA involving 12 soil chemical properties and identified three components that explained 67.4% of the total variability. A similar result was observed by Shukla et al. (2018) when using a PCA for establishing management zones for a cultivated region based on soil fertility using fuzzy clustering.
When the PCA was applied to soil physical properties and yield, the PC1 was responsible for 42.00% of the variation observed, while the PC2 was accountable for 14.82%. These two components accumulated 56.82% of the observed variability among physical properties and yield. Moreover, among these, clay content was the variable that presented the highest factorial load in the principal component 1, followed by the variables soil moisture at 39 DAE. Physical soil variable of most
significant contribution to principal component 2 was soil moisture at 57 DAE, followed by soil moisture at 79 DAE, and soil moisture at 39 DAE was one of the variables that showed the highest correlation with cotton yield (r=0.69).
The PC1 explained 45.12% of the total variance of the cotton phenological variables, being 31.21% to PC1; 18.13% to PC2; 12.85% for PC3; 6.71% for PC4 and 5.03% to PC5. In the principal component analysis of the phenological variables, the Red-edge VI at 23 DAE was the variable that presented the highest factorial load in the principal component 1, followed by the variables number of capsules at 185 DAE and plant height at 39 DAE. A similar result was observed by Tripathi et al. (2015), who when using the PCA to summarize the variability observed among phenological rice attributes and soil physical properties, they observed that NDVI showed the highest contribution to the PC1.
Greater contribution variable to principal component 2 was number of bolls at 82 DAE, followed by Red edge VI readings at 168 DAE and number of bolls at 128 DAE, with number of bolls at 107 DAE one of the variables that presented the highest correlation with cotton yield (r=0.52). Underwater stress condition, the flowering and/or fruiting phases are the most sensitive for cotton, causing the fall of buds and bolls, directly impacting yield and fruit quality (Freire 2015).
Phenological correlation with cotton yield establishes a link with the soil physical and chemical properties, because as the relationship of soil moisture at 79 DAE and the P availability directly affected the flowering phase and development of reproductive structures, resulting in higher number of capsules per plant and consequently higher yield (Khan et al. 2017).
Thus, the variables used in the establishment of the management zones according to the PC1 from PCA were: Ca/Mg, clay content and Red edge VI 23 DAE. It is important to highlight the importance of using PCA to identify these variables. Typically, the linear correlation among chemical and physical attributes with annual crop yields is low (<0.50), preventing the isolation of biotic and abiotic factors that influence crop production. In precision agriculture, hardly a single variable will be able to explain the spatial variability of the crop yield such as cotton. In this case, the use of techniques that allow decreasing the dimensionality as the PCA is vital to identify and interpret the distribution of the original variables of greater weight. The use of PCA has been widely used to identify soil physical and chemical properties for establishing management zones in several surveys (Tripathi et al. 2015; Nawar et al. 2017; Uribeetxebarria et al. 2018).
5 ESTABLISHING COTTON MANAGEMENT ZONES
Precision agriculture works with areas of soil and crop management. With the properties of more significant correlation with yield and greater contribution to PC1, considering the soil physical
and chemical properties and cotton phenological properties, three management zones were defined. A management zone map with four classes was also elaborated in order to compare. Based on the normalized classification entropy index and fuzziness performance index for different numbers of zones obtained with MZA, in the majority of cases, the best number of zones will vary between 3 and 5 (Servadio et al. 2017; Albornoz et al. 2018).
The properties that showed spatial dependence were fitted to the exponential model for Al3+, Ca/Mg. For the variables SM39, clay content, zones 2, zones 3 and zones 4, the Gaussian model was fitted, and for NB107 and RE23, the model was spherical. All variables presented spatial dependence. This result is significant because the spatial dependence indicates the fitted variability, and by the theoretical variogram model, it is possible to apply the interpolation by the ordinary kriging methodology (Debastiani et al. 2018). The range of a mapped attribute ensures that all neighbors (within a circle with this radius) have spatial continuity and can be used to estimate values at any position between them (Debastiani et al. 2018). The lowest range values were 342.6 m for management zones 2 and 376.0 m for management zone 3, and the highest for Ca/Mg, SM39 and clay content.
In Figure 4 are the maps of the properties with the highest correlation with yield, the properties of most significant contribution in PC1 and the management zones defined by the MZA software after the principal components analysis. The map of three management zones presents lesser spatial variability, resulting in a more straightforward map, with an easier agricultural applications management, however, with a higher value of 0.091 of the ICE index (Image Classification Entropy) obtained by the MZA software. On the other hand, the map with four management zones (Figure 4I) shows a greater variability of the class representation, obtaining the lowest value of ICE index (0.067), becoming the applicable map in the management of agricultural input applications.
Figure 4. Spatial distribution of each property with higher correlation with cotton yield, property of greater
contribution in PC1 and maps of management zones (MZ) with three and four classes, according to the principal components and correlations analysis.
Thus, variable rate technology and site-specific nutrient management fit each farm input precisely based on the specific condition for each field operation unit so that it becomes adaptable to any crop production system (Servadio et al. 2017). The most popular approach to managing spatial variability within fields is the use of management zone technique. In this technique, the field can be subdivided into different zones that have relatively similar attributes in landscape and soil conditions and can be used for applying direct variable rate fertilizer (Nawar et al. 2017). Considering the high cost of cotton production, this technology makes it possible to increase the yield of this crop with the lowest possible cost.
6 CONCLUSIONS
The main properties that have the most significant relationship with cotton yield are: Al3+, soil moisture at 39 DAE (close related to clay content) and number of bolls at 107 DAE.
The use of principal components analysis of the soil physical and chemical properties and cotton phenological variables identify the most suitable variables for applying Fuzzy logic technique with the purpose of defining the management zones
The map with four management zones has a better representation of the management zones, being the most indicated in the management of agricultural inputs applications at variable rates aiming to increase the cotton yield in the Brazilian Cerrado.
ACKNOWLEDGMENTS
Special thanks to the Foundation to Support the Development of Education, Science, and Technology of the State of Mato Grosso do Sul (Fundect), CNPq and to Wink Farms Group in supporting this work.
REFERENCES
Albornoz E. M., Kemerer, A. C., Galarza, R., Mastaglia, N., Melchiori, R., Martínez, C. E. (2018). Development and evaluation of an automatic software for management zone delineation. Precision Agriculture. 19. 3.463-476. 10.1007/s11119-017-9530-9
Amaral L. R., Molin, J. P., Schepers, J. S. (2015). The effectiveness of three vegetation indices obtained from a canopy sensor in identifying sugarcane response to nitrogen. Agronomy Journal. 107. 4.1513–1523. doi:10.2134/agronj2012.0504
Baio F. H. R., Neves, D. C., Souza, H. B., Leal, A. J. F., Leite, R. C., Molin, J. P., Silva, S. P. (2018). Variable rate spraying application on cotton using an electronic flow controller. Precision Agriculture. 19. 5.912–928. 10.1007/s11119-018-9564-7
Baio F. H. R., Silva, S. P. d., Camolese, H. d. S., Neves, D. C. (2017). Financial analysis of the investment in precision agriculture techniques on cotton crop. Engenharia Agrícola. 37.838-847. http://dx.doi.org/10.1590/1809-4430-eng.agric.v37n4p838-847/2017
Bhering L. L. (2017). Rbio: A tool for biometric and statistical analysis using the R platform. Crop
Breeding and Applied Biotechnology. 17.187-190.
http://www.scielo.br/scielo.php?script=sci_arttext&pid=S1984-70332017000200187&nrm=iso CARMEIS FILHO A. C. D. A., CRUSCIOL, C. A. C., NASCENTE, A. S., MAUAD, M., GARCIA, R. A. (2017). INFLUENCE OF POTASSIUM LEVELS ON ROOT GROWTH AND NUTRIENT
UPTAKE OF UPLAND RICE CULTIVARS. Revista Caatinga. 30.32-44. http://www.scielo.br/scielo.php?script=sci_arttext&pid=S1983-21252017000100032&nrm=iso Debastiani A. B., de Vasconcellos, B. N., Martins, A. P. M., Dalla Corte, A. P., Sanquetta, C. R. (2018). Predições geoestatísticas e zonas de incerteza no inventário de povoamentos florestais.
Advances in Forestry Science. 5. 1.283-287.
http://periodicoscientificos.ufmt.br/ojs/index.php/afor/article/view/5692/pdf
Fidalski J., Tormena, C. A., Scapim, C. A. (2007). Espacialização vertical e horizontal dos indicadores de qualidade para um Latossolo Vermelho. Revista Brasileira de Ciência do Solo. 31. 2.9–19. http://dx.doi.org/10.1590/S0100-06832007000100002
Freire E. C. (2015). Algodão no cerrado do Brasil. 3 ed. Editora Positiva, Brasília. 956 p.
Fuentes-García M., Maciá-Fernández, G., Camacho, J. (2018). Evaluation of diagnosis methods in PCA-based Multivariate Statistical Process Control. Chemometrics and Intelligent Laboratory Systems. 172.194-210. https://doi.org/10.1016/j.chemolab.2017.12.008
Geiger J. (2018). Statistical process control in the evaluation of geostatistical simulations. Central European Geology. 61. 1.50-72. https://doi.org/10.1556/24.61.2018.04
Generoso T. N., Martinez, M. A., Rocha, G. C., Hamakawa, P. J. (2017). Water magnetization and phosphorus transport parameters in the soil. Revista Brasileira de Engenharia Agrícola e Ambiental. 21. 1.9-13.
Jin Z., Prasad, R., Shriver, J., Zhuang, Q. (2017). Crop model- and satellite imagery-based recommendation tool for variable rate N fertilizer application for the US Corn system. Precision Agriculture. 18. 5.779-800. 10.1007/s11119-016-9488-z
Johnstone I., et al. (2018). RETHINKING PRINCIPAL COMPONENT ANALYSIS (PCA) FOR MODERN DATA SETS: THEORY, ALGORITHMS, AND APPLICATIONS. Proceedings of the IEEE. 106. 8. https://doi.org/10.1109/JPROC.2018.2855383
Khan A., Tan, D. K. Y., Afridi, M. Z., Luo, H., Tung, S. A., Ajab, M., Fahad, S. (2017). Nitrogen fertility and abiotic stresses management in cotton crop: a review. Environmental Science and Pollution Research. 24. 17.14551-14566. 10.1007/s11356-017-8920-x
Martin M. Z., Mayes, M. A., Heal, K. R., Brice, D. J., Wullschleger, S. D. (2013). Investigation of laser-induced breakdown spectroscopy and multivariate analysis for differentiating inorganic and organic C in a variety of soils. Spectrochimica Acta Part B: Atomic Spectroscopy. 87.100–107. 10.1016/j.sab.2013.05.026
MARUR C. J., RUANO, O. (2001). A reference system for determination of developmental stages of upland cotton. Revista de oleaginosas e fibrosas. 5. 2.313-317.
McL. Bennett J., Cattle, S. R., Singh, B. (2015). The Efficacy of Lime, Gypsum and Their Combination to Ameliorate Sodicity in Irrigated Cropping Soils in the Lachlan Valley of New South Wales. Arid Land Research and Management. 29. 1.17-40. 10.1080/15324982.2014.940432
Nawar S., Corstanje, R., Halcro, G., Mulla, D., Mouazen, A. M. (2017). Delineation of soil management zones for variable-rate fertilization: A review. In: Advances in Agronomy, vol 143. Elsevier, pp 175-245. https://doi.org/10.1016/bs.agron.2017.01.003
Sana R. S., Anghinoni, I., Brandão, Z. N., Holzschuh, M. J. (2014). Variabilidade espacial de atributos físico-químicos do solo e seus efeitos na produtividade do algodoeiro. Revista Brasileira de Engenharia Agrícola e Ambiental, Campina Grande Vol 18, n 10 (out 2014), p 994-1002.
Santos H. G., et al. (2013). Sistema brasileiro de classificação de solos. 3 ed. Embrapa, Brasilia. 353 p.
Schenatto K., Godoy de Souza, E., Leones Bazzi, C., Betzek, N. M., Gavioli, A., Martins Beneduzzi, H. (2017). Use of the farmer’s experience variable in the generation of management zones. Semina: Ciências Agrárias. 38. 4. http://www.redalyc.org/html/4457/445752611004/
Servadio P., Bergonzoli, S., Verotti, M. (2017). Delineation of management zones based on soil mechanical-chemical properties to apply variable rates of inputs throughout a field (VRA).
Engineering in Agriculture, Environment and Food. 10. 1.20-30.
https://doi.org/10.1016/j.eaef.2016.07.001
Shukla A. K., et al. (2018). Evaluation of spatial distribution and regional zone delineation for micronutrients in a semiarid Deccan Plateau Region of India. Land Degradation & Development. 29. 8.2449-2459. https://doi.org/10.1002/ldr.2992
Teixeira P. C., Donagemma, G. K., Fontana, A., Teixeira, W. G. (2017). Manual de Métodos de
Análise de Solo. Embrapa Solos-Livro técnico (INFOTECA-E).573.
https://ainfo.cnptia.embrapa.br/digital/bitstream/item/172313/1/Pt-2-Cap-3-Cations-trocaveis.pdf Tripathi R., et al. (2015). Delineation of soil management zones for a rice cultivated area in eastern India using fuzzy clustering. CATENA. 133.128-136. https://doi.org/10.1016/j.catena.2015.05.009 Uribeetxebarria A., Arnó, J., Escolà, A., Martínez-Casasnovas, J. A. (2018). Apparent electrical conductivity and multivariate analysis of soil properties to assess soil constraints in orchards affected by previous parcelling. Geoderma. 319.185-193. https://doi.org/10.1016/j.geoderma.2018.01.008 Vogel G. F., Martinkoski, L., Grillo, J. F., Michalovicz, L., Fey, R. (2017). Avaliação dos penetrômetros de impacto e eletrônico na determinação da resistência mecânica a penetração do solo. Scientia Agraria. 18. 3.30-36.