Copyright: This is an open-access article distributed under the terms of the Creative Commons Attribution License®, which permits unrestricted use, distribution, and reproduction in any medium, provided that the original author and source are credited.
Descriptive epidemiology of high TV-viewing
time in Brazilian adults
Epidemiologia do excesso de tempo assistindo televisão em adultos brasileiros
AUTHOR’SGregore Iven Mielke1,2 Luiza Ricardo1 Andrea Wendt1
Diego Giulliano Destro Christofaro3 Neville Owen4,5
1 Postgraduate Program in Epidemiology, Federal University of Pelotas, Pelotas, Rio Grande do Sul, Brazil.
2 School of Human Movement and Nutrition Sciences, University of Queensland, Brisbane, Queensland, Australia.
3 Department of Physical Education, São Paulo State University, São Paulo, São Paulo, Brazil. 4 Baker Heart & Diabetes Institute, Melbourne, Australia.
5 Swinburne University of Technology, Melbourne, Australia.
CORRESPONDING Grégore Iven Mielke [email protected]
Postgraduate Program in Epidemiology, Federal University of Pelotas.
Rua Marechal Deodoro, 1160, 3rd floor, Pelotas, Rio Grande do Sul, Brazil. CEP: 96020-220.
DOI
10.12820/rbafs.23e0020
ABSTRACT
High volumes of daily television viewing time increase risk of cardiovascular disease and other health problems. We report the descriptive epidemiology of high (3+ hrs/day) and very high (5+ hrs/ day) television (TV) viewing time and their correlates among Brazilian adults. Data from 60,202 participants (18 more years of age) in the National Health Survey carried in 2013 were analysed. The proportions of adults spending more than 3 hours per day and more than 5 hours/day watching TV were calculated. Descriptive and adjusted analyses examined variations in the prevalence of high and very high (of TV viewing time by age, educational attainment and physical activity level, separately for men and women. Prevalence in a normal day of high TV viewing time was 28.9% and was 8.9% for very high TV time. Overall, women and those who were less educated reported more TV time than did men and the more educated. There was a slightly inverse association between physical activity practice and TV time for men but there was not a clear association between physical activity and time spent watching TV among women. Prevalence of very high TV time was 46% lower among high-educated women than their counterparts. The prevalence of high and very high TV time suggests the need to implement actions to address high levels of TV time as a prevalent leisure-time sedentary behaviour and to promote attractive active recreational options at the population level in Brazil.
Keywords: Sedentary lifestyle; Physical activity; Epidemiology; Public health; Cross-sectional study.
RESUMO
O excesso de tempo assistindo televisão (TV) podem aumentar o risco de doenças cardiovasculares e outros problemas de saúde. O objetivo desse estudo foi descrever o excesso de tempo de televisão e seus correlatos entre adultos brasileiros. Foram analisados dados de 60.202 participantes (18 anos ou mais) na Pesquisa Nacional de Saúde, realizada em 2013. A prevalência de adultos que passaram mais de 3 horas por dia e mais de 5 horas/dia assistindo TV foram calculados para homens e mulheres de acordo com idade, nível de escolaridade e nível de atividade física. A prevalência participantes que relataram mais de 3 horas por dia de TV foi de 28,9%, enquanto 8,9% relataram mais de 5 horas por dia. Mulheres e participantes com menor escolaridade relataram mais tempo de TV quando comparados aos seus pares. Homens que praticaram mais atividade física relataram menos tempo de TV, entretanto o mesmo não foi observado em mulheres. A prevalência de mais de 5 horas por dia em TV foi 46% menor entre as mulheres com alto nível de escolaridade. Estes resul-tados sugerem a necessidade de implementar ações em nível populacional que considerem o comportamento sedentário, ratificando a importância em promover opções atrativas de lazer ativo para população.
Palavras-chave: Estilo de vida sedentário; Atividade física; Epidemiologia; Saúde pública; Estudo transversal.
Introduction
Physical inactivity is a major public health issue in need of intervention. Estimates in 2016 suggested that one in four adults worldwide did not achieve 150 minutes of moderate intensity activity or 75 minutes of vigorous intensity activity, or an equivalent combi-nation, per week1. Besides physical inactivity, negative
influences of sedentary behaviour on health outcomes has been widely discussed in the literature2-8. Evidence
points to excessive amounts of sedentary behaviour as a risk factor for weight gain, type 2 diabetes, cardiovas-cular disease, and all-cause mortality4, 7-8.
Television (TV) viewing time is highly prevalent in adults9-10 and represents an important proportion
of leisure time that is spent sedentary10. A recent
me-ta-analysis including data from 13 longitudinal studies that investigated the association between TV viewing and all-cause mortality in adults, showed an increased risk on mortality for those who spent three or more hours per day watching TV regardless of physical ac-tivity, except for those who were very highly physical-ly-active (more than 1h/day in moderate to vigorous physical active). Furthermore, among those who spent on average more than five h/day watching TV, all-cause mortality rate was 16% higher, even among those who were highly active2.
A review including findings from 18 surveys, demonstrated that nearly 55% of older adults reported watching more than two hours per day of TV11.
Fur-thermore, Australian surveillance data showed preva-lence of high screen time (more than 21 hours in the previous week) increased from 40.8% in 2002 to 46% in 200812. In Brazil, nearly one third of adults spend
more than three hours/day watching TV13.
Recreation-al screen-time habits may be changing in Brazil, with the Surveillance System of Protective and Risk Factors for Chronic Diseases Telephone Survey (VIGITEL), showing an annual decline in television viewing time 2006 and 201214. However, TV time remains a highly
prevalent leisure time sedentary behaviour that displaces more-active opportunities and is associated with adverse health outcomes. As such, it needs to be better under-stood as a prevalent health risk at the population level.
Overall, studies in Brazil have shown that women, el-derly and less educated people are those who spend more time watching TV when compared to their counterparts10.
Despite the number of studies investigating correlates of high TV-viewing time, prevalence and factors associated with TV-viewing at the national level, are yet to be in-vestigated. To this end, this study aimed to report the de-scriptive epidemiology of high and very high TV-viewing time and their correlates among Brazilian adults.
Methods
This study was conducted using data from the Brazi-lian National Health Survey, 2013, which was carried out through an agreement between the Ministry of Health and the Brazilian Institute of Geography and Statistics. The National Health Survey is a cross-sec-tional study with representativeness of the Brazilian adult population (18 + years). The sampling process was carried out in multiple stages, with census tracts as primary sampling units, households as secondary units
and residents aged 18 years or over as tertiary sampling units. In each household an adult aged 18 year or more was invited to respondent a questionnaire on the li-festyle and health status. All interviewees were consul-ted, informed, and agreed to participate by signing an informed consent form. The National Health Survey was approved by the National Ethics Committee, un-der protocol number 328,159 in June 26, 2013. Further information on the sampling process and instruments used in the National Health Survey are available in previous publications14-16.
Television viewing time was measured using a ques-tion where participants reported the average time spent watching television in a normal week day, using the fol-lowing question: “on average, how many hours per day do you spend watching television?”. A similar question has been used in previous surveys in Brazil13-14.
Televi-sion viewing time was divided in three categories: 1) < 3 hours/day; 2) 3-5 hours/day; and 3) > 5 hours day.
A weekly score of leisure time physical activity, in which the time spent in activities was multiplied by the number of days, was built. In order to construct an in-dicator of leisure-time physical activity, the following questions were used: 1) Have you practiced sports or exercise in the last three months? 2) How many days per week do you usually practice sports/exercise 3) On these days, how much time do you spend in sports/exer-cise? The participants who reported performing at least 150 minutes per week of physical activity during leisure time were classified as active during leisure time17.
Initially, distribution of TV-viewing was calculated according to gender, age groups (18 - 24; 25 - 34; 35 - 44; 45 - 54; 55 - 64; 65 - 74; and 75+ years), and education level. Education level was classified as follows: Grade I - uneducated and incomplete primary education; Grade II - complete primary and incomplete secondary education; Grade III - complete secondary and incomplete superior education; Grade IV - complete superior education.
Second, correlates of high (> 3 h/day) and very high TV-viewing (> 5 h/day) were investigated. For each in-dicator crude and adjusted prevalence ratios and their respective 95% confidence intervals (95% CI) were cal-culated for each of the independent variables. Adjusted analyses considered gender, age, education and physi-cal activity levels. For this, Poisson regression analyses were conducted. Analyses were performed using Stata, version 12.1. In all analyses, we used the ‘svy’ command in order to consider the sample weights and expand the results for the Brazilian population according to
gender, age, education and local of residence.
Results
A total of 60,202 adults aged 18 years or older were interviewed. The sample consisted of 52.0% women; some 5% were aged 75 years or older. The majority of the sample (38.9%) reported Grade I in terms of edu-cation, with just over 12.0% of the sample exhibited Grade IV instruction (complete superior education).
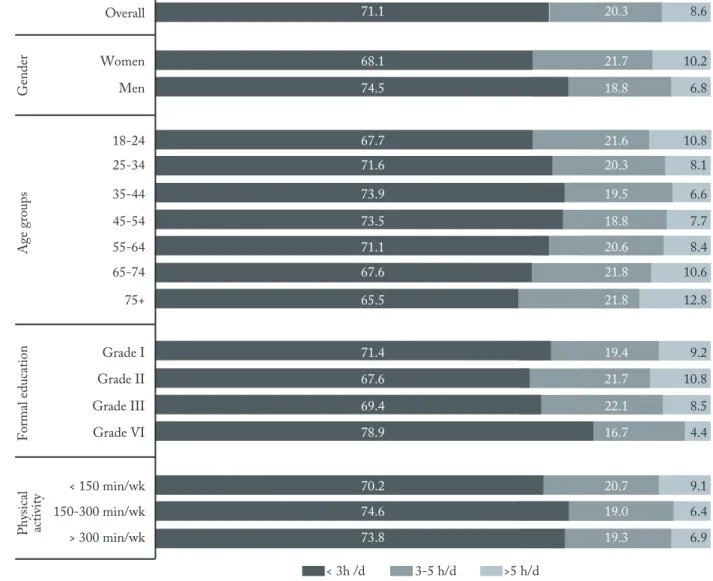
The distribution of TV-viewing time is presented in Figure 1. From the whole sample, 29.0% spent at least 3 h/day watching TV, with more than 8% re-porting more than 5 h/day watching TV in a normal day. Overall, women and more educated participants reported more TV-viewing time than men and less educated participants, respectively. There was a slightly inverse association between physical activity practice and TV-viewing time.
The association between age, education and physical activity and high TV-viewing time for men and women is presented in Table 1. Overall, the prevalence of high TV-viewing time among men varied by age group. Par-ticipants aged between 25 and 54 years were those with the lowest prevalence of high TV-viewing. The propor-tion of men that spent > 3h/day varied according to education level (left side of Table 1), where those in Grade II and Grade III presented higher prevalence compared to Grade I and Grade IV. Among women, those aged between 35 and 64 were those with lower prevalence high TV-viewing. The proportion of women that spent > 3h/day was lower among high-educated women than their counterparts (right side of Table 1). There was no clear association between physical activity and time spent high TV-viewing among women.
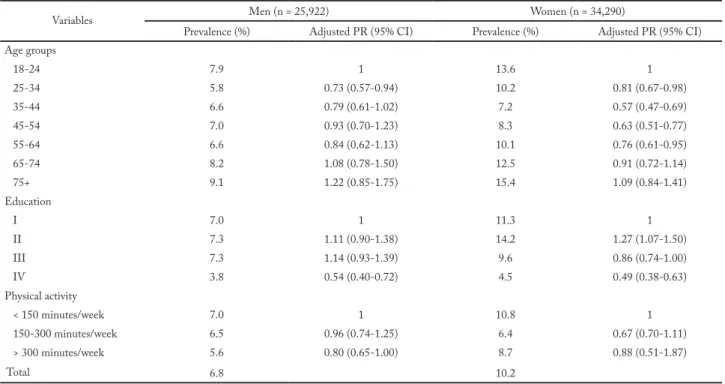
Table 2 shows prevalence of very-high TV-view-ing and its correlates for men and women. Very high
TV-viewing was not associated with age among men but was among women.
On the other hand, prevalence of very high TV-viewing was 46% and 51% lower among high edu-cated than their counterparts among men and women, respectively. Prevalence of very high TV-viewing was
slightly lower among men reporting more than 300 minutes per week on physical activity.
Discussion
One in three Brazilian adults spent more than 3 h/day watching TV and nine percent spent more than 5
hou-Table 1 – Prevalence of high television viewing time (> 3 hours/day) and factors associated for men and women according to age, education and physical activity. National Health Survey, Brazil, 2013 (n = 60,202).
Variables Men (n = 25,922) Women (n = 34,290)
Prevalence (%) Adjusted PR (95% CI) Prevalence (%) Adjusted PR (95% CI)
Age groups 18-24 29.7 1 34.9 1 25-34 24.6 0.85 (0.75-0.95) 32.1 0.97 (0.88-1.06) 35-44 24.8 0.89 (0.78-1.00) 27.3 0.82 (0.75-0.91) 45-54 23.2 0.84 (0.73-0.96) 29.4 0.88 (0.79-0.97) 55-64 24.6 0.90 (0.78-1.05) 32.6 0.97 (0.88-1.08) 65-74 26.9 1.01 (0.86-1.20) 36.8 1.08 (0.96-1.22) 75+ 27.2 1.05 (0.86-1.27) 39.9 1.16 (1.02-1.32) Education I 23.6 1 33.3 1 II 28.2 1.21 (1.08-1.35) 36.7 1.14 (1.06-1.24) III 28.4 1.24 (1.13-1.36) 32.5 1.03 (0.96-1.10) IV 20.4 0.89 (0.77-1.03) 21.6 0.70 (0.63-0.78) Physical activity < 150 minutes/week 25.5 1 33.2 1 150-300 minutes/week 25.9 0.98 (0.87-1.11) 24.8 0.79 (0.71- 0.89) > 300 minutes/week 25.5 0.95 (0.85-1.06) 27.1 0.86 (0.77-0.95) Total 25.5 31.9
Table 2 – Prevalence of very high television viewing time (> 5 hours/day) and factors associated for men and women according to age, educa-tion and physical activity. Naeduca-tional Health Survey, Brazil, 2013 (n = 60,202).
Variables Men (n = 25,922) Women (n = 34,290)
Prevalence (%) Adjusted PR (95% CI) Prevalence (%) Adjusted PR (95% CI)
Age groups 18-24 7.9 1 13.6 1 25-34 5.8 0.73 (0.57-0.94) 10.2 0.81 (0.67-0.98) 35-44 6.6 0.79 (0.61-1.02) 7.2 0.57 (0.47-0.69) 45-54 7.0 0.93 (0.70-1.23) 8.3 0.63 (0.51-0.77) 55-64 6.6 0.84 (0.62-1.13) 10.1 0.76 (0.61-0.95) 65-74 8.2 1.08 (0.78-1.50) 12.5 0.91 (0.72-1.14) 75+ 9.1 1.22 (0.85-1.75) 15.4 1.09 (0.84-1.41) Education I 7.0 1 11.3 1 II 7.3 1.11 (0.90-1.38) 14.2 1.27 (1.07-1.50) III 7.3 1.14 (0.93-1.39) 9.6 0.86 (0.74-1.00) IV 3.8 0.54 (0.40-0.72) 4.5 0.49 (0.38-0.63) Physical activity < 150 minutes/week 7.0 1 10.8 1 150-300 minutes/week 6.5 0.96 (0.74-1.25) 6.4 0.67 (0.70-1.11) > 300 minutes/week 5.6 0.80 (0.65-1.00) 8.7 0.88 (0.51-1.87) Total 6.8 10.2
rs per day in this behaviour. Although previous studies have shown the prevalence of high TV viewing and its correlates in Brazil10, 13, this study is the first to report
in detail the correlates of high and very high TV vie-wing among Brazilian adults, based on a representative sample from a nationwide survey.
It was found that high television viewing time (> 3 hours/day) was more prevalent among elderly women. Different sociocultural aspects should be considered on the interpretation of this findings. Limitations posed by age and decrease on functional capacity could contrib-ute to enjoyment of safer forms of leisure, such as tele-vision viewing time18. Furthermore, environmental
as-pects and the lack of options of leisure activities, might drive the choice for spending leisure watching TV.
By contrast, among men and women, no linear as-sociations between age and high TV-viewing time (> 3 hours/day) were observed. Comparable results were observed by Kikuchi et al.19 in a sample of Japanese.
On the other hand, it was observed that younger men were less likely to spend more than 5 hours/day watch-ing TV than their counterparts. Generally, men agwatch-ing 25-40 years old are those in the in-age group (25-34 years old) are considered to be ideal for good job per-formance which could be related to less TV viewing time. In addition, the practice of physical activity tends to be higher in young men and could be related to less TV time in this population group.
Previous studies have also found a strong inverse as-sociation between socioeconomic position and televi-sion time10, 20-21. These findings will reflect the complex
social determination of sedentary behaviour, reflecting a range of macro determinants rather than individual choices. For example, the fact of high amounts of tel-evision time among low socioeconomic groups might be related to availability of leisure options, which are restricted to TV on other sedentary options.
Regarding physical activity, our results indicate that those who are physically active have lower prevalence of high and very high watch television viewing than do those who are physically inactive. Also, active wom-en spwom-ent less time watching TV, although it was not clear for highly active women (more than 300 min/ week). This result might suggests a compensatory ef-fect, presenting a possible increase of television view-ing through the day among those highly active22. This
pattern is also observed among youth, where even 6 hours after a single bout of physical activity, there is a decrease in moderate and vigorous physical activity
and increases in sedentary time23. Among men, in the
present study this relationship showed no significant associations.
Some limitations should be considered. First, the self-report nature of the measures used might intro-duce bias that influences the overall prevalence of our outcome, with such bias potentially being different in unknown ways by social group. Additionally, sedentary behaviour was analysed by considering only TV view-ing. The role of TV viewing time on the amount of total sedentary time has been investigated and studies inves-tigating correlates of sedentary behaviour have shown that patterns of sedentary time vary by life domain and that correlates of TV time tend to differ from all other domains10. These particularities should be considered,
especially by the planning of interventions where the success might be related to focus specificities of popu-lation groups.
In Brazil, time trends data from 2006 to 2012 of the state capitals showed that the prevalence of high TV-viewing among adults consistently decreased14.
However, this change and reduction of TV viewing over the years, might suggest that people are replacing televi-sion time with different forms of screen time, including Internet use, time spent looking at phones or tablets, and other forms of sedentary behaviour. It is important to consider that, by measuring only TV-viewing, an im-portant proportion of sedentary time, especially among those with higher education level other important fac-tors may not be being identified. However, TV viewing is still the predominant source of sedentary behaviour among the poor in Brazil11.
These findings should be also interpreted consid-ering the economic and demographic transitions that have been occurring in Brazil in the past years. It is expected that education and income levels of Brazilian population will increase, what could lead a decrease on TV-viewing time. On the other hand, with better in-come, additional opportunities for being sedentary at leisure time would be available. Also, with population aging in Brail and limitations imposed by age is also expected that sedentary behaviour and TV-viewing time would will increase.
In conclusion, these national data from a large mid-dle-income country show that prevalence of high TV viewing time suggests the need to implement actions to decrease TV viewing time at population level in Bra-zil. It is important to include a more broadly evaluation of sedentary behaviour and continue assessing TV and
Quote this article as:
Mielke GE, Ricardo L, Wendt, Christofaro DGD, Owen N. Descriptive epidemiology of high TV-viewing time in Brazilian adults. Rev Bras Ati Fis Saúde. 2018;23:e0020. DOI: 10.12820/rbafs.23e0020
other domains of sedentary time in Brazil. With a more comprehensive understanding of sedentary time pat-terns in Brazil, the development of strategies and poli-cies designed to provide more-active leisure time oppor-tunities – both increasing levels of physical activity and decreasing sedentary time will be the optimal approach.
Conflict of interest
The authors declare no conflict of interest.
Authors’contribution
Mielke GI, conceived, analysed data and drafted the first version of the paper. Ricardo L, Wendt A, Christofaro DGD and Owen N, have made substantial contributions to conception of analytic plans, drafting the article, and revising it critically for important intellectual content. All authors have approved the final version.
References
1. Sallis JF, Bull F, Guthold R, Heath GW, Inoue S, Kelly P, et al. Progress in physical activity over the Olympic quadrennium. Lancet. 2016;388(10051):1325-36.
2. Ekelund U, Steene-Johannessen J, Brown WJ, Fagerland MW, Owen N, Powell KE, et al. Does physical activity attenuate, or even eliminate, the detrimental association of sitting time with mortality? A harmonised meta-analysis of data from more than 1 million men and women. Lancet. 2016;388(10051):1302-10.
3. Ekelund U. Commentary: Too much sitting: a public health threat? Int J Epidemiol. 2012;41(5):1353-55.
4. Healy GN, Dunstan DW, Salmon J, Cerin E, Shaw JE, Zimmet PZ, Owen N. Objectively measured light-intensity physical activity is independently associated with 2-h plasma glucose. Diabetes Care. 2007;30:1384-89.
5. Pate RR, O’Neill JR, Lobelo F. The evolving definition of “sedentary”. Exerc Sport Sci Rev. 2008,36:173-78.
6. Owen N, Healy GN, Matthews CE, Dunstan DW. Too much sitting: the population health science of sedentary behavior. Exerc Sport Sci Rev. 2010,38:105-13.
7. Katzmarzyk PT, Church TS, Craig CL, Bouchard C. Sitting time and mortality from all causes, cardiovascular disease, and cancer. Med Sci Sports Exerc. 2009,41:998-1005.
8. Thorp AA, Owen N, Neuhaus M, Dunstan DW. Sedentary behaviors and subsequent health outcomes in adults a systematic review of longitudinal studies, 1996-2011. Am J Prev Med. 2011;41:207-15.
9. Clark BK, Sugiyama T, Healy GN, Salmon J, Dunstan DW, Shaw JE, et al. Socio-demographic correlates of prolonged television viewing time in Australian men and women: the AusDiab study. J Phys Act Health. 2010;7(5):595-01. 10. Mielke GI, da Silva ICM, Owen N, Hallal PC. Brazilian
adults’ sedentary behaviors by life domain: population-based study. PLoS ONE. 2014;9(3):e91614.
11. Harvey JA, Chastin SF, Skelton DA. Prevalence of sedentary behavior in older adults: a systematic review. Int J Environ Res Public Health. 2013;10(12):6645-61.
12. Duncan MJ, Vandelanotte C, Caperchione C, Hanley C, Mummery WK. Temporal trends in and relationships between screen time, physical activity, overweight and obesity. BMC Public Health. 2012;12(1):1060.
13. Mielke GI, Hallal PC, Rodrigues GBA, Szwarcwald CL, Santos FV, Malta DC. Prática de atividade física e hábito de assistir à televisão entre adultos no Brasil: Pesquisa Nacional de Saúde 2013. Epidemiol Serv Saúde. 2015;24(2):277-86. 14. Mielke GI, Hallal PC, Malta DC, Lee IM. Time trends of
physical activity and television viewing time in Brazil: 2006-2012. Int J Behav Nutr Phys Act. 2014;11:101.
15. Szwarcwald CL, Malta DC, Pereira CA, Vieira MLFP, Conde WL, Souza Júnior PRB, et al. Pesquisa Nacional de Saúde no Brasil: concepção e metodologia de aplicação. Cienc Saude Coletiva. 2014;19(2):333-42.
16. Instituto Brasileiro de Geografia e Estatística. Pesquisa Nacional de Saúde 2013: percepção do estado de saúde, estilos de vida e doenças crônicas [Internet]. Rio de Janeiro: IBGE; 2014 [citado 2015 jan 8]. Disponível em: www.ibge. gov.br/PNS/2013/pns2013.pdf.
17. Global recommendations on physical activity for health. 2010, World Health Organization, Geneva, Switzerland; 2010. Available from: https://www.ncbi.nlm.nih.gov/books/ NBK305060/.
18. DiPietro L, Jin Y, Talegawkar S, Matthews CE. The joint associations of sedentary time and physical activity with mobility disability in older people: The NIH-AARP Diet and Health Study. J Gerontol A Biol Sci Med Sci. 2017;73(4):532-38.
19. Kikuchi H, Inoue S, Sugiyama T, Owen N, Oka K, Shimomitsu T. Correlates of prolonged television viewing time in older Japanese men and women. BMC Public Health. 2013;13:213.
20. Bauman A, Ainsworth BE, Sallis JF, Hagstromer M, Craig CL, et al. The descriptive epidemiology of sitting a 20-country comparison using the International Physical Activity Questionnaire (IPAQ). Am J Prev Med. 2011;41:228-35. 21. Stamatakis E, Hillsdon M, Mishra G, Hamer M, Marmot
M. Television viewing and other screen-based entertainment in relation to multiple socioeconomic status indicators and area deprivation: The Scottish Health Survey. J Epidemiol Community Health. 2003;63:734-40.
22. Salmon J, Bauman A, Crawford D, Timperio A, Owen N. The association between television viewing and overweight among Australian adults participating in varying levels of leisure-time physical activity. Int J Obes Relat Metab Disord. 2000;24(5):600-06.
23. Paravidino VB, Mediano MF, Sichieri R. Does a single bout of exercise influence subsequent physical activity and sedentary time in overweight boys? Physiol Behav. 2017;173:231-35.
Recebido: 12/02/2018 Aprovado: 13/08/2018