TCD
9, 6003–6024, 2015Two cases of aerodynamic adjustment of
sastrugi
C. Amory et al.
Title Page
Abstract Introduction
Conclusions References
Tables Figures
◭ ◮
◭ ◮
Back Close
Full Screen / Esc
Printer-friendly Version Interactive Discussion
Discussion
P
a
per
|
Discussion
P
a
per
|
Discussion
P
a
per
|
Discussion
P
a
per
|
The Cryosphere Discuss., 9, 6003–6024, 2015 www.the-cryosphere-discuss.net/9/6003/2015/ doi:10.5194/tcd-9-6003-2015
© Author(s) 2015. CC Attribution 3.0 License.
This discussion paper is/has been under review for the journal The Cryosphere (TC). Please refer to the corresponding final paper in TC if available.
Two cases of aerodynamic adjustment of
sastrugi
C. Amory1,2,3,4, F. Naaim-Bouvet3,4, H. Gallée1,2, and E. Vignon1,2
1
Univ. Grenoble Alpes, LGGE, 38041 Grenoble, France 2
CNRS, LGGE, UMR5183, 38401 Grenoble, France 3
Univ. Grenoble Alpes, IRSTEA, 38041 Grenoble, France 4
IRSTEA, UR ETNA, 38402 Saint-Martin d’Hères, France
Received: 14 October 2015 – Accepted: 20 October 2015 – Published: 2 November 2015
Correspondence to: C. Amory (amory@lgge.obs.ujf-grenoble.fr)
Published by Copernicus Publications on behalf of the European Geosciences Union.
TCD
9, 6003–6024, 2015Two cases of aerodynamic adjustment of
sastrugi
C. Amory et al.
Title Page
Abstract Introduction
Conclusions References
Tables Figures
◭ ◮
◭ ◮
Back Close
Full Screen / Esc
Printer-friendly Version Interactive Discussion
Discussion
P
a
per
|
Discussion
P
a
per
|
Discussion
P
a
per
|
Discussion
P
a
per
|
Abstract
In polar regions, sastrugi are a direct manifestation of wind driven snow and form the main surface roughness elements. In turn, sastrugi influence the local wind field and associated aeolian snow mass fluxes. Little attention has been paid to these feed-back processes, mainly because of experimental difficulties, and, as a result most
po-5
lar atmospheric models currently ignore sastrugi. More accurate quantification of the influence of sastrugi remains a major challenge. In the present study, wind profiles and aeolian snow mass fluxes were analyzed jointly on a sastrugi covered snowfield in Antarctica. Neutral stability 10 m air-snow drag coefficients CDN10 were computed
from six level wind speed profiles collected in Adélie Land during austral winter 2013.
10
The aeolian snow mass flux in the first meter above the surface of the snow was also measured using a windborne snow acoustic sensor. This paper focuses on two cases during which sastrugi responses to shifts in wind direction were evidenced by varia-tions in snow mass flux and drag coefficients. Using this dataset, it was shown that (i) the timescale of sastrugi aerodynamic adjustment can be as short as 3 h for
fric-15
tion velocities of 1 m s−1 or above and during strong windborne snow conditions, (ii)
CDN10 values were in the range of 1.3–1.5×10 3
when the wind was well aligned with the sastrugi and increased to 3×10³ or higher when the wind only shifted 20–30◦, (iii)
CDN10can increase (to 120 %) and the aeolian snow mass flux can decrease (to 80 %)
in response to a shift in wind direction, and (iv) knowingCDN10is not sufficient to
esti-20
mate the erosion flux that results from drag partitioning at the surface becauseCDN10
includes the contribution of the sastrugi form drag. These results not only support the existence of feedback mechanisms linking sastrugi, aeolian particle transport and sur-face drag properties over snow sursur-face but also provide orders of magnitude, although further measurements including continuous accurate descriptions of the sastrugi field
25
TCD
9, 6003–6024, 2015Two cases of aerodynamic adjustment of
sastrugi
C. Amory et al.
Title Page
Abstract Introduction
Conclusions References
Tables Figures
◭ ◮
◭ ◮
Back Close
Full Screen / Esc
Printer-friendly Version Interactive Discussion
Discussion
P
a
per
|
Discussion
P
a
per
|
Discussion
P
a
per
|
Discussion
P
a
per
|
1 Introduction
In polar regions, sastrugi are a direct manifestation of wind-driven snow. Sastrugi are elongated metric-scale ridges of wind-packed snow whose longitudinal axis is parallel to the prevailing wind at the time of their formation. These erosional surface roughness features are very widespread over the Antarctic ice sheet (Kotlyakov, 1961) where they
5
can be major determinants of surface roughness (Jackson and Carroll, 1978; Inoue, 1989; Andreas, 1995; Andreas and Claffey, 1995). Sastrugi orientations have been recognized as useful indicators of the Antarctic near-surface wind direction (Mather, 1962, 1969; Mather and Miller, 1966; Rémy et al., 1992; Long and Drinkwater, 2000) in agreement with continent-scale modeling studies (Parish and Bromwich, 1987, 2007;
10
Van Lipzig et al., 2004).
The development of sastrugi depends on the ability of snow to be eroded and thus on the threshold velocity needed to lift snow particles from the surface. In the literature, aeolian erosion thresholds have been reported to vary over a wide range of values depending on diverse parameters such as temperature, time of sintering, snow
cohe-15
sion or snow density, all of which are interrelated. From observations in Antarctica, Mellor (1965) reported that 10 m wind speeds of 3 to 8 m s−1 are strong enough to cause aerodynamic entrainment of loose, unbounded snow, whereas winds exceeding 30 m s−1 are needed to erode snow consolidated by the freeze–thaw process. Budd et al. (1966) suggested a high threshold wind speed (14 m s−1) was needed to trigger
20
snow transport in the cold environment of Byrd station. Schmidt (1980) reported that the threshold wind speed increases with the time since snow deposition, and that the colder the temperature, the greater but slower the decline in the increase rate over time. Schmidt (1982) also showed that the cohesion of the snow surface determines the threshold speed required for snow erosion to occur. In Antarctica, Bromwich (1988)
25
highlighted a seasonal contrast between winter threshold wind speeds of 7 m s−1 and higher thresholds of more than 13 m s−1 in summer because of greater surface adhe-sion. Pomeroy et al. (1993) identified significantly lower thresholds for fresh, loose, dry
TCD
9, 6003–6024, 2015Two cases of aerodynamic adjustment of
sastrugi
C. Amory et al.
Title Page
Abstract Introduction
Conclusions References
Tables Figures
◭ ◮
◭ ◮
Back Close
Full Screen / Esc
Printer-friendly Version Interactive Discussion
Discussion
P
a
per
|
Discussion
P
a
per
|
Discussion
P
a
per
|
Discussion
P
a
per
|
snow than for older, wind hardened, dense or wet snow. Yong and Metaxas (1985) referred to age hardening to describe a measured increase in the density of natural fresh snow from 100 kg m−3 to 300 and 400 kg m−3 after respectively 30 and 50 days at a relatively constant temperature of−13◦C. Gray and Morland (1995) reported that
snow compaction (related to snow density) increases rapidly after deposition due to
5
the thermal processes of metamorphism (i.e. changes in snow structure over time). Li and Pomeroy (1997) discussed the major role of temperature in surface erodibility (i.e. the potential of a surface to be eroded; Shao, 2008) and showed an empirical but gen-erally positive correlation between threshold wind speed and air temperature on the prairies of western Canada. From the work of Guyomarc’h and Mérindol (1998), Gallée
10
et al. (2001) developed an aeolian snow transport model that takes metamorphism into account by allowing the threshold condition for erosion to vary with the properties of the snow such as density, dendricity, sphericity and particle size. All studies suggest that the physical properties of the snow play a major role in the formation of sastrugi.
Sastrugi contribute to the drag exerted on the atmosphere over the snow surface
15
and enhance interactions at the air–snow interface compared to over a smooth snow surface. Rougher snow surfaces favor the generation of turbulence in the near sur-face air stream that is likely to further increase the wind driven snow mass flux (Das et al., 2013). On the other hand, sastrugi are responsible for a loss of wind momentum through pressure fluctuation gradients in their immediate vicinity (sastrugi form drag)
20
that directly reduces the energy budget available for erosion of snow. This attenuating effect on snow erosion is taken into account in the coupled atmosphere-snowpack-aeolian snow transport model MAR (Galleé et al., 2013) and was parametrized as in Marticorena and Bergametti (1995). By comparing observed and simulated aeolian snow mass fluxes over Adélie Land using MAR, Amory et al. (2015) showed that in the
25
TCD
9, 6003–6024, 2015Two cases of aerodynamic adjustment of
sastrugi
C. Amory et al.
Title Page
Abstract Introduction
Conclusions References
Tables Figures
◭ ◮
◭ ◮
Back Close
Full Screen / Esc
Printer-friendly Version Interactive Discussion
Discussion
P
a
per
|
Discussion
P
a
per
|
Discussion
P
a
per
|
Discussion
P
a
per
|
with respect to the main sastrugi axis. Based on measurements of wind speed and tem-perature profile in the atmospheric surface layer at the South Pole, Jackson and Carroll (1978) reported that sastrugi form drag was essentially absent when the wind was per-fectly aligned with the sastrugi up to a height of 50 cm. As the wind rotated, sastrugi form drag increased, to reach maximum when the wind direction was perpendicular to
5
the prior sastrugi pattern. These authors developed an idealized single sastruga model from Lettau’s (1969) findings to reproduce their observations. Using another analytical sastruga model adapted from Raupach (1992), Andreas (1995) also found a minimum and a maximum drag for wind directions respectively parallel and perpendicular to the sastruga longitudinal axis.
10
However, these modeling efforts were undertaken without accounting for the erodible character of sastrugi or for their possible reorganization when realigning with persistent (erosive) winds blowing transversally to their elongated sidewalls. If the crosswise flow continues from a relatively constant direction thereby allowing sufficient shear stress to dislodge snow surface particles, sastrugi can adjust aerodynamically; transversal
sas-15
trugi are eroded, and new streamlined sastrugi form parallel to the mean wind (Andreas and Claffey, 1995). This results in a gradual decrease in the contribution of the sastrugi to the total surface drag, and hence in an increase in erosion efficiency. Andreas and Claffey (1995) reported that the timescale for this streamlining process on Weddell Sea ice in winter was about half a day with 6–8 m s−1winds, but might be shorter if the winds
20
are stronger. To date, no observational study has provided quantitative insight into the potential effect of erodible roughness elements of the snow surface on snow erosion.
Quantifying the variable influence of sastrugi on the local wind field and associated surface drag could improve parameterization of surface roughness and erosion in polar atmospheric models that currently ignore sastrugi. The present paper focuses on two
25
erosion events during which sastrugi responses to shifts in wind direction were inter-preted from temporal variations in both measured drag and aeolian snow mass flux in coastal Adélie Land during austral winter 2013.
TCD
9, 6003–6024, 2015Two cases of aerodynamic adjustment of
sastrugi
C. Amory et al.
Title Page
Abstract Introduction
Conclusions References
Tables Figures
◭ ◮
◭ ◮
Back Close
Full Screen / Esc
Printer-friendly Version Interactive Discussion
Discussion
P
a
per
|
Discussion
P
a
per
|
Discussion
P
a
per
|
Discussion
P
a
per
|
2 Data and method
2.1 Field area
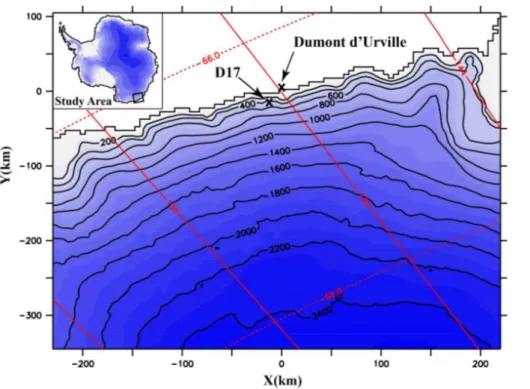
Site D17 (66.7◦S, 139.9◦E; ∼450 m a.s.l.) is located about 10 km inland in a coastal
accumulation zone of Adélie Land (Agosta et al., 2012), roughly 15 km southwest of the permanent French station Dumont d’Urville (Fig. 1). An annual temperature of−10.8◦C
5
and a mean wind of around 10 m s−1 have been reported at Dumont d’Urville station (König-Langlo et al., 1998). The measurement area consists in a gently sloping snow-field with a long unobstructed upstream fetch several hundred kilometers over a uni-form snow surface. Local topographic channeling acts together with the Coriolis force to produce southeasterly flows all year round that result either from pure katabatic or
10
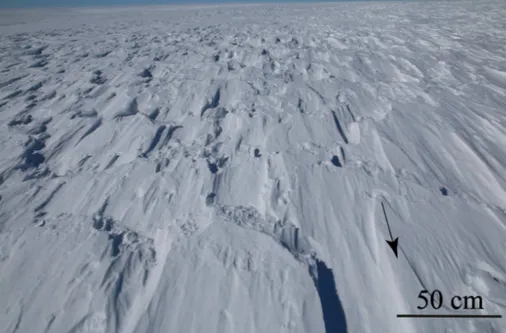
combined katabatic-synoptic forcings (Parish et al., 1993; Naithani et al., 2001). Site D17 is visited only during summer (December to February), when the pres-ence of sastrugi is often reported. Frequent strong winds combined with the permanent snow surface lead to frequent aeolian snow transport events (Trouvilliez et al., 2014), thereby favoring aerodynamic adjustment of the snow surface. This results in a net
15
south-southeast orientation of the sastrugi (Fig. 2).
2.2 Instrumentation
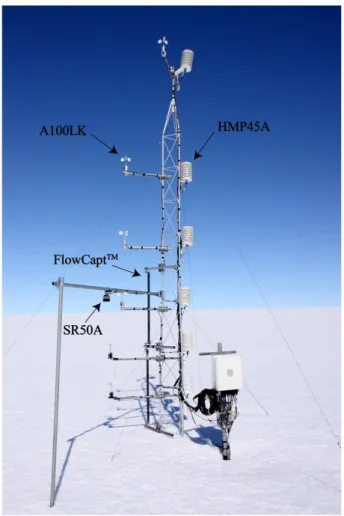
The measurement structure deployed at site D17 is a 7 m high meteorological mast. Wind speed, relative humidity and air temperature are recorded along the mast at 6 logarithmically spaced intervals between 0.8 and 7 m above the snow surface using
20
Vector A100LK cup anemometers and HMP45A thermo-hygrometers installed in nat-urally ventilated MET21 radiation shields (Fig. 3). The anemometers are mounted on roughly 1 m long booms pointing southeastward. Wind direction was only sampled at the upper level by a Vector W200P wind vane. Surface level variations were measured by a Campbell SR50A acoustic depth gauge. Information on windborne snow was
ob-25
TCD
9, 6003–6024, 2015Two cases of aerodynamic adjustment of
sastrugi
C. Amory et al.
Title Page
Abstract Introduction
Conclusions References
Tables Figures
◭ ◮
◭ ◮
Back Close
Full Screen / Esc
Printer-friendly Version Interactive Discussion
Discussion
P
a
per
|
Discussion
P
a
per
|
Discussion
P
a
per
|
Discussion
P
a
per
|
close to the ground to allow detection of the beginning of aeolian snow transport events. The sensor is a 1 m long tube that converts the acoustic pressure caused by snow par-ticles impacting the tube into an aeolian snow mass flux integrated over the length of the tube. The second-generation FlowCapt™was evaluated in the French Alps by Trou-villiez et al. (2015). The authors reported that the instrument underestimates values,
5
especially in presence of snowfall. As it does not distinguish between the occurrence of simultaneous precipitation and pure erosion events, integrated fluxes given by the second-generation Flowcapt™should be considered as lower bound values. Neverthe-less, the equivocal behavior of the second-generation FlowCapt™ does not affect its ability to accurately detect the occurrence of aeolian snow transport. Data were
sam-10
pled at 15 s intervals, averaged to half-hourly means and stored in a Campbell CR3000 datalogger.
2.3 The 10 m drag coefficient in near-neutral conditions
Computing the drag coefficient (CD) is a convenient way to estimate the local drag
exerted by the surface on the overlying air. CD can be computed by measuring the
15
vertical wind speed gradient (profile method) under near-neutral conditions following the Monin–Obukhov similarity theory. Assuming stationarity and horizontal homogene-ity when the atmospheric surface layer is statically neutral, the wind speed profile is semilogarithmic and can be written as
U(z)=uκ∗ln
z
z0
(1)
20
whereU(z) is the average wind speed as a function of heightz,κ is the von Kármán constant (taken as 0.4),z0is the aerodynamic roughness length, andu∗the friction
ve-locity describing the wind shear at the surface and is related to the vertical momentum flux at the surface (τ; also known as Reynolds shear stress)
τ=ρu2∗ =−ρuw=ρCDNzUz2 (2)
25
TCD
9, 6003–6024, 2015Two cases of aerodynamic adjustment of
sastrugi
C. Amory et al.
Title Page
Abstract Introduction
Conclusions References
Tables Figures
◭ ◮
◭ ◮
Back Close
Full Screen / Esc
Printer-friendly Version Interactive Discussion
Discussion
P
a
per
|
Discussion
P
a
per
|
Discussion
P
a
per
|
Discussion
P
a
per
|
where ρ is the air density, u and w are fluctuations in the longitudinal and vertical turbulent velocity, respectively, andCDNzandUzare the neutral-stability drag coefficient
and the average wind speed at heightz, respectively. The overbar stands for a time average. CDN is usually discussed at a standard reference height of 10 m (CDN10).
From Eqs. (2) and (3), it follows that
5
CDN10=
κ ln
10
z0
2
(3)
withz0expressed in meters. HereCDN10andz0are two equivalent quantities for
evalu-ating the momentum exchange at the air–snow interface that results from the integrated (in space and time) turbulent drag caused by the roughness elements.
The wind profiles used to computeCDN10were selected following a strict procedure.
10
After discarding icing or malfunctioning cases and half-hourly runs for which a rare (northwesterly) flow was likely to be disturbed by the measurement structure, sta-tionary conditions were selected by requiring that temperature changes between two consecutive half-hourly runs not exceed 0.3 K, as suggested by Joffre (1982). Near-neutral conditions were then selected requiring U >5 m s−1 and an absolute value of
15
the bulk Richardson number below 10−2. The last selection criterion was applied fol-lowing a suggestion by Andreas and Claffey (1995) that demands
6
P
i=1
U(zi)−(u∗/κ) ln(zi/z0)
2
u2 ∗
≤ε, (4)
whereε is an empirical constant determined from visual inspection of the observed wind speed profiles. Here it was set to 0.15. Wind profiles that survived this filtering
20
process were fitted Eq. (1) using a least-square log-linear regression technique, where
z0and
u∗
κ ln (z0) are the regression coefficients. All of them yielded a correlation coeffi
TCD
9, 6003–6024, 2015Two cases of aerodynamic adjustment of
sastrugi
C. Amory et al.
Title Page
Abstract Introduction
Conclusions References
Tables Figures
◭ ◮
◭ ◮
Back Close
Full Screen / Esc
Printer-friendly Version Interactive Discussion
Discussion
P
a
per
|
Discussion
P
a
per
|
Discussion
P
a
per
|
Discussion
P
a
per
|
3 Results
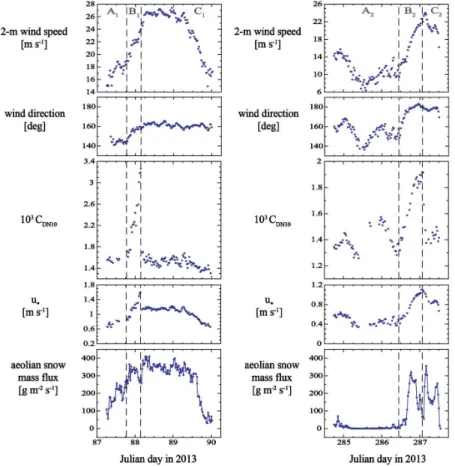
The two erosion events depicted in Fig. 4 occurred respectively in March (left pan-els) and October (right panpan-els), 2013, during fairly constant wind direction conditions, which persisted after a wind shift of a few tens of degrees. The 2 m wind speed, wind direction, profiled-derivedCDN10values and aeolian snow mass flux recovered by the
5
second-generation FlowCapt™sensor are shown in Fig. 4. As the friction velocity is the actual dynamic quantity involved in aerodynamic entrainment of surface snow particles (Gallée et al., 2001), it is also plotted on the graph. The two events are split into three parts, before (Ai), during (Bi) and after (Ci) the shift in wind direction. Operational anal-yses of the European Center for Medium-Range Weather Forecasts related to the fully
10
continental grid point (horizontal resolution of∼16 km), which includes D17, indicated that precipitation rates were negligible during both events.
At the beginning of Julian day (JD) 87 (part A1), the wind direction was around 140◦, the friction velocity was above the erosion threshold with a related aeolian snow mass flux of 100 g m−2s−1, andCDN10was near 1.5×10
−3
. At the end of JD 87 (part B1), the
15
wind rotated toward 160◦ while CDN10increased to nearly 3.3×10 −3
, i.e. by 120 %, in response to a wind shift of only 20◦. As assumed in Jackson and Carroll (1978) and Andreas and Claffey (1995), it is likely that as the wind turned, it was deflected from the mean sastrugi axis, thereby encountering a rougher surface. As a result,CDN10soared,
reflecting the growing contribution of the sastrugi form drag to the vertical momentum
20
flux at the surface, and hence to the total surface drag. Within the same time frame, the measured aeolian snow mass flux fell by∼30 % from 365 to 260 g m−2s−1, despite
increasing friction velocity (wind speed) from 0.7 to 1.6 (18 to 24) m s−1. Then, until the end of the event (part C1), the wind direction remained centered about 160
◦
. From 03:30 to 06:30 UT on JD 88,CDN10 fell back to 1.5×10
−3
as high winds presumably
25
streamlined the surface. In other words,CDN10 was reduced by∼50 % in only 3 h. As
CDN10 decreased, the aeolian snow mass flux again rose above 400 g m −2
s−1. The erosion event lasted through JD 90 whenu∗ (wind speed) dropped to 0.7 (15) m s
−1
TCD
9, 6003–6024, 2015Two cases of aerodynamic adjustment of
sastrugi
C. Amory et al.
Title Page
Abstract Introduction
Conclusions References
Tables Figures
◭ ◮
◭ ◮
Back Close
Full Screen / Esc
Printer-friendly Version Interactive Discussion
Discussion
P
a
per
|
Discussion
P
a
per
|
Discussion
P
a
per
|
Discussion
P
a
per
|
causing a significant decrease in the aeolian snow mass flux. After nearly 48 h of per-sistent erosive winds,CDN10was as low as 1.3×10
−2
.
During the two days that preceded the second erosion event (part A2), the wind
di-rection was within±10 of 150◦, the friction velocity was generally not strong enough
to erode the snow surface, andCDN10 was between 1.3–1.6×10 −3
. Then, the same
5
situation depicted in the left panels of Fig. 4 occurred again. At mid-JD 286 (part B2),
u∗increased beyond the erosion threshold as the wind rotated from 150 ◦
to 180◦. Con-sequently,CDN10increased to 1.9×10
−3
. The aeolian snow mass flux dropped simulta-neously from 320 to 55 g m−2s−1under increasing friction velocity. That is, for a∼30 % increase inCDN10as the result of a wind deflection of 30
◦
, the aeolian snow mass flux
10
decreased by ∼80 %. Together with the first case of erosion, this illustrates how the
form drag exerted by sastrugi can significantly affect snow erosion when the wind and sastrugi are not aligned (this effect is discussed later in the paper; see Sect. 4). Then (part C2), the wind direction remained roughly unchanged until erosion ceased. Again, the rise in aeolian snow mass flux coincided with a decrease in CDN10. After nearly
15
3 h of winds above 20 m s−1 (u∗>0.9 m s −1
) from 180◦, CDN10 fell from 1.9×10⁻³ to
1.4×10⁻³, i.e. decreased by∼30 %.
In summary, for friction velocities (wind speeds) around 1 (20) m s−1and above, the sastrugi streamlining timescale can be as fast as 3 h. For a windflow initially aligned with the sastrugi, a deviation of 20–30◦ from the streamlining direction has the potential to
20
both increaseCDN10by 30–120 % and to significantly reduce (up to 80 %) the aeolian
snow mass flux, even under increasing friction velocity.
4 Discussion
At Ice Station Weddell, Andreas and Claffey (1995) measured a decrease in CDN10 of
20–30 % in 12 h with considerably weaker winds (<12 m s−1) than those reported here.
25
TCD
9, 6003–6024, 2015Two cases of aerodynamic adjustment of
sastrugi
C. Amory et al.
Title Page
Abstract Introduction
Conclusions References
Tables Figures
◭ ◮
◭ ◮
Back Close
Full Screen / Esc
Printer-friendly Version Interactive Discussion
Discussion
P
a
per
|
Discussion
P
a
per
|
Discussion
P
a
per
|
Discussion
P
a
per
|
for winds exceeding 20 m s−1 (u∗>1 m s −1
), and the associated decrease in CDN10
can reach 50 %. Andreas and Claffey (1995) also proposed generic CDN10 values in
the range 1.5–1.7×10⁻³ when the wind is well aligned with the sastrugi, and around 2.5×10⁻³ when the wind is at an angle of 20◦ to the dominant orientation of the sas-trugi. In both cases, the present results differ slightly from these values: CDN10 was
5
more in the range 1.3–1.5×10⁻³ for sastrugi-parallel winds, and increased to more than 3×10⁻³ with wind shifts of similar amplitude. For a given set of snow particles, the quantity of windborne snow increased with wind strength according to a power law (Radok, 1977; Mann, 2000). As sastrugi mainly form through snow erosion/deposition processes (Filhol and Sturm, 2015), it is likely that under the strong wind (shear)
condi-10
tions in Adélie Land, rougher snow surfaces develop, whose aerodynamic adjustment ability is greater than at the less windy Ice Station Weddell.
It can be argued that friction velocity also influences the value ofCDN10. It is true that
changes in the wind during saltation are perceived by the flow as an increase in surface roughness due to the straight line extrapolations of the wind velocity on a log-linear plot
15
from above the saltation layer down toU=0 (Anderson and Haff, 1991; Bintanja, 2001). Therefore, the saltation layer behaves as solid roughness. Owen (1964) suggested that the aerodynamic roughness length should scale asu2∗/g, roughly the height to which
saltating particles are ejected. He wrote
z0=α
u2∗
g (5)
20
with α a constant and g the gravitational acceleration. However, aeolian snow mass flux peaks did not matchCDN10 peaks. Moreover, significant variations inCDN10 were
observed in the absence of aeolian snow transport (Part A2, Fig. 4). Here the height
of the saltation layer was probably not a major determinant of roughness parame-ters. Owen’s relation, which has often been invoked to describe momentum transfer
25
over mobile surfaces, would thus not be confirmed by our measurements. A
TCD
9, 6003–6024, 2015Two cases of aerodynamic adjustment of
sastrugi
C. Amory et al.
Title Page
Abstract Introduction
Conclusions References
Tables Figures
◭ ◮
◭ ◮
Back Close
Full Screen / Esc
Printer-friendly Version Interactive Discussion
Discussion
P
a
per
|
Discussion
P
a
per
|
Discussion
P
a
per
|
Discussion
P
a
per
|
parameter formulation forz0 as Eq. (5) is therefore innately incomplete, a conclusion
already reached by Raupach (1991) and Andreas and Claffey (1995).
During both erosion events, the FlowCapt™ sensor measured significant aeolian snow mass fluxes for 2 m wind speeds (u∗) of 10 (0.6) m s
−1
or above. As the wind (fric-tion) velocity likely frequently exceeds this threshold on the coastal slopes of Adélie
5
Land, the sastrugi alignment process might be also frequently active, depending on persistence of the wind. As explained in Sect. 1, this mechanism is probably also strongly controlled by the properties of the snow surface that determine the thresh-old shear stress required for erosion to begin rather than only the characteristics of the wind. Since the erosion flux is the integrated result of both the capacity of the wind to
10
erode and carry snow, and snow surface erodibility, the sastrugi streamlining timescale presumably mostly depends on this specific quantity. The implication is that the drag coefficient must be strongly related to other factors including the current wind orien-tation and the history of the wind’s interactions with the snow surface as well as past timescales and past temperatures of the snowpack.
15
On the other hand, the sastrugi streamlining timescale also appears to control snow erosion in the form of feedback by fixing the time during which the sastrugi form drag mainly contributes to total surface drag. With friction velocities above the snow erosion threshold, increasingu∗could be expected to result in an increase in erosion efficiency.
However, in both cases, the observations showed a significant decrease in the aeolian
20
snow mass flux in phase with an increase in the drag coefficient (Fig. 4, parts B). By analogy with measurements made in a water flume (Wiberg and Nelson, 1992; Le Bouteiller and Venditti, 2015), it can be considered that the flow and turbulence in the sastrugi region are the result of interaction between flow separation and wake formation, which can lead to a local Reynolds shear stress peak corresponding to
25
flow separation. Above the region of influence of the wake, named outer region, the flow has adjusted to increased roughness and exhibited a semilogarithmic profile, as shown by the relative continuous time series ofCDN10andu∗despite the strict selection
TCD
9, 6003–6024, 2015Two cases of aerodynamic adjustment of
sastrugi
C. Amory et al.
Title Page
Abstract Introduction
Conclusions References
Tables Figures
◭ ◮
◭ ◮
Back Close
Full Screen / Esc
Printer-friendly Version Interactive Discussion
Discussion
P
a
per
|
Discussion
P
a
per
|
Discussion
P
a
per
|
Discussion
P
a
per
|
measure, it cannot be extrapolated to the snow bed. The averaged snow bed shear stress (also referred to as skin friction in the literature), which is the ultimate parameter for aeolian erosion (Li and Shao, 2003), varies depending on its position along the sastrugi field. In absence of direct measurements, it is necessary to link outer shear stress, sastrugi geometry, and skin friction to be able to estimate aeolian snow mass
5
flux. For erodible forms in riverbeds such as ripples, Smith and McLean (1977) and later Wiberg and Nelson (1992) developed a method for partitioning the outer shear stress. These authors considered that the averaged bed shear stress is equal to the difference between the outer shear stress and the drag-related stress produced as the flow is forced around the bedform – i.e., in the present case, the form drag induced
10
by the sastrugi. As mentioned above, an increasing form drag can be expected, and hence a decrease in skin friction and in aeolian snow mass flux, when the wind direction gradually shifts away from the longitudinal axis of the sastrugi. BecauseCDN10reflects
the contribution of the sastrugi form drag, knowing the drag coefficient is not sufficient to estimate skin friction. A better knowledge of skin friction over a sastrugi field is
15
also needed to improve aeolian snow mass flux parameterizations in aeolian erosion models. The measurements made in the present study showed that a considerable decrease (even 80 %) of the aeolian snow mass flux can occur during the transitional regime during which the wind and sastrugi are not aligned (Fig. 4, parts B). But it should be also noted that the rapid aerodynamic adjustment of sastrugi (3 h) will limit errors if
20
the aeolian snow transport event considered is strong and sufficiently long.
5 Conclusions
An experimental meteorological dataset collected in coastal Adélie Land during austral winter 2013 was exploited to document surface turbulent fluxes of momentum and snow over an Antarctic sastrugi field. The main results of the analysis of two erosion events
25
can be summarized as follows:
TCD
9, 6003–6024, 2015Two cases of aerodynamic adjustment of
sastrugi
C. Amory et al.
Title Page
Abstract Introduction
Conclusions References
Tables Figures
◭ ◮
◭ ◮
Back Close
Full Screen / Esc
Printer-friendly Version Interactive Discussion
Discussion
P
a
per
|
Discussion
P
a
per
|
Discussion
P
a
per
|
Discussion
P
a
per
|
– the timescale for the aerodynamic adjustment of sastrugi can be as low as three hours for friction velocities of 1 m s−1or above and during strong windborne snow conditions,
– CDN10 values were in the range of 1.3–1.5×10³ when the wind was well aligned
with sastrugi and increased to 3×10³or higher with wind shifts of only 20–30◦,
5
– CDN10 and the aeolian snow mass may respectively increase (to 120 %) and
de-crease (to 80 %) in response to the wind shift in direction,
– becauseCDN10includes the contribution of the sastrugi form drag, knowingCDN10
is not sufficient to estimate the erosion flux that results from drag partitioning at the surface.
10
These results support the existence of mechanisms linking aeolian particle transport and surface drag properties over (Antarctic) snow, as already demonstrated for other erodible natural surfaces (Marticorena and Bergametti, 1995). In contrast with non-erodible roughness elements such as rocks or vegetation, these mechanisms involve the time needed for sastrugi to adjust to the main wind (3 h in both erosion events),
15
during which both the drag coefficient and the aeolian snow mass flux can be greatly modified. In comparison, Andreas and Claffey (1995) reported a longer timescale (12 h) for the sastrugi to realign with weaker winds. Because lighter winds are supposed to be associated with lower erosion fluxes, it is suggested that the sastrugi streamlining timescale most likely depends on the snow erosion flux.
20
Real-time observations would further advance understanding of the physical pro-cesses involved in the development of sastrugi and enable better characterization of sastrugi aerodynamic adjustment timescales. In addition, having a more accurate rep-resentation of the shape of sastrugi would make small-scale modeling in a wind tunnel possible, in which case, it would be possible to realistically estimate shear stress
par-25
re-TCD
9, 6003–6024, 2015Two cases of aerodynamic adjustment of
sastrugi
C. Amory et al.
Title Page
Abstract Introduction
Conclusions References
Tables Figures
◭ ◮
◭ ◮
Back Close
Full Screen / Esc
Printer-friendly Version Interactive Discussion
Discussion
P
a
per
|
Discussion
P
a
per
|
Discussion
P
a
per
|
Discussion
P
a
per
|
search project (Picard and Arnaud, LGGE, personal communication) and has been operating daily at Dome C in Antarctica since the beginning of 2015. These comple-mentary approaches are vital to improve parameterization schemes for aeolian snow transport models.
References
5
Amory, C., Trouvilliez, A., Gallée, H., Favier, V., Naaim-Bouvet, F., Genthon, C., Agosta, C., Piard, L., and Bellot, H.: Comparison between observed and simulated aeolian snow mass fluxes in Adélie Land, East Antarctica, The Cryosphere, 9, 1373–1383, doi:10.5194/tc-9-1373-2015, 2015.
Anderson, R. A. and Haff, P. K.: Wind modification and bed response during saltation of sand
10
in air, Acta Mech., 1, 21–51, 1991.
Andreas, E. L.: Air-ice drag coefficients in the western weddell sea, 2. a model based on form drag and drifting snow, J. Geophys. Res., 100, 4833–4843, 1995.
Andreas, E. L. and Claffey, K. J.: Air-ice drag coefficients in the western weddell sea, 1. Values deduced from profile measurements, J. Geophys. Res., 100, 4821–4831, 1995.
15
Bintanja, R.: Modification of the wind speed profile caused by snowdrift: results from observa-tions, Q. J. Roy. Meteor. Soc., 127, 2417–2434, doi:10.1002/qj.49712757712, 2001.
Bromwich, D. H.: Snowfall in high southern latitudes, Rev. Geophys., 26, 149–168, 1988. Budd, W. F.: The drifting of non-uniform snow particles, in: Studies in Antarctic Meteorology,
edited by: Rubin, M. J., Antarctic Research Series, Vol. 9, American Geophysical Union,
20
59–70, 1966.
Das, I., Bell, R. E., Scambos, T. A., Wolovick, M., Creyts, T. T., Studinger, M., Frearson, N., Nicolas, J. P., Lenaerts, J. T. M., and van den Broeke, M. R.: Influence of persistent wind scour on the surface mass balance of Antarctica, Nat. Geosci., 6, 367–371, 2013.
Filhol, S. and Sturm, M.: Snow bedforms: a review, new data and a formation model, J.
Geo-25
phys. Res., 120, 164–1669, 2015.
Gallée, H., Guyomarc’h, G., and Brun, É.: Impact of snow drift on the antarctic ice sheet surface mass balance: possible sensitivity to snow-surface properties, Bound.-Lay. Meteorol., 99, 1– 19, 2001.
TCD
9, 6003–6024, 2015Two cases of aerodynamic adjustment of
sastrugi
C. Amory et al.
Title Page
Abstract Introduction
Conclusions References
Tables Figures
◭ ◮
◭ ◮
Back Close
Full Screen / Esc
Printer-friendly Version Interactive Discussion
Discussion
P
a
per
|
Discussion
P
a
per
|
Discussion
P
a
per
|
Discussion
P
a
per
|
Gallée, H., Trouvilliez, A., Agosta, C., Genthon, C., Favier, V., and Naaim-Bouvet, F.: Transport of snow by the wind: a comparison between observations in Adélie Land, Antarctica, and simulations made with the regional climate model MAR, Bound.-Lay. Meteorol., 146, 133– 147, 2013.
Gray, J. T. and Morland, L. W.: The compaction of polar snow packs, Cold Reg. Sci. Technol.,
5
23, 109–119, 1995.
Guyomarc’h, G. and Merindol, L.: Validation of an application for forecasting blowing snow, Ann. Glaciol., 26, 138–143, 1998.
Inoue, J.: Surface drag over the snow surface of the Antarctic Plateau, 1: Factors controlling surface drag over the katabatic wind region, J. Geophys. Res., 94, 2207–2217, 1989.
10
Joffre, S. M.: Momentum and heat transfers in the surface layer over a frozen sea, Bound.-Lay. Meteorol., 24, 211–229, 1982.
König Langlo, G., King, J. C., and Pettré, P.: Climatology of the three coastal Antarctic stations Dumont d’Urville, Neumayer, and Halley, J. Geophys. Res., 103, 10935–10946, doi:10.1029/97JD00527, 1998.
15
Kotlyakov, V. M.: The Snow Cover of the Antarctic and its role in the Present-Day Glaciation of the Continent (Snezhni pokrov antarktidy i ego rol’ v somvremennom oledenenii materika), Translated from Russian 1966, Israel Program for Scientific Translation, Jerusalem, 256 pp., 1961.
Le Bouteiller, C. and Venditti, J. G.: Sediment transport and shear stress partitioning in a
vege-20
tated flow, Water Resour. Res., 51, 2901–2922, doi:10.1002/2014WR015825, 2015.
Lettau, H. H.: Note on aerodynamic roughness-parameter estimation on the basis of roughness element description, J. Appl. Meteorol., 8, 828–832, 1969.
Li, A. and Shao, Y.: Numerical simulation of drag partition over rough surfaces, Bound.-Lay. Meteorol., 108, 317–342, 2003.
25
Li, L. and Pomeroy, J. W.: Estimates of threshold wind speeds for snow transport using meteo-rological data, J. Appl. Meteorol., 36, 205–213, 1997.
Long, D. G. and Drinkwater, M. R.: Azimuth variation in microwave scatterometer and radiome-ter data over Antarctica, T. Geosci. Remote Sens., 38, 1857–1870, 2000.
Marticorena, B. and Bergametti, G.: Modeling the atmospheric dust cycle: 1. Design of a
soil-30
derived dust emission scheme, J. Geophys. Res., 100, 16415–16430, 1995.
TCD
9, 6003–6024, 2015Two cases of aerodynamic adjustment of
sastrugi
C. Amory et al.
Title Page
Abstract Introduction
Conclusions References
Tables Figures
◭ ◮
◭ ◮
Back Close
Full Screen / Esc
Printer-friendly Version Interactive Discussion
Discussion
P
a
per
|
Discussion
P
a
per
|
Discussion
P
a
per
|
Discussion
P
a
per
|
Mather, K. B.: The pattern of surface wind flow in Antarctica, Pure Appl. Geophys., 75, 332–354, 1969.
Mather, K. B. and Miller, G. S.: Wind drainage off the high plateau of Eastern Antarcticam, Nature, 209, 281–284, 1966.
Mellor, M.: Blowing Snow. Cold regions Science and Engineering Part III, Section A3c, US
5
Army Cold Regions Research & Engineering Laboratory (Hanover New Hampshire), 79 pp., 1965.
Naaim-Bouvet, F., Bellot, H., and Naaim, M.: Back analysis of drifting-snow mea-surements over an instrumented mountainous site, Ann. Glaciol., 51, 207–217, doi:10.3189/172756410791386661, 2010.
10
Naithani, J., Mastrantonio, G., Argentini, S., and Pettré, P.: Influence of cyclonic perturbations on surface winds around Dumont d’Urville, East Antarctica, using wavelet transform, J. Geo-phys. Res., 106, 93–102, 2001.
Owen, P. R.: Saltation of uniform grains in air, J. Fluid Mech., 20, 225–242, 1964.
Parish, T. R. and Bromwich, D. H.: The surface wind field over the Antarctic ice sheet, Nature,
15
328, 51–54, 1987.
Parish, T. R. and Bromwich, D. H.: Reexamination of the near-surface airflow over the Antarc-tic continent and implications on atmospheric circulations at high southern latitudes, Mon. Weather Rev., 135, 1961–1973, 2007.
Parish, T. R., Pettré, P., and Wendler, G.: The influence of large scale forcing on the katabatic
20
wind regime of Adélie Land, Antarctica, Meteorol. Atmos. Phys., 51, 165–176, 1993.
Pomeroy, J. W., Gray, D. M., and Landine, P. G.: The prairie blowing snow model: characteristics, validation, operation, J. Hydrol., 144, 165–192, 1993.
Radok, U.: Snow drift, J. Glaciol., 19, 123–139, 1977.
Raupach, M. R.: Saltation layers, vegetation canopies and roughness lengths, Acta Mech., 1,
25
83–96, 1991.
Raupach, M. R.: Drag and drag partition on rough surfaces, Bound.-Lay. Meteorol., 60, 375– 395, 1992.
Rémy, F., Ledroit, M., and Minster, J. F.: Katabatic wind intensity and direction over Antarctica derived from scatterometer data, Geophys. Res. Lett., 19, 1021–1024, 1992.
30
Schmidt, R. A.: Threshold wind-speeds and elastic impact in snow transport, J. Glaciol., 26–94, 453–467, 1980.
Schmidt, R. A.: Properties of blowing snow, Rev. Geophys., 20, 39–44, 1982.
TCD
9, 6003–6024, 2015Two cases of aerodynamic adjustment of
sastrugi
C. Amory et al.
Title Page
Abstract Introduction
Conclusions References
Tables Figures
◭ ◮
◭ ◮
Back Close
Full Screen / Esc
Printer-friendly Version Interactive Discussion
Discussion
P
a
per
|
Discussion
P
a
per
|
Discussion
P
a
per
|
Discussion
P
a
per
|
Shao, Y.: Physics and modelling of wind erosion, 2nd ed. Series: Atmospheric and Oceano-graphic Sciences Library, Springer Verlag, 2008.
Smith, J. D. and McLean, S. R.: Spatially averaged flow over a wavy surface, J. Geophys. Res., 82, 1735–1746, 1977.
Trouvilliez, A., Naaim-Bouvet, F., Genthon, C., Piard, L., Favier, V., Bellot, H., Agosta, C.,
5
Palerme, C., Amory, C., and Gallée, H.: A novel experimental study of aeolian snow transport in Adelie Land (Antarctica), Cold Reg. Sci. Technol., 108, 125–138, 2014.
Trouvilliez, A., Naaim-Bouvet, F., Bellot, H., Genthon, C., and Gallée, H.: Evaluation of FlowCapt acoustic sensor for snowdrift measurements, J. Atmos. Ocean. Tech., 32, 1630–1641, 2015. van Lipzig, N. P. M., Turner, J., Colwell, S. R., and van den Broeke, M. R.: The near-surface
10
wind field over the Antarctic continent, Int. J. Climatol., 24, 1973–1982, 2004.
Vionnet, V., Guyomarc’h, G., Naaim-Bouvet, F., Martin, E., Durand, Y., Bel, C., Bellot, H., and Puglièse, P.: Occurrence of blowing snow events at an alpine site over a 10-year period: observations and modeling, Adv. Water Res., 55, 53–63, 2013.
Wiberg, P. L. and Nelson, J. M.: Unidirectional flow over asymmetric and symmetric ripples, J.
15
Geophys. Res., 97, 12745–12761, 1992.
TCD
9, 6003–6024, 2015Two cases of aerodynamic adjustment of
sastrugi
C. Amory et al.
Title Page
Abstract Introduction
Conclusions References
Tables Figures
◭ ◮
◭ ◮
Back Close
Full Screen / Esc
Printer-friendly Version Interactive Discussion
Discussion
P
a
per
|
Discussion
P
a
per
|
Discussion
P
a
per
|
Discussion
P
a
per
|
Figure 1.Map of Adélie Land showing the location of Dumont d’Urville station and measure-ment site D17. Contour lines are in meters.
TCD
9, 6003–6024, 2015Two cases of aerodynamic adjustment of
sastrugi
C. Amory et al.
Title Page
Abstract Introduction
Conclusions References
Tables Figures
◭ ◮
◭ ◮
Back Close
Full Screen / Esc
Printer-friendly Version Interactive Discussion
Discussion
P
a
per
|
Discussion
P
a
per
|
Discussion
P
a
per
|
Discussion
P
a
per
|
Figure 3.The measurement structure deployed at D17.
TCD
9, 6003–6024, 2015Two cases of aerodynamic adjustment of
sastrugi
C. Amory et al.
Title Page
Abstract Introduction
Conclusions References
Tables Figures
◭ ◮
◭ ◮
Back Close
Full Screen / Esc
Printer-friendly Version Interactive Discussion
Discussion
P
a
per
|
Discussion
P
a
per
|
Discussion
P
a
per
|
Discussion
P
a
per
|
Figure 4.Two erosion events showing sastrugi responses to shifts in wind direction. Note the different vertical scales between right and left panels concerning measured 2 m wind speed and profile-derivedCDN10andu∗values. The aeolian snow mass fluxes come from the