HESSD
5, 3099–3128, 2008Rio Lempa climate change impacts
E. P. Maurer et al.
Title Page
Abstract Introduction
Conclusions References
Tables Figures
◭ ◮
◭ ◮
Back Close
Full Screen / Esc
Printer-friendly Version
Interactive Discussion
Hydrol. Earth Syst. Sci. Discuss., 5, 3099–3128, 2008 www.hydrol-earth-syst-sci-discuss.net/5/3099/2008/ © Author(s) 2008. This work is distributed under the Creative Commons Attribution 3.0 License.
Hydrology and Earth System Sciences Discussions
Papers published inHydrology and Earth System Sciences Discussionsare under open-access review for the journalHydrology and Earth System Sciences
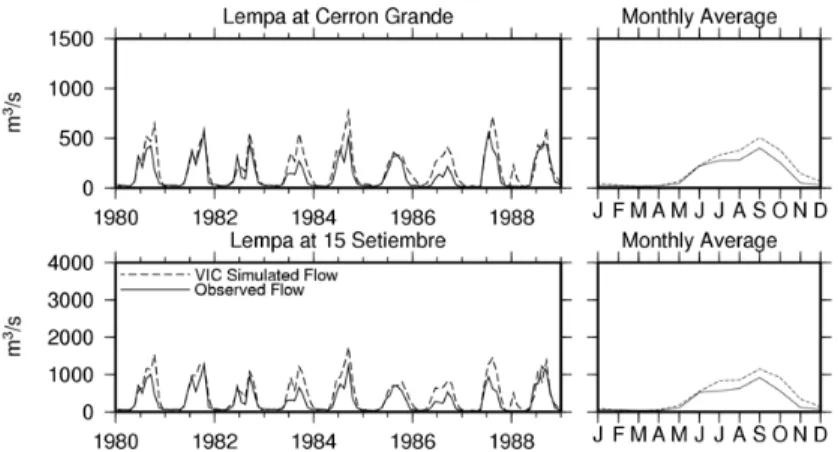
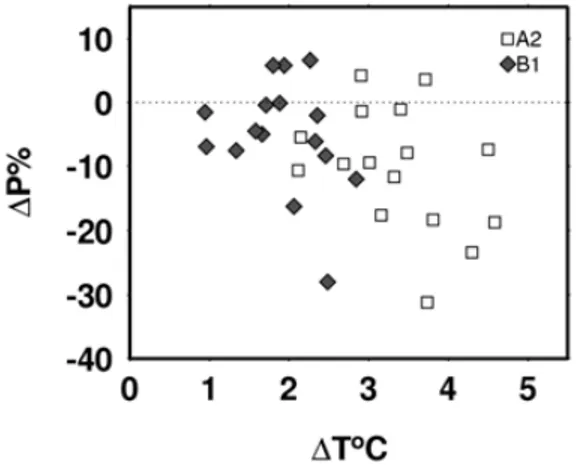
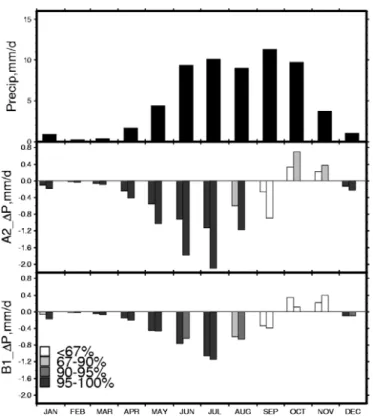
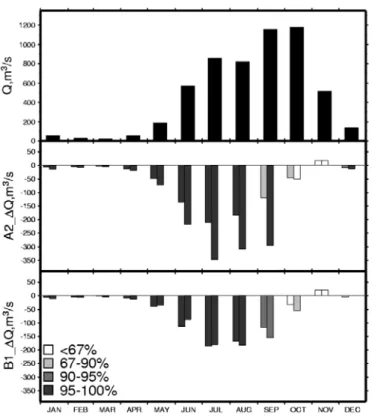
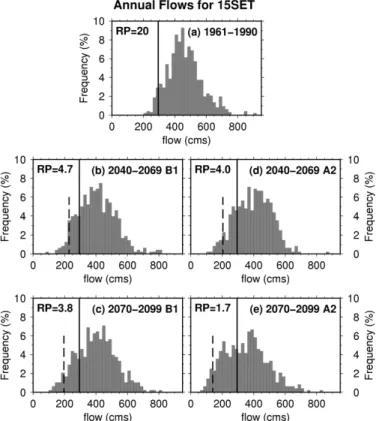
Climate model based consensus on the
hydrologic impacts of climate change to
the Rio Lempa basin of Central America
E. P. Maurer1, J. C. Adam2, and A. W. Wood3
1
Civil Engineering Department, Santa Clara University, Santa Clara, CA, USA 2
Dept. of Civil & Environmental Engineering, Washington State University, Pullman WA, USA 3
3Tier Group, Seattle, WA, USA
Received: 15 September 2008 – Accepted: 19 September 2008 – Published: 14 November 2008
Correspondence to: E. P. Maurer (emaurer@engr.scu.edu)
HESSD
5, 3099–3128, 2008Rio Lempa climate change impacts
E. P. Maurer et al.
Title Page
Abstract Introduction
Conclusions References
Tables Figures
◭ ◮
◭ ◮
Back Close
Full Screen / Esc
Printer-friendly Version
Interactive Discussion
Abstract
Temperature and precipitation from 16 climate models each using two emissions sce-narios (lower B1 and mid-high A2) were used to characterize the range of potential climate changes for the Rio Lempa basin of Central America during the middle (2040– 2069) and end (2070–2099) of the 21st century. A land surface model was applied
5
to investigate the hydrologic impacts of these changes, focusing on inflow to two ma-jor hydropower reservoirs. By 2070–2099 the median warming relative to 1961–1990 was 1.9◦
C and 3.4◦
C under B1 and A2 emissions, respectively. For the same peri-ods, the models project median precipitation decreases of 5.0% (B1) and 10.4% (A2). Median changes by 2070–2099 in reservoir inflow were 13% (B1) and 24% (A2), with
10
largest flow reductions during the rising limb of the seasonal hydrograph, from June through September. Frequency of low flow years increases, implying decreases in firm hydropower capacity of 33% to 53% by 2070–2099.
1 Introduction
The intensification of the hydrological cycle anticipated as global warming continues will
15
manifest itself distinctly in different regions (Stocker, 2001; Trenberth, 1999). This effect has already been observed as a global phenomenon, with generally increasing precip-itation at mid- to high-latitudes and decreasing precipprecip-itation in the sub-tropics (Folland and Karl, 2001). Some regions are particularly vulnerable, including Central America, which Giorgi (2006) identified as a “hot-spot”, the most prominent tropical area for
re-20
sponsiveness to climate changes. This vulnerability has inspired recent studies that have found increases in Central American precipitation intensity (Aguilar et al., 2005), and examined climate model consensus of future drying projections (Christensen et al., 2007; Neelin et al., 2006; Rauscher et al., 2008).
The cumulative effects of warming and precipitation changes are integrated by
wa-25
HESSD
5, 3099–3128, 2008Rio Lempa climate change impacts
E. P. Maurer et al.
Title Page
Abstract Introduction
Conclusions References
Tables Figures
◭ ◮
◭ ◮
Back Close
Full Screen / Esc
Printer-friendly Version
Interactive Discussion
is the Rio Lempa basin, the largest river system in Central America, with a drainage area covering over 18 000 km2(USACE, 1998). The Rio Lempa basin includes portions of three countries: El Salvador, Honduras, and Guatemala. The Rio Lempa is crucial for both water and energy services, as major hydroelectric facilities utilize Rio Lempa flow to generate electricity. Changes to hydropower due to climate change would
con-5
stitute a severe impact, as nearly half of all electricity generated in El Salvador has historically originated from hydropower, and most of that from the Rio Lempa (USAID, 1994).
Past studies of hydrologic impacts of climate change on river basins have commonly included a single future climate projection, though some more recent efforts have
in-10
cluded from four to six different global climate model (or general circulation model, GCM) projections of future climate (Wilby and Harris, 2006; Zierl and Bugmann, 2005). With the coordinated GCM output standardizing and archiving related to the IPCC Fourth Assessment studies (Meehl et al., 2005) the use of multi-model ensembles (using 10 or more GCMs) for climate change impact studies has become much more
15
routine, including recent studies of hydrologic impacts (Christensen and Lettenmaier,
2007; Maurer, 2007; Maurer and Duffy, 2005). The advantage of using many GCM
projections of future climate is that the uncertainty in the projections, as represented by model consensus or spread, can be quantified.
In this study, we assess the hydrologic impacts of projected climate change on the
20
Rio Lempa basin. We employ projections of 16 GCMs, each under a higher and lower greenhouse gas (GHG) emissions scenario. We address the following three questions: (1) What are the projected changes in precipitation and temperature for the Rio Lempa basin under higher and lower emissions scenarios? (2) What are the impacts on pro-jected inflows to major reservoirs on the Rio Lempa? (3) Are the differences in impacts
25
HESSD
5, 3099–3128, 2008Rio Lempa climate change impacts
E. P. Maurer et al.
Title Page
Abstract Introduction
Conclusions References
Tables Figures
◭ ◮
◭ ◮
Back Close
Full Screen / Esc
Printer-friendly Version
Interactive Discussion
2 Study area
The Rio Lempa basin, as in the region in general, experiences a wet season, generally from April through November, followed by a dry season. The rainy season is compli-cated by the precipitation distribution having a bimodal shape, with peaks in May–July and August–October, with an intervening dry period (Maga ˜na et al., 1999; Taylor et
5
al., 2002). A comprehensive analysis of large scale climate model output over Central America identified a general drying trend, especially focused in the early rainy sea-son during June and July (Rauscher et al., 2008), which would tend to decrease the bimodal nature of the rainy season. The Central America region and the Rio Lempa basin are depicted in Fig. 1.
10
3 Methods
The approach of this study is to begin with an ensemble of projected future climates through the 21st century. The consensus among GCMs for the projected changes in precipitation and temperature are assessed for the Central America region. Each of 32 projected climates (16 GCMs each using two emissions scenarios) is used to drive
15
a distributed land surface hydrology model, which produces an ensemble of projected streamflow at inflow points to major dams in the Rio Lempa system. Changes to the inflows are statistically analyzed to assess the confidence in various levels of projected changes in reservoir inflows. The majority of the approach follows Maurer (2007), though the application of the technique in Central America requires the use of a new,
20
gridded global meteorological data set. Each step is described in greater detail below.
3.1 Global Climate Model simulations
HESSD
5, 3099–3128, 2008Rio Lempa climate change impacts
E. P. Maurer et al.
Title Page
Abstract Introduction
Conclusions References
Tables Figures
◭ ◮
◭ ◮
Back Close
Full Screen / Esc
Printer-friendly Version
Interactive Discussion
climate as well as future climate (through 2099) using two selected emissions scenar-ios. All data were obtained from the World Climate Research Programme’s (WCRP’s) Coupled Model Intercomparison Project phase 3 (CMIP3) multi-model dataset. The emissions scenarios used in this study, A2 and B1, are described in detail by Naki-cenovic et al. (2000). Each scenario produces different atmospheric concentrations of
5
future greenhouse gases. While A2 does not represent the highest CO2 emissions (at least through 2100) of the SRES scenarios (IPCC, 2001), and 21st century emis-sions to date appear to be above this projection (Raupach et al., 2007) it is the highest emission scenario for which most modeling groups have completed simulations, and represents the higher emission case in this study. B1 generally represents the best
10
case of the SRES scenarios through the 21st century (Houghton, 2001). To facilitate analyzing multiple GCMs all output was interpolated onto a common 2◦ grid prior to
using the data.
Because the spatial scale of GCM output is too large to characterize climate over small areas like the Rio Lempa basin, some type of downscaling is necessary. The
15
monthly precipitation and temperature output from each GCM was bias-corrected and statistically downscaled to a 1/2◦ grid using an empirical statistical technique. The
method, originally developed for adjusting GCM output for long-range streamflow fore-casting (Wood et al., 2002) that was later adapted for use in studies examining the hydrologic impacts of climate change (Van Rheenen et al., 2004), maps the
probabil-20
ity density functions for the monthly GCM precipitation and temperature onto those of
gridded observed data for 1950–1999, aggregated to the 2◦ GCM scale. This same
mapping is applied to the 21st century GCM simulations. This allows the mean and variability of each GCM to evolve in accordance with the simulation, while matching all statistical moments between the GCM and observations for 1950–1999. While the
25
HESSD
5, 3099–3128, 2008Rio Lempa climate change impacts
E. P. Maurer et al.
Title Page
Abstract Introduction
Conclusions References
Tables Figures
◭ ◮
◭ ◮
Back Close
Full Screen / Esc
Printer-friendly Version
Interactive Discussion
hydrologic response of the Rio Lempa system to the ensemble of future climate pro-jections.
3.2 Hydrology modeling
The hydrologic model used in this study is the variable infiltration capacity (VIC) model (Liang et al., 1994). The VIC model is a distributed, physically-based hydrologic model
5
that balances both surface energy and water budgets over a grid mesh, typically at resolutions ranging from a fraction of a degree to several degrees latitude by longitude. The VIC model uses a “mosaic” scheme that allows a statistical representation of the sub-grid spatial variability in topography, infiltration and vegetation/land cover, which is important when simulating hydrology in heterogenous terrain. The resulting runoff at
10
each grid cell is routed through a defined river system using the algorithm developed by Lohmann et al. (1996).
The VIC model has been successfully applied in many settings, from global to river basin scale (Maurer et al., 2001; Nijssen et al., 1997; Nijssen et al., 2001), as well as in many studies of hydrologic impacts of climate change (Christensen et al., 2004;
15
Hayhoe et al., 2004; Nijssen et al., 2001; Payne et al., 2004). For this study, the model was run at a daily time step at a 1/2-degree resolution (measuring about 3000 km2per grid cell) over the Rio Lempa. Elevation data for the basin is based on the 30-arc-second GLOBE dataset (Hastings and Dunbar, 1999). Land cover and soil hydraulic properties are the same as those used by Nijssen et al. (2001), which utilized the Food
20
and Agriculture Organization global soil database (FAO, 1995) with land cover based on the global land classification by Hansen et al. (2000). A river system was defined at a 1/8 degree resolution, following the technique outlined by O’Donnell et al. (1999).
3.3 Observed meteorology
The base meteorological data consist of daily time-series for the period of 1950 through
25
HESSD
5, 3099–3128, 2008Rio Lempa climate change impacts
E. P. Maurer et al.
Title Page
Abstract Introduction
Conclusions References
Tables Figures
◭ ◮
◭ ◮
Back Close
Full Screen / Esc
Printer-friendly Version
Interactive Discussion
Data from a variety of sources were compiled and gridded to a resolution of 1/2-degree over all global land areas. Monthly precipitation time-series were estimated by ad-justing the Willmott and Matsuura (2001) precipitation for gauge undercatch, as de-scribed by Adam and Lettenmaier (2003). The adjustment in tropical areas is generally small (<5%). Monthly time-series of maximum and minimum temperatures were
cre-5
ated from a version of the New et al. (2000) dataset which has been updated to 2000 (Mitchell et al., 2004). To estimate the daily variability of precipitation, maximum and minimum temperature, 1950–1995 utilized Sheffield et al. (2006) and 1996–1999 was based on an updated, resampled version of Nijssen et al. (2001). Daily 10-m wind speed was obtained from the NCEP-NCAR reanalysis project (Kalnay et al., 1996) and
10
regridded to 1/2-degree resolution by linear interpolation.
For the area over El Salvador, additional, finer resolution climatological precipitation data were available at a 5-min spatial resolution (Centella et al., 1998), based on long-term averages at 46 stations. Since the global precipitation set mentioned above relied on a sparse network of observations over Central America, and since errors in
pre-15
cipitation can produce large errors in hydrologic simulations, the global data set was adjusted over El Salvador. For each month, the 1961–1990 average precipitation from Centella et al. (1998) was aggregated to 1/2-degree resolution, and an adjustment fac-tor was computed for each 1/2 degree grid cell for each month to scale the global data set to match the Centella et al. (1998) 1961–1990 average.
20
3.4 Assessing uncertainty
Following the approach of Maurer (2007), results for each impact, in this case stream-flow, for all GCMs are assembled for each emissions scenario. For each variable, the mean monthly value for each GCM for each of two defined periods is calculated, and these values for each GCM are combined by variable and period into
ensem-25
HESSD
5, 3099–3128, 2008Rio Lempa climate change impacts
E. P. Maurer et al.
Title Page
Abstract Introduction
Conclusions References
Tables Figures
◭ ◮
◭ ◮
Back Close
Full Screen / Esc
Printer-friendly Version
Interactive Discussion
for the change from the climatological period (1961–1990) to different future 30-year periods. In addition, the confidence with which it can be claimed that the two scenarios give different results is determined using the same test. Unless otherwise noted, all p values refer to results from the Mann-Whitney U test.
4 Results and discussion
5
For the observed period, the VIC model was forced with observed meteorology to assess its ability to reproduce historically observed reservoir inflows at the two points shown in Fig. 1. Then the 32 different future climate projections were used to drive the VIC model through the 21st century, and the differences between reservoir inflows of the future and historical periods were assessed.
10
4.1 Hydrology model calibration
An automated calibration technique, using the MOCOM-UA software (Yapo et al., 1998), was employed to calibrate the VIC model at the two key locations on the Rio Lempa. There were two optimization criteria used in this study, both on monthly data: the Nash-Sutcliff model efficiency (Nash and Sutcliffe, 1970); and the mean absolute
15
error. The Nash-Sutcliff efficiency places higher emphasis on errors at high flows as compared to low flow periods, since it is based on the square of differences between simulated and observed flows (Krause et al., 2005). The mean absolute error provides a balance to this since it is based on absolute errors and is less dominated by a small number of large errors at high flows (Lettenmaier and Wood, 1993).
20
The VIC model was calibrated for the two locations for years 1970–1979, and val-idated for years 1980–1989, the results of which are shown in Fig. 2. A tendency to overestimate flows late in the wet season produces a moderate mean bias of 123 m3/s (or about 28.8% of the mean annual observed flow), but the correlation of simulated and monthly flow is relatively high, with a Pearson correlation coefficient of r=0.85.
HESSD
5, 3099–3128, 2008Rio Lempa climate change impacts
E. P. Maurer et al.
Title Page
Abstract Introduction
Conclusions References
Tables Figures
◭ ◮
◭ ◮
Back Close
Full Screen / Esc
Printer-friendly Version
Interactive Discussion
The difference in simulated and observed hydrographs is greatest during the two dry years, 1983 and 1987. Note that, due to limited data availability, no adjustments have been made to the observed flow data to account for upstream diversions or other an-thropogenic impacts. The Rio Lempa has been classified as being strongly affected by development, due to reservoir capacity and irrigation diversions (Nilsson et al., 2005).
5
Consequently, it is likely that the observed flows used in this study underestimate to some degree the natural flow (excluding diversions, impoundments, or other anthro-pogenic influences) simulated by the VIC model.
4.2 Future climate projections for Central America
The 32 projections are assembled into two ensembles, one for each emissions
sce-10
nario. As is common in climate change impact studies with an ensemble of GCMs (Christensen and Lettenmaier, 2007; Maurer and Duffy, 2005; Milly et al., 2002), we assume each of the GCMs produces an equally probable projection of future climate. While some studies of hydrologic impacts of climate change have examined skill-based weighting of future projections, the difference in outcomes from equal weighting has
15
been found to be small (Dettinger, 2005; Wilby and Harris, 2006).
Figure 3a and 3b show the projected changes in temperature and precipitation, re-spectively, between the historic (1961–1990) and future (2070–2099) periods. This presents the context for regionally-projected changes, and the degree of consensus among GCMs. The median projection of temperature changes between these periods
20
varies from 1–3◦C under the B1 emissions scenario, and 2–4◦C under the A2
emis-sions scenario. The greatest warming is focused generally to the North and West of El Salvador (Guatemala and Mexico). The 20% projections, which indicate 80% of GCMs projecting at least this level of warming, are 1–2◦C under B1 and 2–4◦C under A2. At
the higher end 80% projections, for which 20% of the GCMs exceed the level of
warm-25
ing shown, the warming under B1 is 2–3◦C, and under A2 is 3–5◦C. This illustrates a
HESSD
5, 3099–3128, 2008Rio Lempa climate change impacts
E. P. Maurer et al.
Title Page
Abstract Introduction
Conclusions References
Tables Figures
◭ ◮
◭ ◮
Back Close
Full Screen / Esc
Printer-friendly Version
Interactive Discussion
different GCMs.
The median precipitation projections for Central America in Fig. 3b show drying trends, with reductions up to 20% in some areas. There is more severe drying un-der the higher A2 emissions scenario. For the 80% non-exceedence projections it is seen that 20% of the GCMs project increases in precipitation for roughly half of
Cen-5
tral America under A2 emissions, and a greater proportion of the region for B1 emis-sions. However, even under this more optimistic (less dry) 80% end of the spectrum, El Salvador is projected generally to experience drying, especially under the higher A2 emissions.
4.3 Climate projections for the Rio Lempa
10
Figure 4 shows the projected annual average changes for each of the 16 GCMs un-der each emissions scenario for the Rio Lempa basin. Temperature increases unun-der the A2 emissions scenario average 3.4◦C, and 1.9◦C under B1, and this di
fference is highly statistically significant (p<0.01). A drier future is most likely, with only 5 of the 32 GCM simulations showing slightly wetter futures (3–7% wetter). The mean change
15
in precipitation is 10.4% drier under A2 and 5.0% drier under B1. It is interesting to note that there is low statistical significance (p>0.15 based on an ANOVA analysis for significance of linear slope) that temperature and precipitation changes are linearly re-lated within either the B1 or A2 scenario. This means that given an emissions scenario, there is not a strong tendency of GCMs projecting warmer futures to also project drier
20
futures. However, there is a stronger tendency for the GCMs under the warmer A2 scenario to be drier than the B1 scenario (p<0.10). This suggests that, since each GCM run represents one realization of climate response to specified GHG levels, that concurrent warming and drying is a GHG-driven phenomenon.
The seasonality of the changes in precipitation and temperature are non-uniform.
25
HESSD
5, 3099–3128, 2008Rio Lempa climate change impacts
E. P. Maurer et al.
Title Page
Abstract Introduction
Conclusions References
Tables Figures
◭ ◮
◭ ◮
Back Close
Full Screen / Esc
Printer-friendly Version
Interactive Discussion
November. Precipitation changes are almost all highly significant, with the exception of September-November, where the GCM projections tend to disagree to a greater de-gree. For the A2 emissions scenario, precipitation changes grow progressively in mag-nitude through the 21st century, whereas under the B1 emissions scenario, most 21st century changes are expressed by the 2040–2069, with diminishing further changes
5
to end of century. By 2070–2099 the drying projected under A2 is significantly greater (p<0.1) than under B1 for April–July, as well as on an annual average. Temperature increases (not shown), are 0.5–1.0◦C greater in June–July compared to December–
January, thus the higher projected temperature changes occur during the early-mid rainy season when the greatest precipitation changes are also projected.
10
4.4 Future hydrology of the Rio Lempa
Figure 6 illustrates the impact of the projected climate changes on inflows to the down-stream reservoir, 15 Setiembre (while not shown, the impacts at Cerron Grande were of different magnitude, but similar proportion). At Cerron Grande, under the B1 emis-sions scenario, annual average inflow (across the ensemble of GCMs) is projected to
15
decline by 780 m3/s by 2040-2069 and by 835 m3/s by 2070-2099. Under the A2 sce-nario, the projected drop in annual average inflow is 880 m3/s by 2040-2069 and 1565 m3/s by 2070-2099. At 15 Setiembre, annual average drop in inflow is 1950 m3/s by 2040-2069 and 2090 m3/s by 2070-2099 under B1, and 2265 m3/s by 2040-2069 and 3935 m3/s by 2070-2099 under A2. By the end of the century, these drops represent
20
13% (B1) and 24% (A2) of total annual inflows at both reservoirs. The greatest reduc-tion in inflow for A2 emissions occurs in July (39% at Cerron Grande and 41% at 15 Setiembre). Under B1 emissions the greatest drop in inflow occurs in August (21% at Cerron Grande and 22% at 15 Setiembre).
All of the declines in reservoir inflows are statistically significant at very high
confi-25
September-HESSD
5, 3099–3128, 2008Rio Lempa climate change impacts
E. P. Maurer et al.
Title Page
Abstract Introduction
Conclusions References
Tables Figures
◭ ◮
◭ ◮
Back Close
Full Screen / Esc
Printer-friendly Version
Interactive Discussion
December (at Cerron Grande) and October-December (at 15 Setiembre), all of the differences by 2070–2099 are statistically different (at high confidence levels) between the A2 and B1 scenarios, showing distinctly different futures for the basin depending on future greenhouse gas emissions.
As noted above, for A2 emissions by 2070–2099, the median projection for the Rio
5
Lempa basin was a 10.4% reduction in annual precipitation and a 3.4◦C average
tem-perature increase, which produced a 24% reduction in annual average flow. The phe-nomenon of precipitation changes having an amplified effect on runoff, when direct CO2 effects on vegetation are ignored, is well known (Wigley and Jones, 1985). Re-ductions in precipitation for the Rio Lempa basin are therefore expected to have a
10
proportionately greater effect on streamflow, since no direct effects were simulated in this study. Direct CO2 effects – i.e., related to evapotranspiration (ET) demand by vegetation – are driven primarily by two counteracting dynamics: CO2-induced stom-atal closure (which reduces ET); and photosynthesis stimulation (which increases leaf area index and ET) (Kergoat et al., 2002). In tropical regions, these two direct CO2
15
effects have been estimated to be of approximately equal magnitude, effectively can-celing each other and leaving the net effect equal to that of warming alone (Levis et al., 2000), though local impacts could be debated (Leipprand and Gerten, 2006). Thus, the results obtained here are plausibly representative of the sensitivity of the hydrologic system to climate change. An additional study with a biophysical model for this specific
20
region could, however, be used to further investigate this hypothesis.
While future work will focus on the impacts on hydropower generation and possible adaptation approaches for the Rio Lempa, we begin that process here by examin-ing low flow frequency, which for many hydropower systems is the determinant of firm power. Firm power is the energy a hydropower facility is able to supply in dry years, and
25
HESSD
5, 3099–3128, 2008Rio Lempa climate change impacts
E. P. Maurer et al.
Title Page
Abstract Introduction
Conclusions References
Tables Figures
◭ ◮
◭ ◮
Back Close
Full Screen / Esc
Printer-friendly Version
Interactive Discussion
will only occur 5% of the time, is shown on each panel of the Figures. It is apparent that as flows decline through the 21st century a greater proportion of years have average flow below that of the historic 20-year return period. The change in 20-year return flow drops by 22% to 31% (for B1 and A2, respectively) by 2040–2069 and 33% to 53% by 2070–2099 at both Cerron Grande and 15 Setiembre. As a preliminary estimate,
5
even if reservoir levels could be maintained at historic levels, which is an optimistic assumption given the inflow reductions, the low flow decline would translate directly to reductions in firm power production. A notable consequence of this finding is that the amplification of precipitation changes to streamflow changes continues further when translated to impacts on hydropower.
10
5 Conclusions
As noted by the recent IPCC Working Group II report (IPCC, 2007), changes in tem-peratures and precipitation patterns will force many countries to adapt to inevitable changes in water supplies, and the effectiveness of adaptation efforts depends in part on the availability of general information on vulnerable areas and projected impacts.
15
This study provides a quantitative, probabilistic assessment of potential changes to the hydrology of the Rio Lempa, a key source of water and hydropower for El Salvador. The study incorporates climate projections by 16 GCMs each using both a lower and a mid-high emissions scenario, and uses these to drive a distributed hydrology model to estimate streamflow impacts.
20
We find that by the end of the 21st century for the Rio Lempa basin:
– average temperatures will rise from 1.9–3.4◦C, with the greatest increase in June–
July.
– the consensus of GCMs indicates a drier future, with an overall reduction in pre-cipitation of 5 to 10%.
HESSD
5, 3099–3128, 2008Rio Lempa climate change impacts
E. P. Maurer et al.
Title Page
Abstract Introduction
Conclusions References
Tables Figures
◭ ◮
◭ ◮
Back Close
Full Screen / Esc
Printer-friendly Version
Interactive Discussion
– the majority of the drop in precipitation will occur in May–July, corresponding to the first half of the rainy season.
– inflows to the major reservoirs will decline on average by 13 to 24%.
– peak declines in reservoir inflow will occur in July–August, and range from 21 to 41%.
5
– decreases in firm hydropower generation capability, estimated in a preliminary manner, may range from 33% to 53% near the end of the 21st century.
In all cases, the most severe impacts occur under the higher emissions A2 scenario, and are roughly a factor of two greater than the impacts under the lower B1 emis-sions scenario. The implications of these projections are two-fold: water management
10
agencies in the region should prepare for reductions in reservoir inflow of at least 13% over the coming decades; and if the major GHG-producing countries are unsuccess-ful in dramatically reducing emissions of greenhouse gases, water managers should prepare for much greater flow reductions.
Acknowledgements. We are indebted to Jacqueline Cativo and Ismael S ´anchez of the De-15
partamento de Ciencias Energ ´eticas y Flu´ıdicas at the Universidad Centroamericana in San Salvador for their support and assistance in this study. We are grateful to Mauricio Martinez of the Servicio Nacional de Estudios Territoriales (SNET), San Salvador, El Salvador, and Rodolfo C ´aceres of the Comisi ´on Ejecut´ıva Hidroelectrica del Rio Lempa (CEL) for generously sharing their time and helping to acquire the data essential to this study. The first author received the 20
generous support of an Arthur Vining Davis grant through Santa Clara University. We acknowl-edge the modeling groups for making their simulations available for analysis, the Program for Climate Model Diagnosis and Intercomparison (PCMDI) for collecting and archiving the CMIP3 model output, and the WCRP’s Working Group on Coupled Modeling (WGCM) for organizing the model data analysis activity. The WCRP CMIP3 multi-model dataset is supported by the 25
HESSD
5, 3099–3128, 2008Rio Lempa climate change impacts
E. P. Maurer et al.
Title Page
Abstract Introduction
Conclusions References
Tables Figures
◭ ◮
◭ ◮
Back Close
Full Screen / Esc
Printer-friendly Version
Interactive Discussion
References
Adam, J. C. and Lettenmaier, D. P.: Adjustment of global gridded precipitation for systematic bias, J. Geophys. Res., 108, 1–14, 2003.
Aguilar, E., Peterson, T. C., Ramirez Obando, P., Frutos, R., Retana, J. A., Solera, M., Soley, J., Gonzalez Garcia, I., Araujo, R. M., Rosa Santos, A., Valle, V. E., Brunet, M., Aguilar, 5
L., Alvarez, L., Bautista, M., Casta ˜non, C., Herrera, L., Ruano, E., Sinay, J. J., Sanchez, E., Hernandez Oviedo, G. I., Obed, F., Salgado, J. E., Vazquez, J. L., Baca, M., Gutierrez, M., Centella, C., Espinosa, J., Martinez, D., Olmedo, B., Ojeda Espinoza, C. E., Nu ˜nez, R., Haylock, M., Benavides, H., and Mayorga, R.: Changes in precipitation and temperature extremes in Central America and northern South America, 1961–2003, J. Geophys. Res., 10
110, D23107, doi:10.1029/2005JD006119, 2005.
Centella, A., Castillo, L., and Aguilar, A.: Escenarios clim ´aticos de referencia para la Rep ´ublica de El Salvador, 21 pp., 1998.
Christensen, J. H., Hewitson, B., Busuioc, A., Chen, A., Gao, X., Held, I, Jones, R., Kolli, R. K., Kwon, W.-T., Laprise, R., Maga ˜na Rueda, V., Mearns, L., Men ´endez, C. G., R ¨ais ¨anen, J., 15
Rinke, A., Sarr, A., and Whetton, P.: Regional climate projections, in: Climate Change 2007: The Physical Science Basis. Contribution of Working Group I to the Fourth Assessment Report of the Intergovernmental Panel on Climate Change, edited by: Solomon, S., Qin, D., Manning, M., Chen, Z., Marquis, M., Averyt, K. B., Tignor, M., and Miller, H. L., Cambridge University Press, 2007.
20
Christensen, N. and Lettenmaier, D. P.: A multimodel ensemble approach to assessment of climate change impacts on the hydrology and water resources of the Colorado River basin, Hydrol. Earth Syst. Sci., 11, 1417–1434, 2007,
http://www.hydrol-earth-syst-sci.net/11/1417/2007/.
Christensen, N. S., Wood, A. W., Voisin, N., Lettenmaier, D. P., and Palmer, R. N.: The effects of 25
climate change on the hydrology and water resources of the Colorado River basin, Climatic Change, 62, 337–363, 2004.
Collins, W. D., Bitz, C. M., Blackmon, M. L., Bonan, G. B., Bretherton, C. S., Carton, J. A., Chang, P., Doney, S. C., Hack, J. J., Henderson, T. B., Kiehl, J. T., Large, W. G., McKenna, D. S., Santer, B. D., and Smith, R. D.: The Community Climate System Model: CCSM3, J. 30
Climate, 19, 2122–2143, 2006.
HESSD
5, 3099–3128, 2008Rio Lempa climate change impacts
E. P. Maurer et al.
Title Page
Abstract Introduction
Conclusions References
Tables Figures
◭ ◮
◭ ◮
Back Close
Full Screen / Esc
Printer-friendly Version
Interactive Discussion W. F., Dixon, K. W., Dunne, J., Dunne, K. A., Durachta, J. W., Findell, K. L., Ginoux, P.,
Gnanadesikan, A., Gordon, C. T., Griffies, S. M., Gudgel, R., Harrison, M. J., Held, I. M., Hemler, R. S., Horowitz, L. W., Klein, S. A., Knutson, T. R., Kushner, P. J., Langenhorst, A. R., Lee, H.-C., Lin, S.-J., Lu, J., Malyshev, S. L., Milly, P. C. D., Ramaswamy, V., Russell, J., Schwarzkopf, M. D., Shevliakova, E., Sirutis, J. J., Spelman, M. J., Stern, W. F., Winton, M., 5
Wittenberg, A. T., Wyman, B., Zeng, F., and Zhang, R.: GFDL’s CM2 global coupled climate models - Part 1: Formulation and simulation characteristics, J. Climate, 19, 643–674, 2006. Dettinger, M. D.: From climate-change spaghetti to climate-change distributions for 21st century
California, San Francisco Estuary & Watershed Science, 3, 1–14, 2005.
Diansky, N. A. and Volodin, E. M.: Simulation of present-day climate with a coupled 10
Atmosphere-ocean general circulation model, Izv. Atmos. Ocean. Phys. (Engl. Transl.), 38, 732–747, 2002.
FAO: The digital soil map of the world, Version 3.5, United Nations Food and Agriculture Orga-nization, Rome, Italy, 1995.
Flato, G. M. and Boer, G. J.: Warming asymmetry in climate change simulations, Geophys. 15
Res. Lett., 28, 195–198, 2001.
Folland, C. K., Karl, T. R., Christy, J. R., Clarke, R. A., Gruza, G. V., Jouzel, J., Mann, M. E., Oerlemans, J., Salinger, M. J., and Wang, S.-W.: Observed Climate Variability and Change, in: Climate Change 2001: The Scientific Basis, edited by: Houghton, J. T., Ding, Y., Griggs, D. J., Noguer, M., van der Linden, P. J., and Xiaosu, D., Cambridge University Press, 99–181, 20
2001.
Furevik, T., Bentsen, M., Drange, H., Kindem, I. K. T., and Kvamstø, N. G.: Description and evaluation of the bergen climate model: ARPEGE coupled with MICOM, Climate Dynamics, 21, 27–51, 2003.
Giorgi, F.: Climate change hot-spots, Geophys. Res. Lett., 33, L08707, 25
doi:10.1029/2006GL025734, 2006.
Gordon, C., Cooper, C., Senior, C. A., Banks, H., Gregory, J. M., Johns, T. C., Mitchell, J. F. B., and Wood, R. A.: The simulation of SST, sea ice extents and ocean heat transports in a version of the Hadley Centre coupled model without flux adjustments, Clim. Dynam., 16, 147–168, 2000.
30
HESSD
5, 3099–3128, 2008Rio Lempa climate change impacts
E. P. Maurer et al.
Title Page
Abstract Introduction
Conclusions References
Tables Figures
◭ ◮
◭ ◮
Back Close
Full Screen / Esc
Printer-friendly Version
Interactive Discussion 60, CSIRO, Division of Atmospheric Research, 130 pp., 2002.
Haan, C. T.: Statistical Methods in Hydrology, 2nd edition, Iowa State Press, 496 pp., 2002. Hansen, M. C., DeFries, R. S., Townshend, J. R. G., and Sohlberg, R.: Global land cover
classification at 1 km spatial resolution using a classification tree approach, Int. J. Remote Sens., 21, 1331–1364, 2000.
5
Hastings, D. A. and Dunbar, P. K.: Global land one-kilometer base elevation (GLOBE) digital elevation model, documentation, volume 1.0, 1999.
Hayhoe, K., Cayan, D., Field, C. B., Frumhoff, P. C., Maurer, E. P., Miller, N. L., Moser, S. C., Schneider, S. H., Cahill, K. N., Cleland, E. E., Dale, L., Drapek, R., Hanemann, R. M., Kalkstein, L. S., Lenihan, J., Lunch, C. K., Neilson, R. P., Sheridan, S. C., and Verville, J. 10
H.: Emissions pathways, climate change, and impacts on California, P. Natl. Acad. Sci. USA, 101, 12 422–12 427, 2004.
Houghton, J. T., Ding, Y., Griggs, D. J., Noguer, M., van der Linden, P. J., and Xiaosu, D.: Climate Change 2001: The scientific basis, contribution of Working Group I to the third assessment report of the Intergovernmental Panel on Climate Change, Cambridge University 15
Press, 881 pp., 2001.
IPCC: Climate Change 2007: The physical science basis, summary for policymakers, 18 pp., 2007.
IPSL: The new IPSL climate system model: IPSL-CM4, 73 pp., 2005.
Jungclaus, J. H., Botzet, M., Haak, H., Keenlyside, N., Luo, J.-J., Latif, M., Marotzke, J., Miko-20
lajewicz, U., and Roeckner, E.: Ocean circulation and tropical variability in the AOGCM ECHAM5/MPI-OM, J. Climate, 19, 3952–3972, 2006.
K-1 model developers: K-1 coupled model (MIROC) description, K-1 technical report, 1, 34 pp., 2004.
Kalnay, E., Kanamitsu, M., Kistler, R., Collins, W., Deaven, D., Gandin, L., Iredell, M., Saha, S., 25
White, G., Woollen, J., Zhu, Y., Leetmaa, A., and Reynolds, B.: The NCEP/NCAR 40-year reanalysis project, B. Am. Meteorol. Soc., 77, 437–472, 1996.
Kergoat, L., Lafont, S., Douville, H., Berthelot, B., Dedieu, G., Planton, S., and Royer, J.-F.: Impact of doubled CO2 on global-scale leaf area index and evapotranspiration: Con-flicting stomatal conductance and LAI responses, J. Geophysical Res., 107(D24), 4808, 30
doi:10.1029/2001JD001245, 2002.
HESSD
5, 3099–3128, 2008Rio Lempa climate change impacts
E. P. Maurer et al.
Title Page
Abstract Introduction
Conclusions References
Tables Figures
◭ ◮
◭ ◮
Back Close
Full Screen / Esc
Printer-friendly Version
Interactive Discussion http://www.adv-geosci.net/5/89/2005/.
Legutke, S. and Voss, R.: The Hamburg atmosphere-ocean coupled circulation model ECHO-G, Technical report, No. 18., 62 pp., 1999.
Leipprand, A. and Gerten, D.: Global effects of doubled atmospheric CO2 content on evapo-transpiration, soil moisture and runoffunder potential natural vegetation, Hydrolog. Sci. J., 5
51, 171–185, 2006.
Lettenmaier, D. P. and Wood, E. F.: Hydrologic Forecasting, in: Handbook of Hydrology, edited by: Maidment, D. R., McGraw-Hill Inc., 26.1–26.30, 1993.
Levis, S., Foley, J. A., and Pollard, D.: Large-scale vegetation feedbacks on a doubled-CO2 climate, J. Climate, 13, 1313–1325, 2000.
10
Liang, X., Lettenmaier, D. P., Wood, E., and Burges, S. J.: A simple hydrologically based model of land surface water and energy fluxes for general circulation models, J. Geophys. Res., 99, 14 415–14 428, 1994.
Lohmann, D., Nolte-Holube, R., and Raschke, E.: A large-scale horizontal routing model to be coupled to land surface parameterization schemes, Tellus A, 48, 708–721, 1996.
15
Maga ˜na, V., Amador, J. A., and Medina, S.: The midsummer drought over Mexico and Central America, J. Climate, 12, 1577–1588, 1999.
Maurer, E. P.: Uncertainty in hydrologic impacts of climate change in the Sierra Nevada, Cali-fornia under two emissions scenarios, Climatic Change, 82, 309–325, doi:10.1007/s10584-006-9180-9, 2007.
20
Maurer, E. P. and Duffy, P. B.: Uncertainty in projections of streamflow changes due to climate change in California, Geophys. Res. Lett., 32, L03704, doi:10.1029/2004GL021462, 2005. Maurer, E. P., O’Donnell, G. M., Lettenmaier, D. P., and Roads, J. O.: Evaluation of the land
surface water budget in NCEP/NCAR and NCEP/DOE reanalyses using an off-line hydrologic model, J. Geophys. Res., 106, 17 841–17 862, 2001.
25
Meehl, G. A., Covey, C., McAvaney, B., Latif, M., and Stouffer, R. J.: Overview of the Coupled Model Intercomparison Project, B. Am. Meteorol. Soc., 86,89-93, 2005.
Milly, P. C. D., Wetherald, R. T., Dunne, K. A., and Delworth, T. L.: Increasing risk of great floods in a changing climate, Nature, 415, 514–517, 2002.
Mitchell, T. D., Carter, T. R., Jones, P. D., Hulme, M., and New, M. G.: A comprehensive set 30
of high-resolution grids of monthly climate for Europe and the globe: the observed record (1901–2000) and 16 scenarios (2001–2100), 30 pp., 2004
HESSD
5, 3099–3128, 2008Rio Lempa climate change impacts
E. P. Maurer et al.
Title Page
Abstract Introduction
Conclusions References
Tables Figures
◭ ◮
◭ ◮
Back Close
Full Screen / Esc
Printer-friendly Version
Interactive Discussion Gr ¨ubler, A., Yong Jung, T., Kram, T., Lebre La Rovere, E., Michaelis, L., Mori, S., Morita,
T., Pepper, W., Pitcher, H., Price, L., Riahi, K., Roehrl, A., Rogner, H.-H., Sankovski, A., Schlesinger, M., Shukla, P., Smith, S., Swart, R., van Rooijen, S., Victor, N., and Dadi, Z.: Special report on emissions scenarios, Cambridge U. Press, 570 pp., 2000.
Nash, J. E. and Sutcliffe, J. V.: River flow forecasting through conceptual models part I – A 5
discussion of principles, J. Hydrol., 10, 282–290, 1970.
Neelin, J. D., M ¨unnich, M., Su, H., Meyerson, J. E., and Holloway, C. E.: Tropical drying trends in global warming models and observations, P. Natl. Acad. Sci. USA, 103, 6110–6115, 2006. New, M. G., Hulme, M., and Jones, P. D.: Representing twentieth-century space-time climate
variability. Part II: development of 1961–90 monthly grids of terrestrial surface climate, J. 10
Climate, 12, 829–856, 2000.
Nijssen, B., R. Schnur, and D. P. Lettenmaier: Global retrospective estimation of soil moisture using the VIC land surface model, 1980–1993, J. Climate, 14, 1790–1808, 2001.
Nijssen, B., O’Donnell, G. M., Hamlet, A. F., and Lettenmaier, D. P.: Hydrologic sensitivity of global rivers to climate change, Climatic Change, 50, 143–175, 2001.
15
Nijssen, B., Lettenmaier, D. P., Liang, X., Wetzel, S. W., and Wood, E.: Streamflow simulation for continental-scale basins, Water Resour. Res., 33, 711–724, 1997.
Nijssen, B., O’Donnell, G. M., Lettenmaier, D. P., Lohmann, D., and Wood, E. F.: Predicting the discharge of global rivers, J. Climate, 14, 1790–1808, 2001.
Nilsson, C., Reidy, C. A., Dynesius, M., and Revenga, C.: Fragmentation and flow regulation of 20
the world’s large river systems, Science, 308, 405–408, 2005.
O’Donnell, G., Nijssen, B., and Lettenmaier, D. P.: A simple algorithm for generating streamflow networks for grid-based, macroscale hydrological models, Hydrol. Process., 13, 1269–1275, 1999.
Payne, J. T., Wood, A. W., Hamlet, A. F., Palmer, R. N., and Lettenmaier, D. P.: Mitigating 25
the effects of climate change on the water resources of the Columbia River Basin, Climatic Change, 62, 233–256, 2004.
Raupach, M. R., Marland, G., Ciais, P., LeQuere, C., Canadell, J. G., and Field, C. B.: Global and regional drivers of accelerating CO2 emissions, P. Natl. Acad. Sci. USA, 104, 10 288– 10 293, doi:10.1073/pnas.0700609104, 2007.
30
HESSD
5, 3099–3128, 2008Rio Lempa climate change impacts
E. P. Maurer et al.
Title Page
Abstract Introduction
Conclusions References
Tables Figures
◭ ◮
◭ ◮
Back Close
Full Screen / Esc
Printer-friendly Version
Interactive Discussion Russell, G. L., Miller, J. R., Rind, D., Ruedy, R. A., Schmidt, G. A., and Sheth, S.: Comparison
of model and observed regional temperature changes during the past 40 years, J. Geophys. Res.-Atmos., 105, 14 891–14 898, 2000.
Salas-M ´elia, D., Chauvin, F., D ´equ ´e, M., Douville, H., Gueremy, J. F., Marquet, P., Planton, S., Royer, J. F., and Tyteca, S.: Description and validation of the CNRM-CM3 global coupled 5
model, CNRM working note 103, Centre National de Recherches, M ´et ´eorologiques, M ´et ´eo-France, Toulouse, ´eo-France, 36 pp., 2005.
Sheffield, J., Goteti, G., and Wood, E. F.: Development of a 50-yr high-resolution global dataset of meteorological forcings for land surface modeling, J. Climate, 19, 3088–3111, 2006. Stocker, T. F., Clarke, G. K. C., Le Treut, H., Lindzen, R. S., Meleshko, V. P., Mugara, R. 10
K., Palmer, T. N., Pierrehumbert, R. T., Sellers, P. J., Trenberth, K. E., and Willebrand, J.: Physical climate processes and feedbacks, in: Climate Change 2001: The Scientific Basis, edited by: Houghton, J. T., Ding, Y., Griggs, D. J., Noguer, M., van der Linden, P. J., and Xiaosu, D., Cambridge University Press, 417–470, 2001.
Taylor, M. A., Enfield, D. B., and Chen, A. A.: Influence of Tropical Atlantic versus the tropical 15
Pacific on Caribbean rainfall, J. Geophys. Res., 107, 3127, doi:10.1029/2001JC001097., 2002.
Trenberth, K. E.: Conceptual framework for changes of extremes of the hydrological cycle with climate change, Climatic Change, 42, 327–339, 1999.
USACE: Water resources assessment of El Salvador, 71 pp., 1998. 20
USAID: Energy from sugarcane cogeneration in el Salvador, 79 pp., 1994.
Van Rheenen, N. T., Wood, A. W., Palmer, R. N., and Lettenmaier, D. P.: Potential implications of PCM climate change scenarios for Sacramento-San Joaquin River Basin hydrology and water resources, Climatic Change, 62, 257–281, 2004.
Washington, W. M., Weatherly, J. W., Meehl, G. A., Semtner, A. J., Bettge, T. W., Craig, A. P., 25
Strand, W. G., Arblaster, J., Wayland, V. B., James, R., and Zhang, Y.: Parallel climate model (PCM) control and transient simulations, Clim. Dynam., 16, 755–774, 2000.
Wigley, T. M. L. and Jones, P. D.: Influences of precipitation changes and direct CO2 effects on streamflow, Nature, 314, 149–152, 1985.
Wilby, R. L. and Harris, I.: A framework for assessing uncertainties in climate change im-30
pacts: low-flow scenarios for the River Thames, UK, Water Resour. Res., 42, W02419, doi:10.1029/2005WR004065, 2006.
HESSD
5, 3099–3128, 2008Rio Lempa climate change impacts
E. P. Maurer et al.
Title Page
Abstract Introduction
Conclusions References
Tables Figures
◭ ◮
◭ ◮
Back Close
Full Screen / Esc
Printer-friendly Version
Interactive Discussion annual time series (1950–1999) (Version 1.02), 2001.
Wood, A. W., Maurer, E. P., Kumar, A., and Lettenmaier, D. P.: Long-range experimental hy-drologic forecasting for the eastern United States, J. Geophys. Res.-Atmos., 107, 4429, doi:10.1029/2001JD000659, 2002.
Wood, A. W., Leung, L. R., Sridhar, V., and Lettenmaier, D. P.: Hydrologic implications of dy-5
namical and statistical approaches to downscaling climate model outputs, Climatic Change, 62, 189–216, 2004.
Yapo, P. O., Gupta, H. V., and Sorooshian, S.: Multi-objective global optimization for hydrologic models, J. Hydrol., 204, 83–97, 1998.
Yukimoto, S., Noda, A., Kitoh, A., Sugi, M., Kitamura, Y., Hosaka, M., Shibata, K., Maeda, S., 10
and Uchiyama, T.: The new Meteorological Research Institute coupled GCM (MRI-CGCM2), Model climate and variability, Pap. Meteorol. Geophys., 51, 47–88, 2001.
HESSD
5, 3099–3128, 2008Rio Lempa climate change impacts
E. P. Maurer et al.
Title Page
Abstract Introduction
Conclusions References
Tables Figures
◭ ◮
◭ ◮
Back Close
Full Screen / Esc
Printer-friendly Version
Interactive Discussion
Table 1.List of General Circulation Models used in this study.
Modeling Group, Country IPCC Model I.D. Primary Reference
Bjerknes Centre for BCCR-BCM2.0 Furevik et al., 2003 Climate Research
Canadian Centre for Climate CGCM3.1 (T47) Flato and Boer, 2001 Modeling & Analysis
M ´et ´eo-France / Centre CNRM-CM3 Salas-M ´elia et al., 2006 National de Recherches
M ´et ´eorologiques, France
CSIRO Atmospheric CSIRO-Mk3.0 Gordon et al., 2002 Research, Australia
US Dept. of Commerce / GFDL-CM2.0 Delworth et al., 2006 NOAA / Geophysical Fluid
Dynamics Laboratory, USA
US Dept. of Commerce / GFDL-CM2.1 Delworth et al., 2006 NOAA / Geophysical Fluid
Dynamics Laboratory, USA
NASA / Goddard Institute for GISS-ER Russell et al., 2000 Space Studies, USA
Institute for Numerical INM-CM3.0 Diansky and Volodin, 2002 Mathematics, Russia
HESSD
5, 3099–3128, 2008Rio Lempa climate change impacts
E. P. Maurer et al.
Title Page
Abstract Introduction
Conclusions References
Tables Figures
◭ ◮
◭ ◮
Back Close
Full Screen / Esc
Printer-friendly Version
Interactive Discussion
Table 1.Continued.
Modeling Group, Country IPCC Model I.D. Primary Reference
Center for Climate System MIROC3.2 (medres) K-1 model developers, 2004 Research (The University of
Tokyo), National Institute for Environmental Studies, and Frontier Research Center for Global Change (JAMSTEC), Japan
Meteorological Institute of the ECHO-G Legutke and Voss, 1999 University of Bonn,
Meteorological Research Institute of KMA
Max Planck Institute for ECHAM5/MPI-OM Jungclaus et al., 2006 Meteorology, Germany
Meteorological Research MRI-CGCM2.3.2 Yukimoto et al., 2001 Institute, Japan
National Center for PCM Washington et al., 2000
Atmospheric Research, USA
National Center for CCSM3 Collins et al., 2006
Atmospheric Research, USA
Hadley Centre for Climate UKMO-HadCM3 Gordon et al., 2000 Prediction and Research / Met
HESSD
5, 3099–3128, 2008Rio Lempa climate change impacts
E. P. Maurer et al.
Title Page
Abstract Introduction
Conclusions References
Tables Figures
◭ ◮
◭ ◮
Back Close
Full Screen / Esc
Printer-friendly Version
Interactive Discussion
HESSD
5, 3099–3128, 2008Rio Lempa climate change impacts
E. P. Maurer et al.
Title Page
Abstract Introduction
Conclusions References
Tables Figures
◭ ◮
◭ ◮
Back Close
Full Screen / Esc
Printer-friendly Version
Interactive Discussion
HESSD
5, 3099–3128, 2008Rio Lempa climate change impacts
E. P. Maurer et al.
Title Page
Abstract Introduction
Conclusions References
Tables Figures
◭ ◮
◭ ◮
Back Close
Full Screen / Esc
Printer-friendly Version
Interactive Discussion
HESSD
5, 3099–3128, 2008Rio Lempa climate change impacts
E. P. Maurer et al.
Title Page
Abstract Introduction
Conclusions References
Tables Figures
◭ ◮
◭ ◮
Back Close
Full Screen / Esc
Printer-friendly Version
Interactive Discussion
HESSD
5, 3099–3128, 2008Rio Lempa climate change impacts
E. P. Maurer et al.
Title Page
Abstract Introduction
Conclusions References
Tables Figures
◭ ◮
◭ ◮
Back Close
Full Screen / Esc
Printer-friendly Version
Interactive Discussion
HESSD
5, 3099–3128, 2008Rio Lempa climate change impacts
E. P. Maurer et al.
Title Page
Abstract Introduction
Conclusions References
Tables Figures
◭ ◮
◭ ◮
Back Close
Full Screen / Esc
Printer-friendly Version
Interactive Discussion
HESSD
5, 3099–3128, 2008Rio Lempa climate change impacts
E. P. Maurer et al.
Title Page
Abstract Introduction
Conclusions References
Tables Figures
◭ ◮
◭ ◮
Back Close
Full Screen / Esc
Printer-friendly Version
Interactive Discussion
Fig. 7. Histograms of Annual Inflows in m3/s (cms) into 15 Setiembre for the 1961–1990 base period and two future periods. The solid vertical line indicates low flow with a return period (RP) of 20-years for 1961–1990, which is repeated on all panels. The vertical dashed lines in panels