THIS
DOCUMENT
IS
NOT
AN
INVESTMENT
RECOMMENDATION
AND
SHALL
BE
USED
M
ASTERS IN
F
INANCE
E
QUITY
R
ESEARCH
EDP is a leading company in the energy sector, since it is among the major European players in this market; it is also one of the largest energy operators in the Iberia and the third largest wind energy producer in the world.
EDP is a highly regulated company, having more than
85% of its operational revenues coming from its regulated activity. This fact contributes for the status of low-risk Company, as well as the stability and predictability of revenues. Moreover, it enables EDP to leverage itself to finance such striving investment plan.
Actually, the company has a target Capex of €2.1 billion until 2016,
being 80% of it is for expansion purposes.
EDP is highly committed in becoming a greener company,
due to an increasing environmental concern. It has an ambitious investment plant in greener sources of energy, as hydro (mainly in Portugal) and wind capacity, through its stake in EDP Renováveis. Until 2012 EDP intends to have an installed capacity equal to 23.9 GW, being 65% powered by wind and hydro.
The entry of a new shareholder, Three Gorges, as a
consequence of the privatization process, will enable EDP to strengthen his position in the renewable sector, and also develop its business in the Asian market, namely in Macau.
All in all, we consider EDP a solid company that creates its own growing opportunities through its investment business plan,
increasing the diversification of the company’s portfolio.
Company description
EDP – Energias de Portugal is a Portuguese electric utility company that focus its operations in the generation, distribution and supply of electricity and gas in both Portugal and Spain. Also the company has a stake in EDP – Energias do Brasil, which operates in the Brazilian market, and in EDP Renováveis focused on production of energy through renewable sources.
EDP
–
ENERGIAS DE PORTUGAL
COMPANY REPORT
E
LECTRIC
U
TILITIES
06
J
ANUARY2012
S
TUDENT
:
V
ANESSA
N
AVE
[email protected]
A distinctive story
Proven track record in efficiency improvement
Recommendation: BUY
Vs Previous Recommendation BUY
Price Target FY12: 3.16 €
Vs Previous Price Target 2.90 €
Price (as of 6-Jan-2012) 2.48€
Reuters: EDP.LS, Bloomberg: EDP PL
Market Cap (€m) 9,043
Outstanding Shares (m) 3,657
Source: Bloomberg
Source: Bloomberg
(Values in € millions) 2010 2011E 2012F
Revenues 5,404 5,507 5,778
EBITDA 3,613 3,621 3,831
Net Profit 1,235 1,118 1,262
EPS 0.34 0.31 0.35
P/E 9.24 8.01 9.27
PBV 1.06 0.81 1.1
Quick Ratio 0.89 1.04 0.99
Current Ratio 0.94 1.09 1.05
Debt/Assets 0.44 0.45 0.43
ROE 0.11 0.10 0.10
ROA 0.05 0.05 0.06
Source: EDP and Analyst Estimates 60%
70% 80% 90% 100%
EDP–ENERGIAS DE PORTUGAL COMPANY REPORT
THIS
DOCUMENT
IS
NOT
AN
INVESTMENT
RECOMMENDATION
AND
SHALL
BE
USED
EXCLUSIVELY
FOR
ACADEMIC
PURPOSES
(SEE DISCLOSURES AND DISCLAIMERS AT END OF DOCUMENT)Table of Contents
THE ENERGY SECTOR ... 3
COAL ... 4
NATURAL GAS ... 5
ELECTRICITY GENERATION ... 6
SUMMARY ... 7
GROUP EDP
–
ENERGIAS DE PORTUGAL ... 8
COMPANY OVERVIEW ... 8
SHAREHOLDER STRUCTURE ... 11
EDP
–
BUSINESS AREAS ...12
GENERATION IN IBERIA ... 12
Long-term Contracted Generation ... 12
Liberalized Generation ... 14
DISTRIBUTION IN IBERIA ... 15
SUPPLY IN IBERIA ... 17
EDPRENOVÁVEIS ... 19
ENERGIAS DO BRASIL ... 21
VALUATION ...23
METHODOLOGY... 23
Gross Profit ... 23
Operational Costs ... 24
Capex ... 24
Weighted Average Cost of Capital (WACC) ... 25
SCENARIO ANALYSIS ... 27
Worst case scenario ... 28
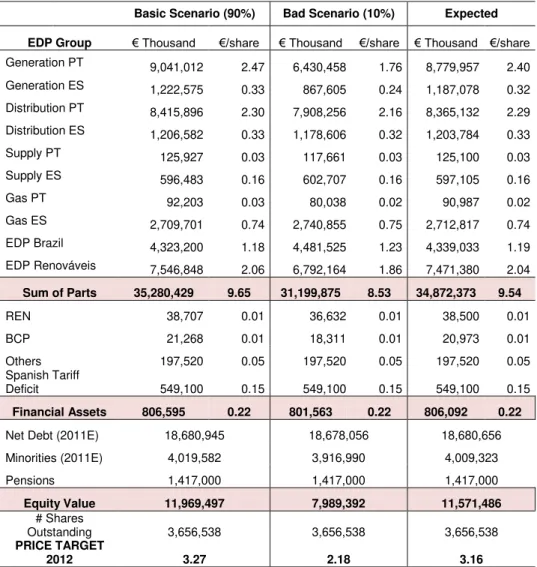
SUM OF PARTS ... 29
FINANCIALS ...30
INCOME STATEMENT ... 31
BALANCE SHEET ... 31
STATEMENT OF CASH-FLOWS ... 31
EDP–ENERGIAS DE PORTUGAL COMPANY REPORT
THIS
DOCUMENT
IS
NOT
AN
INVESTMENT
RECOMMENDATION
AND
SHALL
BE
USED
EXCLUSIVELY
FOR
ACADEMIC
PURPOSES
(SEE DISCLOSURES AND DISCLAIMERS AT END OF DOCUMENT)The Energy Sector
According to the U.S. Energy Information Administration (EIA) it is expected the world marketed energy consumption to grow around 50% until 2035, mainly driven by developing countries (non-OECD nations) where demand is correlated with the strong long-term economic growth. The non-OECD nations that were the least harmful by the crisis, and therefore continue to grow, were China and India.
The global recession of 2008-2009 had a negative impact on world energy consumption since prices were constantly increasing until 2008, with oil prices peaking the $140 per barrel, the highest level ever since. When the crisis installed, not only oil prices declined but also the prices of raw materials, as coal and natural gas, as a consequence of the demand decrease verified in 2009. Nevertheless, as nations recover from this downturn, world energy demand is showing a robust and sustainable growth due to
economic recovery and the increasing population in developing countries. However, this economic growth is not similar between all nations. The countries that show a higher pace of recovery are the non-OECD economies, mainly driven
by capital inflows and high commodity prices. However, high inflation is a major concern in these nations. Regarding OECD nations the economic recovery is variable, since the upturn has been slower in USA and Europe when compared to past recessions due to concerns about both fiscal and financial sustainability. In some European economies, as Greece or Portugal, some intervention measures have been adopted by the European Union in order to prevent a future default. In the case of Japan, it is facing some uncertainty as a consequence of the overwhelming earthquake of March 2011.
It is important to highlight, however, that this expected increase in world energy demand has as assumption no future changes in both regulation and policies that affect energy markets. This might not happen since there is an increasing concern regarding environmental issues, mainly focused on CO2 emissions reduction. In some countries are being adopted energy efficiency measures in order to reduce greenhouse gas emissions, according with commitments expressed at the Durban Graph 1 - World Energy Consumption by fuel (Quadrillion btu)
Source: EIA, International Energy Outlook
Debt world crisis trembled the energy market...
The increase of world energy consumption brings severe consequences to the environment...
0 200 400 600 800
2008 2015 2020 2025 2030 2035
Other
Nuclear
Coal Natural
EDP–ENERGIAS DE PORTUGAL COMPANY REPORT
THIS
DOCUMENT
IS
NOT
AN
INVESTMENT
RECOMMENDATION
AND
SHALL
BE
USED
EXCLUSIVELY
FOR
ACADEMIC
PURPOSES
(SEE DISCLOSURES AND DISCLAIMERS AT END OF DOCUMENT)Climate Change Conference. Basically, this conference put together the 17th Conference of the Parties to the United Nations Framework Convention on Climate Changes and the 7th Session of the Conference of the Parties from the Kyoto Protocol. In this conference was agreed that countries should start working on a new climate deal, based on a legal force, which would affect both developed and developing countries to cut their carbon emissions. The terms of this gradual process will have to be agreed by 2015 and come into effect by 2020. As we know, developed countries, as the United States and China (the two world largest emitters) have now targets to cut their emissions by now until 2020; however, these targets are voluntary and not legally binding. The objective of this conference is to settle legal targets so that all countries get the same responsibility. Additionally, this conference has the objective to help developing countries in this issue, since they have few resources to fight this global concern and also because the major stake of carbon emissions will come from their part due to their high expected growth1.
Coal
If we do not account with changes in policies regarding the greenhouse gas emissions reduction, it is expected world coal consumption to increase from 139 quadrillion Btu in 2008 to 209
quadrillion Btu in 2035, which represent a 1.5% growth per year in the considered period. This growth will be mainly driven by non-OECD nations, as we can see in Graph 2, since OECD countries share an environmental concern. Regarding
the electric power sector, it is likely to verify a decline in usage of this fuel for electricity generation until 2020, since there is increasing use of renewable energy sources for this purpose. From 2020 on, the share of total energy consumption is expected to remain stable. Total consumption of coal in OECD Europe will decline in both industrial and electric power sectors as well as the installed coal-fired electricity generation capacity from 200 gigawatts (GW) in 2008 to 169 GW in 2035. This decline is due to the progressive use of sources less harmful to the environment. In Iberia the major installed capacity of coal-fired plants is in Spain,
1
Source: United Nations Framework Convention on Climate Changes
Graph 2 - Coal world consumption (Quadrillion Btu)
Source: EIA, International Energy Outlook
Although the increasing concern on the environment, the consumption of coal will continue to increase...
0 50 100 150 200
2008 2015 2020 2025 2030
EDP–ENERGIAS DE PORTUGAL COMPANY REPORT
THIS
DOCUMENT
IS
NOT
AN
INVESTMENT
RECOMMENDATION
AND
SHALL
BE
USED
EXCLUSIVELY
FOR
ACADEMIC
PURPOSES
(SEE DISCLOSURES AND DISCLAIMERS AT END OF DOCUMENT)while there is only two in Portugal, which one of them is under Power Purchase Agreements (PPA contracts).
We know that there is an increasing environmental concern that will affect the consumption of the most polluting sources, as coal. Coal mining has associated several environmental issues, namely soil erosion, noise, water pollution and dust, as well as impacts on local biodiversity. In addition, its utilization is related with prices of alternative sources, as natural gas or nuclear. In the past, coal has been used in a high proportion, since its price has been lower and more stable than oil or gas prices, and also because the majority of installed capacity for energy generation was coal-fired ones2. Nowadays, as a consequence of environmental concerns and in order to avoid a decrease in coal consumption and the increase in its price, some changes have been made. There have been adopted new and more efficient technologies that limit the release of pollutant gases, such as greenhouse gas (carbon dioxide and methane). According to World Coal Association, the adoption of this new technology is the major part of the solution related with climate changes, since it has a fast growing use in many large economies, as China and India. But these technologies are very recent and some of them are still under study, which compromises their application. Also, they could turn out to be quite expensive. In our valuation model we considered that the utilization of coal will remain as predicted in what concerns electricity generation, with a decreasing path in the long run.
Natural Gas
The overall consumption of natural gas is expected to increase by approximately 1.6% per year until 2035, being the
world’s fastest-growing fossil fuel. The major source of this growth comes from non-OECD countries, where increasing demand is a consequence of economic growth. In many regions of the world natural gas is the fuel of choice in both electric power and
industrial sectors, due to its lower carbon intensity when compared to oil and coal, and also due to its lower price. In Europe governments have been acting in order to reduce their concern about the nuclear power in the wake in Japan, which may
2
Source: World Coal Association Graph 3 - Future coal prices ($)
Source: Bloomberg
Graph 4 - Natural Gas world consumption (Trillion cubic feet)
Source: EIA, International Energy Outlook
Natural gas will experience a huge growth
68 72 76 80 Ja n-12 M ar -12 M ai -12 Ju l-12 S et -12 Nov -12 Ja n-13 M ar -13 M ai -13 Ju l-13 S et -13 Nov -13 Ja n-14
0 50 100 150 200
2008 2015 2020 2025 2030 2035
EDP–ENERGIAS DE PORTUGAL COMPANY REPORT
THIS
DOCUMENT
IS
NOT
AN
INVESTMENT
RECOMMENDATION
AND
SHALL
BE
USED
EXCLUSIVELY
FOR
ACADEMIC
PURPOSES
(SEE DISCLOSURES AND DISCLAIMERS AT END OF DOCUMENT)lead to a higher usage of natural gas in the electricity generation in the future. In Iberian Peninsula it is used mainly for electricity generation through combined cycle power plants (CCGT).
Electricity Generation
The debt crisis had devastating effects, and electricity generation market was not an exception. The 2008/2009
recession slowed growth rate of electricity usage in 2008 which led to a change in electricity use in 2009. In 2010, demand started to increase again, mainly guide by the economic recovery in developing nations. From the OECD countries the growth is
much slighter, since this is a mature market and there is not so much space for robust growth. Therefore, the world net electricity generation is expected to increase approximately 80% until 2035, according to EIA. In OECD countries net generation is supposed to increase 1.2% per year in the given period.
Regarding the sources of electricity production, general prices will tend to increase since we are returning to pre-crisis levels. Also, there is an increasing concern about environmental issues, thus renewable sources are likely to be the fastest growing sources of electricity generation. The majority of this growth will be driven by hydroelectric power and wind power. Natural gas will be the source that will also show a speedy growth, being the second fastest growing source in power generation, lead by the increase in unconventional natural gas in North America, which will keep global markets well supplied and maintain competitive prices. About nuclear power, contrary to forecasts from previous years, the future of this source is fairly unknown due to the devastating earthquake in Japan, since the biggest stake of nuclear installed capacity is in this country. Governments will have to deal with several issues regarding plant safety and radioactive waste disposal, and the policies that they might resort to may compromise future projections for nuclear power. Still, we may expect an increase in the usage of nuclear energy as it is a green source and helps facing the growing greenhouse gas emissions.
Graph 5 - World Electricity Generation by source (Quadrillion Btu)
Source: EIA, International Energy Outlook
Nuclear power has not a sure path of evolution...
0 2.000 4.000 6.000 8.000 10.000 12.000 14.000
2008 2015 2020 2025 2030 2035
Liquids
Natural Gas Coal-Fired
Nuclear
EDP–ENERGIAS DE PORTUGAL COMPANY REPORT
THIS
DOCUMENT
IS
NOT
AN
INVESTMENT
RECOMMENDATION
AND
SHALL
BE
USED
EXCLUSIVELY
FOR
ACADEMIC
PURPOSES
(SEE DISCLOSURES AND DISCLAIMERS AT END OF DOCUMENT)Summary
The current economic recession brought a lot of instability to the markets. Although forecasts accounts with a market recovery in the near times, we believe that it will be much slower than the one considered in projections, since there is an increasing uncertainty about financial and economic positions of some nations, as Greece, Spain, Portugal and Italy. The future for these nations is quite unknown which trembles financial markets. As a consequence, several companies had to stop their investments in the energy field, due to this uncertainty. EDP was not an exception, as during 2011 the company decided to postpone the construction of
Alvito plant, which represented an investment of €360 million. The fact is that prices are showing an upward trend as well as demand, though slow. However, we believe that prices of both fossil fuels and electricity will go up since it is expected an increase of demand in energy markets, and also because companies will continue their stopped investments in the energy field.
Regarding EDP, it surpassed quite well this downturn due to its regulated part of the business (more than 85% of EBITDA comes from regulated area), which allows the company to have predictable and stable operational cash-flows. and also an effective risk management policy. For the future years, until 2016, EDP has an ambitious investment plan of €2.1 billion per year. Around 80% of this value will be invested in expansion, i.e. repowering of 8 hydro plants, and the remaining for maintenance. Two power plants under construction, Bemposta and Picote, will be finished by the end of 2011, beginning their activity in 2012, and the repowering in Alqueva will be ready in 2013. Still, we know that energy market is facing some changes, namely in Portugal, since there will be a decrease in the regulated area due to the liberalization of the supply activity, increasing the uncertainty and the exposure to trade markets.
We believe that these investments in hydro are due to several strategic points. Firstly, hydro plants have no variable productions costs associated, thus generating high margins. Also meets the environmental concerns, since its pollution rate is lower when compared to other sources. But it does not represent a fixed source of electricity as it depends on weather conditions. As a result, EDP needs other sources for electricity generation with similar advantages of hydro, like CCGT plants, that uses natural gas. EDP made a few investments in the previous years in both Portugal and Spain, in order to be able to substitute the coal-fired plants gradually, since they have a high level of CO2 emissions.
The uncertainty about financial stability of some countries difficult projections about a future stable overall economy...
EDP–ENERGIAS DE PORTUGAL COMPANY REPORT
THIS
DOCUMENT
IS
NOT
AN
INVESTMENT
RECOMMENDATION
AND
SHALL
BE
USED
EXCLUSIVELY
FOR
ACADEMIC
PURPOSES
(SEE DISCLOSURES AND DISCLAIMERS AT END OF DOCUMENT)According to EIA, the CO2 emission rights have an upward trend in the future, meaning that will they become more and more expensive; this fact justify the gradual passage from coal-fired plants to CCGT ones.
Since the liberalized activity is a matter for EDP, we also need to refer the Iberian Electricity Market (MIBEL), which represents a liberalized regional electricity market, formed by both Portuguese and
Spanish governments. MIBEL allows any Iberian consumer to buy electrical energy from any seller, under market conditions. The objective is to benefit all consumers through the integration of both markets, resulting in a unique reference price for the Iberian market. But this does not always happen, because when there is too much consumers
(overcapacity) the market splits in two, Portuguese one and Spanish, which led to different prices in both markets. As we can see by the Graph 6, one year ago this difference (spread) in energy prices was more significant than nowadays. In 2010
the spread reached values of €1.5 per MW; currently the spread is around the
€0.5 per MW.
Group EDP
–
Energias de Portugal
EDP is a result of a merger between 13 companies in 1976 that were nationalized at that time, conferring to EDP the status of a state owned company. Its main objective was the electrification of the whole country as well as the modernization and extension of the distribution network. In the 1990s the Government decided to change the legal status of EDP and emerged the EDP Group.
EDP – Energias de Portugal is listed on the Lisbon stock exchange, and EDP
Group’s activities are focused on generation, distribution and supply of electricity in Iberia and Brazil. Also, some companies within the group are responsible for the distribution and supply of Gas and the business of renewable energies.
Company Overview
EDP is a leading company in the energy sector, since it is one of the largest energy operators in Iberia. In this market the company is well represented by several important holdings. In Spain, EDP is represented by HC Energía
Graph 6 – Difference between PT and ES electricity prices (EUR/MWh)
Source: OMIP
Graph 7 - EBITDA per business area (9M2011) as a % of Total EBITDA
Source: EDP
Well diversified electric company
MIBEL allowed the creation of an integrated and unique Iberian market
-1,5 -0,5 0,5 1,5
Ja
n-10
M
ar
-10
M
ai
-10
Ju
l-10
S
et
-10
Nov
-10
Ja
n-11
M
ar
-11
M
ai
-11
Ju
l-11
S
et
-11
Nov
EDP–ENERGIAS DE PORTUGAL COMPANY REPORT
THIS
DOCUMENT
IS
NOT
AN
INVESTMENT
RECOMMENDATION
AND
SHALL
BE
USED
EXCLUSIVELY
FOR
ACADEMIC
PURPOSES
(SEE DISCLOSURES AND DISCLAIMERS AT END OF DOCUMENT)(Hidroeléctrica del Cantábrico) which is in control of generation, distribution and supply of electricity. In the Portuguese market the electricity generation and distribution is represented by EDP Produção and EDP Distribuição respectively. Yet, EDP Distribuição is only responsible for the distribution network, as REN is responsible for the transportation grid since 2007 as a consequence of the liberalization process in the Portuguese energy market. In what concerns the supply activity EDP is present in both regulated and liberalized markets though EDP Serviço Universal and EDP Comercial respectively. However, this segment is passing through a liberalization process and thus it is expected that all consumers in the regulated market to be in the liberalized one until January, 2013. In other words, the supply activity will be under market conditions (prices will be set in the market and not through regulated tariffs) and will be represented exclusively by EDP Comercial.
Regarding the Gas business in Iberia, we find EDP Gás in Portugal and Naturgas in Spain, both responsible for distribution and supply activities. In Portugal the gas business is working fully under market conditions since 2010.
EDP Renováveis (EDPR) is representing EDP in the renewable sector. At this point, EDPR is the third largest producer of wind energy and its objective is becoming the largest player in this market. In 2010 it increased its total capacity by 1,101 MW (+19.7%) and held a market share of total wind capacity of 4.1% in Europe and 8% in the USA.
Last but not least, EDP Group is present in the Brazilian market through Energias do Brasil (EdB). In this country, EDP is the third largest private company of electricity distribution. In the first half of 2011 EdB acquired the exploration rights of Santo Antônio do Jari Hydro Power Plant with 300 MW of installed capacity. Also, EDP launched a public offer in which it sold 14% of its position in EdB, holding at the moment roughly 51%.
Summary
EDP is a leading company in the Iberian market, having around 20 GW of installed capacity. It is becoming a greener company as a consequence of all investments
in renewable energies (in 2010 it represented 29% of the Group’s total installed
capacity compared to 3% in 2005) and also the increasing usage of greener sources of energy. In the near future, EDP expects to use both hydro and wind to produce the majority of the total electricity generation, instead of coal, since it is Graph 8 - EBITDA per country
(except EDPR)
Source: EDP
Sustainable growth driven by business diversification EDP is facing a change in its supply business due to liberalization
53% 22%
25% PT
ES
EDP–ENERGIAS DE PORTUGAL COMPANY REPORT
THIS
DOCUMENT
IS
NOT
AN
INVESTMENT
RECOMMENDATION
AND
SHALL
BE
USED
EXCLUSIVELY
FOR
ACADEMIC
PURPOSES
(SEE DISCLOSURES AND DISCLAIMERS AT END OF DOCUMENT)becoming a more expensive source and also does not contribute positively to the legal constraints regarding carbon emissions. To achieve such ambitious objectives EDP has a strong investment plan that accounts with a Capex of
approximately €2.1 billion per year until 2016, 80% of that amount allocated to expansion projects.
Nevertheless, it is important to highlight all changes the company is facing. The market liberalization process that has to be concluded until 2013 will imply that the supply of electricity business will be fully under market conditions. Due to regulation, EDP had a very stable level of revenues since it was not exposed to changes in market prices; from 2013 onwards this will not happen anymore, and thus the revenues of EDP will be affected by this volatility in market prices.
Additionally, EDP went through a privatization process. The companies evolved in this process were E.ON, Electrobras, Cemig and Three Gorges Corporation (CTG), being the last one the winner of Párpublica stake. The company paid €2.7
billion for the 21% Government stake in EDP. Three Gorges is a Chinese company that has the world’s largest power station in terms of installed capacity
(21,779 MW in the end of 2010). This company is responsible for the construction and management of hydroelectric plants. Its interest in EDP is mainly related with the opportunity the company has to enter in the European market of renewable energies, more specifically in wind, where EDP has a strong position. Goldwind, a subsidiary of the Chinese group whose business is related to wind energy production, will build in Portugal a production facility of wind turbines. This facility is expected to be ready in the summer of 2013, and will contribute to national exports with €500 million. According to Goldwind, this interest in Portugal is related to the excellent natural conditions for the production of wind energy, the
country’s strategic location to export to occidental markets and its ambitious
energy policy based on objectives defined by the European Union. Goldwind is one of the greatest producers of wind turbines facilities and the second major company in the Chinese sector. The company contributes annually to the installation of around 4,000 MW of wind power, value equivalent to the Portuguese wind installed capacity3.
3
Source: Bloomberg, Goldwind Corporation
Párpublica sold its 21% stake on EDP to Three Gorges Corporation, a Chinese company
Through the privatization process EDP can improve
EDP–ENERGIAS DE PORTUGAL COMPANY REPORT
THIS
DOCUMENT
IS
NOT
AN
INVESTMENT
RECOMMENDATION
AND
SHALL
BE
USED
EXCLUSIVELY
FOR
ACADEMIC
PURPOSES
(SEE DISCLOSURES AND DISCLAIMERS AT END OF DOCUMENT)Shareholder Structure
EDP Group comprises a total of 3,656,537,715 shares with a nominal value of 1€
each. 80.30% of these shares (2,936,222,980) are Category A, whereas the remaining 19.70% are Category B. The difference between these two categories is related to voting rights. Class A shares are limited to a maximum of 5% of total voting rights, and are detained by private investors. Class B shares, on the other hand, are the type of shares held by the Government and thus the ones that were reprivatised, since they have no restrictions concerning transferability. Moreover, they have no limitations regarding voting rights. As a consequence of this difference in voting rights enabled the Government to have a huge control of the company, since it owned around 20% of the voting rights, through Parpública and CGD. Yet, as stated before, EDP went throughout the 8th stage of the privatization process, in which the Government had to sell a minimum of 5% and a maximum of
21.35% of EDP’s share capital, with a minimum reference price of €2.2 billion. In
fact, Párpublica sold the total of 21.35% for a price equal to €2.7 billion. According with the terms specified in DL n. º 106-A/2011 CTG will be obligated to maintain its position on EDP for a minimum of three years and maximum of five years.
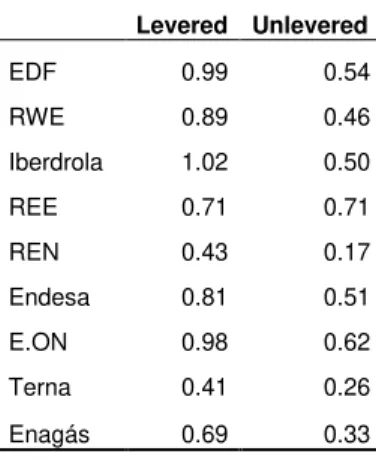
Through this alliance with CTG EDP is able to take some advantages. Firstly, EDP will be among the electric companies with the lowest debt levels. This partnership will allow EDP to reduce its Debt/EBITDA ratio by 41%; moreover, it will enable EDP to be much closer to the Asian market. According with the written communication made to the Portuguese capital regulator, Comissão do Mercado de Valores Mobiliários (CMVM), the partnership with CTG includes a financial
commitment from a Chinese financial institution that amounts €2 billion with a
maturity of 20 years. Besides this, EDP credit profile will be reinforced, since the company will have a financing viability until 2015 without needing to go to the market4. Also, the fact that EDP is more connected with the Asian market will enable the company to develop its business in Macau, through its participated company Companhia de Electricidade de Macau (CEM), more related with clean sources of energy. Another major change that is still under consideration is the
incorporation of EDPR in EDP’s business, as it happened with Iberdrola and Iberdrola Renewable in May, 2011.
4
Source: Bloomberg Table 1 - Voting rights (new shareholder structure)
CTG 21.35%
IBERDROLA 6.79%
CAJA ASTURIAS 5.01% JOSÉ DE MELLO 4.82%
SENFORA SARL 4.06%
BCP 3.37%
NORGES BANK 2.76%
SONATRACH 2.23%
BES 2.12%
Qatar Holding LLC 2.02%
MFS 2.01%
EDP–ENERGIAS DE PORTUGAL COMPANY REPORT
THIS
DOCUMENT
IS
NOT
AN
INVESTMENT
RECOMMENDATION
AND
SHALL
BE
USED
EXCLUSIVELY
FOR
ACADEMIC
PURPOSES
(SEE DISCLOSURES AND DISCLAIMERS AT END OF DOCUMENT)EDP
–
Business Areas
Generation in Iberia
Long-term Contracted Generation
This is one of the most important areas since the beginning of EDP, given that it was responsible for the production and distribution of electricity in Portugal. Because it held the market of electricity production, it was subject to regulation, and for many years all production of electricity was made under Power Purchase Agreements (PPA). This scheme allowed EDP to face the minimum risk regarding its revenues, since it faced no risk on volumes produced and it was not exposed to market conditions regarding prices. Due to this low risk, EDP had great conditions and incentives to expand its generation capacity in Portugal.
The PPA contracts were simple bilateral contracts, in which EDP had to sell its overall production to REN, i.e. the electric system operator in Portugal. They were remunerated according a capacity charge that is calculated based on a ROA (Return on Assets) equal to 8.5% plus both depreciation and maintenance costs, updated to inflation. Also it takes into account an energy charge minus fuel costs that is a pass-through process.
In 2004 began the liberalization process of energy market between Portugal and Spain, and agents verify that the basis of PPA contracts were against the concept of a competitive and open market in Iberia. As a consequence, PPA had to be replaced by other types of contracts that corresponded to the ideal of a liberalized market, but at the same time that would ensure the NPV (Net Present Value) of PPA contracts. These new agreements were called Contract for Maintenance of Contractual Equilibrium (CMEC). Their creation was proposed in 2004 but the replacement took place in 2007, the year that MIBEL initiated its activities. The value of CMEC is just the difference between the annual remuneration under PPA and the revenues obtained under market conditions. If this difference is positive EDP is entitled to return the difference, otherwise it will receive compensation.
Under CMEC EDP ensures stable gross profit since allowed revenues are the ones under PPA contracts, and the pass-through process eliminates the market volatility on fuel prices and volumes. However, there is an operational risk related with the availability of plants that work under PPA. If there is any plant that is not Table 2 - PPA Maturities
Miranda 2013
Bemposta 2013
Picote 2013
C. de Bode 2015
V. Nova 2015
Cabril 2015
Alto do Rabagão 2015
Caniçada 2015
Bouçã 2015
Salamonde 2015
Sines 2017
Fratel 2020
Vilarinho 2024
Alto do Lindoso 2024 Source: EDP
LT contracted generation represents approximately
EDP–ENERGIAS DE PORTUGAL COMPANY REPORT
THIS
DOCUMENT
IS
NOT
AN
INVESTMENT
RECOMMENDATION
AND
SHALL
BE
USED
EXCLUSIVELY
FOR
ACADEMIC
PURPOSES
(SEE DISCLOSURES AND DISCLAIMERS AT END OF DOCUMENT)available, for instance because the plant is passing through maintenance, this will result in an adjustment in the gross profit.
Integrated in this business segment we have also generation of electricity in Portugal and Spain through Special Regime (PRE), which includes Small-Hydro (Portugal), Cogeneration (Portugal and Spain) and Biomass (Portugal). This area has experienced some growth in installed
capacity, as we can see by Graph 9, still it is expected some decrease in electricity generation through these sources in 2011 onwards due to the slow of economic activity, as shown in Graph 10. Hence, this segment has inherent some economic risk, but also environmental and regulatory risks. Regarding the first source of risk, it impacts cogeneration
because plants work at a lower level, diminishing the amount o heat produced by its activity. The same happens with biomass. The slow of economic activity entails that less biomass residuals will be produced, and therefore its availability for electricity production will be lower. About environmental risk, it affects mainly the mini-hydro source, since it is highly dependent on weather conditions. Last but not least, there is some regulatory risk as the future regulation in this segment can change anytime. Nevertheless, this segment has no volume risk as all production is acquired by EDP Serviço Universal, the last resort supplier. Besides all these risk, Special Regime production provides to EDP a fairly stable gross profit since the price depends on the characteristics of each source, i.e. it is known in advance, and also depends on inflation, for which we have forecasts.
Analysis
By the analysis made before, we see that this business area has been important for EDP, because it provides to the company a stable gross profit and a stable source of cash-flow, known in advance without major risks associated. Because this is true it leaves EDP without margin to manage any extra revenue from this segment. Moreover, some plants are close from the ending period, as shown in Table 3, and they will be operating in the liberalized market or will be shut down. Due to this fact, the revenue that comes from this segment is decreasing over time, which makes EDP more and more exposed to the market, meaning that over the years revenues coming from the liberalized market will increase. This has inherent a growing risk (the market risk), which may compromise the stability of
Graph 9 - Installed Capacity of PRE (MW)
Source: EDP
Graph 10 - Electricity Generation through PRE (GWh)
Source: EDP and Analyst Estimates
CMEC as a source of stable revenues until 2017...
Special Regime production is highly affected by economical conditions 0 100 200 300 400 500
2007 2008 2009 2010
Biomass (PT)
Cogenerati on+Waste (PT and ES) Small-Hydro (PT) 0 500 1.000 1.500 2.000 2.500
3.000 Biomass (PT)
EDP–ENERGIAS DE PORTUGAL COMPANY REPORT
THIS
DOCUMENT
IS
NOT
AN
INVESTMENT
RECOMMENDATION
AND
SHALL
BE
USED
EXCLUSIVELY
FOR
ACADEMIC
PURPOSES
(SEE DISCLOSURES AND DISCLAIMERS AT END OF DOCUMENT)this business segment. A way to decrease the exposure to this growing risk is to continue to invest in this segment but only if the cost of investing is lower than the ROA it has intrinsic; however it is subject to regulatory approval.
Liberalized Generation
This business segment has experienced a huge growth in installed capacity as the company has been investing a lot on it, namely in greener and more efficient sources. This was a very important decision since the least efficient and greener sources, like coal and
gasoil, will be penalized in terms of CO2 emissions, since their costs will increase in the future, according to EIA. In Portugal EDP has been increasing hydroelectric installed capacity due to both facts pointed before. Table 3 shows the hydro projects that are under
construction, being the majority of them repowering of existing plants. Also, there are some plants that are currently working under PPA contracts that will shift and contribute to liberalized production, since EDP has secured the concessions after their expiration. As we can see from Table 2, there are 3 plants with a production capacity of approximately 2.5 TWh that will shift from regulated to liberalized market in December, 2013 (Miranda, Bemposta e Picote), and 7 plants, with 1.8 TWh production capacity, that will shift in December, 2015 (C. De Bode, V. Nova, Cabril, Alto do Rabadão, Caniçada, Bouçã e Salamonde), which also contributes to the increase in hydro installed capacity. By investing in hydro, EDP is creating a strategic advantage in Portugal since it has major unexplored potential, mainly due to the specific conditions of the country. However, we know that this source of energy has inherent an environmental risk, since it depends on weather conditions. It has also some operational risks related to transportation costs, as plants are usually situated far from consumption centres.
Table 3 - Hydro evolution (MW)
2011 2012 2013 2014 2015 2016 2017
Salamonde (Rep) 207
Vendas Novas III (Rep) 736
Picote (Rep) 246
Bemposta (Rep) 191
Alvito (Rep) 224
Alqueva (Rep) 256
Fridão 237
Foz Tua 251
Baixa Sabor 171
Total 0 437 256 0 422 1.167 237
Source: EDP
Graph 11 - Hydro Installed Capacity (MW)
Source: EDP and Analyst estimates
Liberalized production has an important role on EDP business
EDP–ENERGIAS DE PORTUGAL COMPANY REPORT
THIS
DOCUMENT
IS
NOT
AN
INVESTMENT
RECOMMENDATION
AND
SHALL
BE
USED
EXCLUSIVELY
FOR
ACADEMIC
PURPOSES
(SEE DISCLOSURES AND DISCLAIMERS AT END OF DOCUMENT) Analysis
By doing these investments in new hydro plants, securing the concession of existing plants working under the regulated market and the repowering of some plants, gives EDP some room for growth in
the liberalized market. These actions are crucial since it is expected a boost in the liberalized market, due to increase of both prices and demand. Looking to Graph 12 we see the growth of this business segment and the implications for EDP revenues. Nonetheless, we know that this pace is not sure and perhaps it will be slower than predicted since the economy
has been struggling to surpass this economic crisis. Moreover, because the hydro source has an environmental risk, the path of the load factors5 is quite unsure. For these reasons, the load factors considered were in line with the previsions of both EIA and EDP. Regarding the other sources of electricity working in the liberalized market, as Coal, CCGT and Nuclear, we took into account previsions published by EIA as well, but also the evolution of EDP’s installed capacity. Coal is a source of energy that has many negative implications for the environment. In our forecasts we considered that the usage of this source will decrease over time (according to EIA), however at a very slow pace, since it represents a high percentage of the installed capacity in EDP. For CCGT is expected a huge growth for being a green source of energy, and because it does not have high costs associated with CO2 emissions. Regarding the nuclear power, we do not know how it is going to evolve over time, since this source was highly affected by the earthquake in Japan. We considered that the load-factor will remain stable, according to historical data.
Distribution in Iberia
This business segment includes the distribution of both electricity and gas, and is fully regulated by ERSE (Entidade Reguladora dos Serviços Energéticos), the regulator entity that defines the tariffs, parameters and prices for electricity, controlling and assuring the levels of quality and service demanded by DGGE (Direcção Geral de Geologia e Energia). In Portugal EDP Distribuição is in charge of the business of electricity and is responsible for the Portuguese distribution grid;
5
Graph 12 - Regulated and Liberalized Production (PT & ES)
Source: EDP and Analyst Estimates
The investments made in hydro leads EDP to accomplish its target related to the reduction of CO2 emissions
A fully regulated activity...
0% 20% 40% 60% 80% 100%
% Regulated
EDP–ENERGIAS DE PORTUGAL COMPANY REPORT
THIS
DOCUMENT
IS
NOT
AN
INVESTMENT
RECOMMENDATION
AND
SHALL
BE
USED
EXCLUSIVELY
FOR
ACADEMIC
PURPOSES
(SEE DISCLOSURES AND DISCLAIMERS AT END OF DOCUMENT)EDP Gás is in the gas business, which operates in the low-pressure natural gas distribution grid in Porto, north of Portugal. However, EDP is not responsible for the transportation of the electricity or its management. Instead, we have REN (Rede Eléctrica Nacional) that is in charge of this area. In Spain we have HC Distribución that operates in the Spanish distribution grid, and Naturgás also operating in the Spanish distribution and transportation grids of natural gas. Yet, the organization of the networks in Spain is quite different from the one in Portugal. In Spain there is REE that has the same responsibilities as REN, but some parts of the network are operated by the Spanish subsidiaries.
Analysis
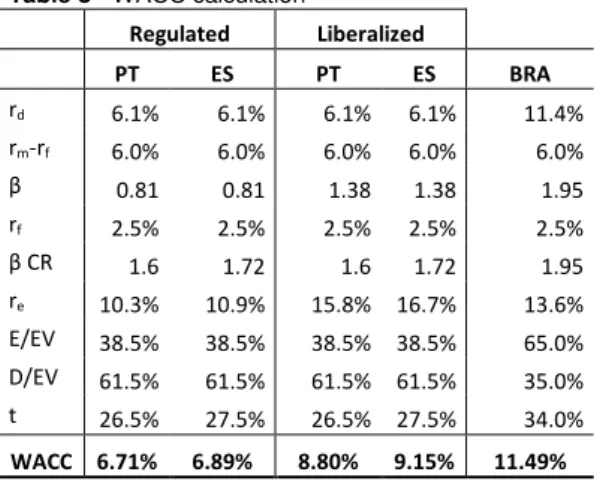
Due to its regulated nature, this area provides EDP a stable gross profit, since it is not dependent on market conditions or fluctuations on demand. The gross profit for these areas is calculated based on a Regulated Asset Base (RAB) and a return based on these regulated assets, which we will call Return on Regulated Asset (RORA), also settled by the regulator. Also, regulator accepts working capital expenses that usually are indexed to inflation. In January, 2012 will start a new regulatory period for electricity business in Portugal, in which the regulator will define the regulatory framework applied for the next 3 years (until 2015).
According to ERSE, RAB will be stable, €2.8 million, and RORA will be around 9.5%. The calculation method for RORA changed due to changes verified in the market. Previously, RORA was calculated based on 10-year Portuguese Government Bond plus 400 basis points. For this regulatory period ERSE decided to use Portuguese 5-year CDS (Credit Default Swaps). According to ERSE this new indicator incorporates the risk perception by the market agents regarding our economy. In other words, Portuguese CDS prices will be a proxy for the difference between the risk-free rate in the euro area and the risk perceived by the market for the national economy. They used a 5-year period since it is closer to the regulatory period length, and because ERSE considers that it may incorporates the medium and long run evolution perspective for Portugal6. The
costs accepted by ERSE are around €1 billion. In Spain, the regulator reviews the
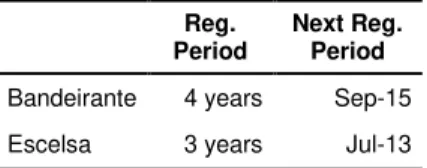
method of calculation yearly, which creates uncertainty about the future. Still, the calculation process is the same. Regarding the Gas business the regulatory periods also differ from the ones in electricity, in Portugal and Spain. In Portugal the regulatory period for this segment is equal to 3 years and the next review of the regulated parameters will occur in July, 2013. In Spain, the regulatory period is
6
Source: ERSE Table 4 - Regulatory Periods for Distribution of Electricity and Gas
Reg. Period
Next Reg. Period
Electricity PT 3 years Jan-12 Electricity ES 1 year Jan-12 Gas PT 3 years Jul-13 Gas ES 4 years Jan-14 Source: ERSE
EDP–ENERGIAS DE PORTUGAL COMPANY REPORT
THIS
DOCUMENT
IS
NOT
AN
INVESTMENT
RECOMMENDATION
AND
SHALL
BE
USED
EXCLUSIVELY
FOR
ACADEMIC
PURPOSES
(SEE DISCLOSURES AND DISCLAIMERS AT END OF DOCUMENT)equal to 4 years, and the next revision is expected to happen in January, 2014. Although it has a stable gross profit free from market fluctuations due to regulation, this segment experiences a regulatory risk that does not leave EDP room for growth. But the length of the regulated periods enables EDP to develop strategies to take the best part of each these segments. Related with this area we have the tariff deficit of both Portugal and Spain. Regarding the first, we know that great part of it was securitized contributing to the decrease of EDP’s risk in this
slice. Still, Spanish tariff deficit does not passed through this process and is has becoming a much serious problem. At the moment the Spanish tariff deficit amounts €22 billion,and EDP holds €549.1 million through its Spanish subsidiary.
In the beginning of 2011 EDP received €102.5 million from the Spanish Electricity
Deficit Amortization Fund7.
Supply in Iberia
As the distribution segment, EDP is responsible for the supply of electricity and gas, in Portugal and Spain. Conversely, this segment is much less regulated than the previous one. Regarding the electricity business in Portugal it is represented by EDP Serviço Universal and EDP
Comercial in the regulated and liberalized market respectively. In Spain the supply of electricity is fully liberalized, and EDP is represented in this segment by HC Energía. In the gas business, we find EDP Gás in Portugal and Naturgas in Spain. The
supply business is almost fully liberalized. Gas business in Portugal is quite recent, since it began in 2009; therefore it has room for growth. The gas business in Spain, however, is a much more consolidated business, since it had experienced some acquisitions in 2009/2010.
Analysis
As stated before, supply of electricity in Portugal is passing through a liberalization process, which means the regulator (ERSE) will not influence revenues of this business segment, and prices will be settled by the market. Under this scenario, EDP clients have two alternatives. The first is to shift their services to the liberalized market and pay the prices that EDP proposes to them. On the other
7
Source: EDP
Graph 13 - Gross Profit of Supply PT (€ thousand)
Source: EDP and Analyst estimates 160.000
170.000 180.000 190.000 200.000 210.000
2010 2011E 2012E 2013E 2014E 2015E
EDP–ENERGIAS DE PORTUGAL COMPANY REPORT
THIS
DOCUMENT
IS
NOT
AN
INVESTMENT
RECOMMENDATION
AND
SHALL
BE
USED
EXCLUSIVELY
FOR
ACADEMIC
PURPOSES
(SEE DISCLOSURES AND DISCLAIMERS AT END OF DOCUMENT)hand, they can shift supplier, going to other company. At this moment, we have other companies operating the Portuguese market, as Endesa. We believe that this process of liberalization is a consequence of the complex interaction between the regulated and open market. Basically, demand on the liberalized market was closely connected to prices settled by ERSE. If electricity prices were higher than the one on the liberalized market, consumers would shift to regulated market. If the contrary situation was verified, consumers would shift to the liberalized market. As a consequence of the liberalization process, we had to consider in our valuation model the move of clients to liberalized market, or to other competitors. This shift was made at a slower pace, but with the objective of the fully liberalization in 2014, since it will be difficult to shift all clients until 2013, according to EDP and ERSE.
Supply of electricity and gas is facing another issue that can shiver expected revenues for this area. Recently, the Portuguese Government decided to increase VAT (Value Added Tax) from 6%, the rate applied to essential goods, to 23%, the rate that is applied to general products. This means that if a consumer maintains his/her electricity consumption, the value that he/she will pay in the end will be higher. However, this increase is not reflected in an increase of EDP’s revenue.
We know that EDP’s client portfolio assembles two types of consumers: private ones (families and particular houses) or, in other words, normal low-voltage clients, and industrial ones, which gathers medium/voltage and very high-voltage. This increase in taxes only will affect private consumers, since companies can recover it. Accounting with this fact, we can analyse this effect, only taking into account consumption from private clients, through the price-demand elasticity, bearing in mind that electricity is a good that cannot be easily replaced. In the very short term the effect of this tax increase on revenues will be zero, since consumers will not feel this change in the moment of its implementation, meaning that demand is practically inelastic. However, throughout time this elasticity is expected to increase. In the short-medium term elasticity may assume values between 0 and 0.5, since consumers will see that the amount they are paying is higher. Thus, they will cut their expenses in other goods that can be easily replaced by others very similar instead of cutting in the electricity consumption. In the long run elasticity will be close to 1 as people will opt to change their equipments for ones that use greener sources of energy8. However, this effect is much more complicated to include in our valuation model than it seems, because
8
Source: Mark A. Bernstein, James Griffin in “ Regional Differences in the Price-Elasticity of Demand for Energy”
Graph 14 - Clients by voltage in Portugal
Source: EDP
VAT increase will have some implications on final consumers...
0 10.000 20.000 30.000
Very high High/Medium Low
EDP–ENERGIAS DE PORTUGAL COMPANY REPORT
THIS
DOCUMENT
IS
NOT
AN
INVESTMENT
RECOMMENDATION
AND
SHALL
BE
USED
EXCLUSIVELY
FOR
ACADEMIC
PURPOSES
(SEE DISCLOSURES AND DISCLAIMERS AT END OF DOCUMENT)it will have effect in many variables. This decrease in consumption will affect energy supplied and may affect also load factors; if consumers decreased their utilization, power plants will not need to produce so much electricity, and so electricity production will be adjusted to demand. Still, it will not affect the sale price directly, since it is settled by the market, i.e. by the Iberian pool (OMIP). Instead, the cost related with the overall system (present in the client receipt) will increase. This new situation may also bring other issues. If clients’ bill will increase it may happen that some people will not be able to pay it in the end of the month, which will impact accounts receivable of the company (it will increase), and, who knows, perhaps Provisions. Given these accumulated effects, the Government may act, saying that the tariff charged to costumers will decrease, resulting in an increase of the Portuguese tariff deficit. For EDP, this may penalize its liquidity, which could lead to a debt increase. Besides all these possible effects, we considered the decrease in demand in our valuation model, but in a very simple way so that the model remained feasible and easily understandable.
In this business segment, the major risks associated are the market risk and economic risk. Since this activity is majorly liberalized and works under market conditions, it is subject to market fluctuations and volatility, which turns gross profit quite unstable and uncertain. Also, it has inherent economic risk because the market responds quite directly to economic conditions. For instance, during this period of crisis, prices went down and so the gross margins obtained by EDP.
EDP Renováveis
EDP Renováveis (EDPR) is a company that is responsible for the design, development, management and operation of power plants that produce electricity from renewable sources. The company appeared in 2007 as an EDP holding consequent from the participations that the company had in NEO Energia and Horizon Wind Energy. In June, 2008 EDP listed 22.5% of EDPR in an IPO on Euronext Lisbon, and since then it has been a listed company in Lisbon Stock Exchange market, as a member of the benchmark PSI-20 index being the fifth largest company by market capitalization. Nowadays, EDPR is the third largest player in the world wind energy (based on installed capacity) and is seen as a top three company that as the major growth potential in the sector.
EDPR is present in three main geographic areas, North and South America, and Europe. At the moment the company operates more than 180 wind farms in these markets and has other plants under construction in Italy, Canada and the UK. In Graph 15 - Cumulative returns
EDPR vs. PSI20
Source: Bloomberg
EDPR represents 22% of
the Group’s EBITDA
55% 65% 75% 85% 95% 105%
Ja
n-10
M
ar
-10
M
ai
-10
Ju
l-10
S
et
-10
Nov
-10
Ja
n-11
M
ar
-11
M
ai
-11
Ju
l-11
S
et
-11
Nov
-11
EDP–ENERGIAS DE PORTUGAL COMPANY REPORT
THIS
DOCUMENT
IS
NOT
AN
INVESTMENT
RECOMMENDATION
AND
SHALL
BE
USED
EXCLUSIVELY
FOR
ACADEMIC
PURPOSES
(SEE DISCLOSURES AND DISCLAIMERS AT END OF DOCUMENT)Europe the company is present in countries like Portugal, Spain, France, Belgium, Poland and Romania But is the Spanish market that represents the biggest European player in terms of installed capacity, as we can see in the Graph 16, mainly because it is in Spain the company has the major pipeline in Europe. At the moment, EDPR has an installed capacity of 7,280 MW, with 490 MW still under construction. The load factors the company presents are higher than the market average, which contributes positively to the strong performance of the company. The average load factor of the current portfolio is about 29% while for the new projects is around 30%9. This fact is very important, since it reveals EDPR’s ability
to choose projects that are able to generate more revenues than the previous ones, contributing positively for the company to become a reference in wind generation.
EDPR, as EDP, is a highly regulated company, with more than 90% of its portfolio being subject to regulated frameworks of long-term contracts. However, the regulation varies according to the
market that we focusing our attention. Regarding the European and Brazilian markets it is expected a price stability granted by regulation and long-term contracts. The UE mandatory targets for 2020 indicate a strong growth in wind market. The
20% quota of renewable energy sources for electricity generation remains unchangeable, with wind onshore being the major contributor for the renewable capacity growth10. In USA there is a huge incentive to invest in green sources of energy, since utilities acquire these sources in the form of long-term PPA. Plus, wind farms receive tax incentives that can be in a cash format, representing a percentage of the initial investment, or in the form of a production credit updated to inflation in the first 10 years of the investment.
Analysis
EDPR represents a company that has a huge growth potential, mainly driven by the growing environmental concerns. We believe that the company will continue to receive some Governmental support, from both USA and Europe, as they have
9
Source: EDP Renováveis
10
Source: EDP Renováveis
Graph 16 - Installed capacity of EDPR (MW)
Source: EDPR
The environmental concern is a major source of growth for EDPR
0 500 1.000 1.500 2.000 2.500 3.000 3.500
2009 2010 9M2011
Spain
Portugal Rest EU