Identification And Analysis Of Pollution In Thirumani Muthar
River Using Remote Sensing
T. Subramani
1, P. Someswari
21
Professor & Dean, Department of Civil Engineering, VMKV Engg. College, Vinayaka Missions University, Salem, India.
2
PG Student of Environmental Engineering, Department of Civil Engineering, VMKV Engg. College,Vinayaka Missions University, Salem, India
ABSTRACT
This study focused on water quality for Thirumanimuthar river basin, the possible auxiliary drinking water source of salem town tamilnadu. Through remote sensing (RS) approach, water quality retrieval models were established and analyzed for eight common concerned water quality variables, including algae content, turbidity, and concentrations of chemical oxygen demand, total nitrogen, ammonia nitrogen, nitrate nitrogen, total phosphorus, and dissolved phosphorus, by using Landsat 5 Thematic Mapper (TM) data. The results showed that there existed a statistical significant correlation between each water quality variable and remote sensing data in the slightly-polluted inland water body with fairly weak spectral radiation. With appropriate method of sampling pixel digital numbers and multiple regression algorithms, algae content, turbidity, and nitrate nitrogen concentration could be retrieved within 10% mean relative error, concentrations of total nitrogen and dissolved phosphorus within 20%, concentrations of ammonia nitrogen and total phosphorus within 30% while chemical oxygen demand had no effective retrieval method. These accuracies were acceptable for the practical applications of routine monitoring and early warning on water quality safety with some support of precise traditional monitoring. The results showed that it was possible and effective to perform most traditional routine monitoring tasks of water quality on relatively clean inland water bodies by remote sensing. Hydro geochemical studies have been made in the study area by using multivariate statistical analysis, which is mainly helpful for interpretation of complex data matrices to better understand the geochemical evolution of the area and it allows identifying the possible factors/ sources that influence water systems. The spatial distribution of electrical conductivity reveals that an untreated industrial effluents, landfill and anthropogenic activities affecting their groundwater quality in its vicinity and the surrounding area. The dominance of ions was in
the order of Na+ > Ca2+ > Mg2+ > K+ = Cl- > HCO3- > SO42-> NO3-and Ca2+
> Mg2+ > Na+ > K+ = HCO3- >Cl- > NO3- > SO42- during pre monsoon (PRM) andpost monsoon (POM), respectively. The statistical results reveals that the groundwater chemistry gets altered by silicate weathering, ion exchange, leaching, anthropogenic input from agricultural return flow and longer distance of migrating groundwater. The hydro geochemical regimes are distributed along the upstream side, northwestern, western and eastern parts of the study area. The study highlights the descriptive capabilities of conventional and multivariate techniques as effective tools in groundwater evaluation.
KEYWORDS:
Thirumanimuthur, Remote sensing, Ground water, Hydro Geochemical.I.
INTRODUCTION
The object of this research has been to do a overall examination of Tamil Nadu State –mainly in its demographic and socio-economic aspects– with a closer focus on water condition, in terms of rainfall, surface and ground water resources, domestic and industrial demand, and water pollution. With this research we have been able to select some target areas for implementing a project on water filtration plants and water distribution and supply for BOP market, identifying a number of cities with a population range between 500.000 and 1.000.000 habitants, where our partner MFI Equitas is present
with its branches offering financial and non-financial products. Based on Census 2001, the cities that are responding to our requirements are Tiruchirapalli and Salem, with a population of 866,354 and 751,438 respectively; we decided also to consider other two towns, Erode and Vellore, because its populations (of 389,906 and 386,746 respectively) are growing swiftly. All of these cities lie in the north and central part of the southernmost State of India; Tiruchirapalli and Vellore are important administrative centres, whereas Salem is one of the major producers of textile, steel,automotive, poultry and sago industries and Erode main productions are
handloom and power loom textile. Because of main industrial complexes (as tanneries which are located in Vellore, Tiruchirapalli and Erode districts, a large number of textile bleaching and dyeing units in Erode and Salem, and other industries as chemical in Tiruchirapalli district and sugar mill in Erode) the major part of water body in these areas are contaminated and classified from slightly to highly polluted. The research highlights, therefore, the poor condition of water resources in Tamil Nadu –both for natural condition and heavy industrial presence– and the need of safe drinking water for BOP population, who uses to collect water from polluted and without quality control basins and wells near to their settlements.
Tamil Nadu (Country of the Tamils) is one of the 28 states of India, laying in the southernmost part of the Indian Peninsula and is bordered by the States of Pondicherry, Kerala, Karnataka, and Andhra Pradesh. Its capital and largest city is Chennai (former known as Madras). Tamil Nadu is the eleventh largest state in India by area and the seventh most populous state. It is the fifth largest contributor to India's GDP and the most urbanised state in India. The state has the highest number (10.56%) of business enterprises in India, compared to the population share of about 6%. It is one of the foremost states in the country in terms of overall development.
1.GENERAL 1.1. Geography
Tamil Nadu covers an area of 130,058 square kilometres and it is the eleventh largest state in India. The bordering states are Kerala to the west, Karnataka to the northwest and Andhra Pradesh to the north, to the east is the Bay of Bengal and the union territory of Pondicherry. The town of Kanyakumari is the southernmost tip of the Indian Peninsula, where the Arabian Sea, the Bay of Bengal, and the Indian Ocean flow together.
The geographical territory is bound by the Eastern Ghats in the north, the Nilgiri, the Anamalai Hills, and Palakkad on the west, by the Bay of Bengal in the east, the Gulf of Mannar, the Palk Strait in the south east, and by the Indian Ocean in the south.
1.2. Climate
Tamil Nadu, with a climate range from dry sub-humid to semi-arid, is heavily dependent on monsoon rains, and thereby is prone to droughts when the monsoons fail. The state has three distinct periods of rainfall: an advancing monsoon period, from June to September, with strong southwest winds; a North East monsoon from October to December; and a dry season, from January to May.
1.3. Population growth
The population growth rate in Tamil Nadu had started declining in eighties itself. In 1991 the decadal growth rate was 15.4 percent for Tamil Nadu compared to the All-India rate of 25.8 per cent. This rate declined further to 11.2 percent for Tamil Nadu in 2001 while the All-India rate declined to 21.3 per cent.
1.4. Human Development Index
Tamil Nadu HDI (2001) is 0.657 as compared to 0.571 for India as a whole. Tamil Nadu is also placed well in the South Asian context. The State's per capita income is above the national average and it occupies fifth place in the ranking of 15 major states in India. Tamil Nadu has the second lowest fertility rate next only to Kerala. Life expectancy at birth for males and females is 64.85 and 65.20 respectively. The literacy rate has been increasing over the years reaching the level of 73.47 percent in 2001, next only to Kerala and Maharashtra. The National HDR prepared by the Planning Commission, Government of India, places Tamil Nadu at the third position with an HDI value of 0.531 among 15 major States. Specific data, on each of the indicators such as life expectancy at birth (LEB), literacy and income suggest, however, that while Tamil Nadu is placed well above the all India average it still lags behind some States for example, Kerala is well ahead of Tamil Nadu in literacy and LEB while Maharashtra is ahead in LEB and income. Therefore, Tamil Nadu focus in the next decade should be to reach the levels attained by Kerala in health and educational attainment, while aiming at increasing the levels of SDP to those of Punjab or Maharashtra in order to reduce poverty and inequality.
1.5. Demographic Transition in Tamil Nadu
Among the 15 major States in India, Tamil Nadu is the sixth most populous State and its population accounted for 6.0 percent share of the national population of 1027.02 million. The Census 2001 results show the population of Tamil Nadu at 62.1 million comprising of 31.3 million males and 30.8 million females. The rural and urban population is 34.9 million and 27.2 million, respectively. The density of population is placed at 478 per sq km.
1.6. Total Fertility Rate (TFR)
3.7.Birth Rate and Death Rate
According to the Tamil Nadu Human Development Report, the death rate in Tamil Nadu has declined by 40 percent in the last four decades whereas the birth rate has declined by about 30 percent. Further, the birth rate has been falling uniformly across the districts during the eighties and nineties with the exception of one or two districts and the rural urban differences have also narrowed down.
1.8. Sex-ratio
The sex-ratio in Tamil Nadu has improved slowly in the last decade. The combined (rural and urban) sex ratio was 958 in 1991 and 986 in 2001. All the regions have sex-ratio for the 0-6 years group of below 1000, declined in both rural and urban areas in 2001 compared to 1991.
1.9. Literacy and Health
The literacy rate in Tamil Nadu increased substantially from 62.7 to 73.5 percent between 1991 and 2001 with improvement across all segments. However, the rural-urban gap and gender gap are still to be bridged. Female literacy improved from 51.3 to 64.5 percent and male literacy rates improved from 73.7 to 82.3 per cent. Rural literacy improved from 41.8 to 55.8 percent and urban literacy improved from 69.6 to 75.6 percent and this gap between the rural and urban sectors remained even with each region. These figures are among the highest compared to many large states in India.
The health status can be judged in various ways and the commonly used measures are infant mortality rates (IMR) which also reflects the overall well-being of the society. The IMR in Tamil Nadu showed a rapid decline between eighties and 2000. It was about 125 in 1970 decreasing to about 68 in 1990 and further declining to 44 in 1999. The regional level variation once again highlights rural urban contrast though it is homogenous across regions within a sub-sector except for the southern region in rural Tamil Nadu.
1.10. Unemployment
The rural unemployment sector for Tamil Nadu (All-India) had about 13.5 percent (7.1) and is higher than most other states except Kerala and West Bengal whereas for the urban sector in Tamil Nadu it was 8.9 percent (7.7 percent) and is higher than most other south Indian states (except Kerala) and other industrialized states like Gujarat (4.2 percent). In 1999-2000 the urban unemployment rates are lower than rural rates across males and females. The female rates are higher than males in the urban sector but fluctuates for the rural sector. The unemployment rate has increased for all except females in urban sector.
1.11. Poverty and Employment
Tamil Nadu has made significant progress in terms of poverty reduction over the last few decades. In the period 1973-74 to 1987-88 the percentage of people living below poverty line in Tamil Nadu was higher than the all-India average. However since then, there has been a dramatic decrease in poverty levels: in 1973-74 the poverty level was 54.94 percent, it declined to 43.39 per cent in 1987-88 and further to 21.12 per cent in 1999-2000. Moreover, the incidence of poverty was relatively higher in rural areas till 1987-88 where as it declined steadily during the nineties thanks effective implementation of various poverty alleviation programmes. The structural changes in employment pattern are bound to have also affected the poverty rates among different occupation groups and employment status. The per capita consumption expenditure in Tamil Nadu grew at an annual rate of 1.9 percent for the rural sector and 5.5 percent for the urban sector between 1993-94 and 1999-2000.
1.12 .Urbanization
Tamil Nadu ranks first in urbanisation among the fifteen major States in the country. According to the 2001 Census, Tamil Nadu has emerged as the State with the highest level of urbanisation (43.86 per cent) in the country, increasing since 1961. 2.72 out of 6.21 crore of the total state population live in urban areas. Tamil Nadu has a very dispersed pattern of urbanisation with municipalities in virtually every district (excluding Ariyalur and Perambalur). The boundaries of Chennai District are contiguous with the Chennai Municipal Corporation. However, the Chennai Metropolitan Area is a larger area which includes several municipalities and town panchayats in Tiruvallur and Kancheepuram Districts.
Urbanisation Rate
The urbanisation rate marginally improved from about 33 percent in 1981 to 34.2 percent in 1991, but has significantly improved to about 44 percent in 2001. Though the rate of urbanisation has been fairly uniform across districts ranging between 40 percent and 50 percent for a large number of districts there are still wide variations. A large numbers of coastal districts have low rates of urbanisation (below 20 percent) with the exception of Tiruchirapalli (46 percent). Similarly among the southern districts Kanyakumari has a very high rate of 65 percent but Sivaganga and Ramanathapuram have rates 28 percent and 25 percent respectively. Among the inland districts Coimbatore has 66 percent whereas Dharmapuri has only 16 percent.
schemes. These schemes are providing wage employment or self-employment. The Public distribution system also provides a safety net for the poor. Since 1993-94, the percentage of people below poverty line was higher in urban areas than in rural areas: this increasing incidence is reflected in the accelerated growth of slums in cities and towns.
1.13. Growth of slum
A rapid increase in urban population results in the problems of straining or breaking-down of sanitary facilities and other infrastructure in cities and towns. The local bodies are faced with the responsibility of providing amenities with limited or often scant resources. The net result of this incongruity between the resources and responsibilities not only leads to formation of new slums but also gives new dimensions to the problem of slums.Slums are a formidable problem merely because the gap between resources and demand for shelter tends to exist perpetually.
The urban poor by themselves can neither afford to build pucca house or spare the hard earned money for stay in rented houses with basic amenities. Such people encroach Government and private lands kept vacant. Many slums are situated in vulnerable locations like river margins, water logged areas, road margins, etc.
Slum population accounts for 20 percent of the total population in the State. It is well known that the slum huts lack proper basic amenities such as living space, drainage, toilet and other facilities. Ultimately this aggregates the degree of morbidity and mortality among slum population. It is now widely recognized that the Government should only play a role of 'facilitator' and creator of 'enabling' climate for housing activities instead of being a direct provider of housing units. The Government of Tamil Nadu evolved its Housing Policy (1988) on the lines of the National Housing Policy.
1.14. Water supply
An increasing urban population has been creating a huge gap between demand and supply of water every year. The last Census estimated that approximately only 70 percent of urban towns have access to safe drinking water. The minimum per capita supply of water required in urban areas vary from 70 lit/day to 130 lit/day, and this requirement of water supply varies according to the land use classification of the towns.
Drainage
In Tamil Nadu underground drainage system has been provided only in major urban centres, like Salem, the municipal corporations of Chennai, Coimbatore, Tiruchirapalli, Tirunelveli and Madurai. In addition, underground drainage
systems have also been constructed in 12 municipalities accounting only for 10 percent of the total municipalities of the State.
Sewerage
In Tamil Nadu out of the 151 Municipalities and 5 Corporations, only 15 Municipalities and 4 Corporations have partial underground sewerage system. Sewage schemes are under implementation in the municipal towns of Erode, Pallipalayam, Bhavani and Komarapalayam and Tiruchirappalli corporation located along river Cauvery under the National River Action Plan. Further, new sewerage schemes under the National River Conservation Programme (NRCP) have been taken up in Tiruchirappalli, Madurai, Tirunelveli Corporations and Karur and Inam Karur, Kumbakonam, Thanjavur and Mayiladuthurai Municipalities.
During the year 2004-05 a policy decision was taken to provide underground sewerage scheme in the remaining 22 district head quarters towns. Apart from this, underground sewage schemes will also be taken up for the municipal towns in the Chennai metropolitan area. With a view to help people of all categories, especially economically weaker sections and low income groups, a new system called low cost sanitation scheme has been introduced in urban areas. So far 1,57,336 latrines all over the State have been taken up for conversion of dry latrine to flush latrines. Surface drainage is another aspect generally neglected in urban areas.
1.15. Solid Waste Disposal
Solid waste is generated in almost all parts of the urban areas and solid waste management becomes complicated in bigger cities: collection, transportation and disposal are the major operations involved in solid waste management. In most cities and towns, the refuse is dumped in an unsatisfactory and haphazard manner without sanitary land fill. The present generation of garbage in Urban local bodies ranges between 9000-10000 M.T. per day. Collection and segregation of garbage at source is practiced in 70 percent of wards in municipalities in the State. The goal is to achieve 100 percent source segregation, disposal of garbage in a safe manner and thereby making the habitation areas garbage free and also avoid contamination of natural resources. Privatization of Solid Waste Management has been encouraged in all municipalities and corporations.
II.
URBAN INDUSTRIAL POLLUTION
hotspots. The high influx of population to urban areas, increase in consumption patterns and unplanned urban and industrial development have led to the problem of air pollution. The larger industries have a very high aggregate pollution potential. Also, in many urban centres, industrial units are located in densely populated areas, thereby affecting a large number of people.
2.1 Economy
Agriculture is the prime mover of the state economy supporting 62 percent of the population and contributing 13 percent of the state income. The Government is aiming to achieve 100% food security in the State and also to create avenue for export of agricultural produce for economic enlistment of the farming community. During the tenth plan period, the State is aiming an annual growth rate of 4% in agriculture and 8% in horticulture crops for sustainable agricultural development, employment generation and poverty alleviation. The Government is focusing its policies towards overall development of agriculture sector in terms of increasing the cropping intensity by bringing every piece of land under cultivation, productivity increase, maximizing natural resources with parallel efforts to conserve them. The agricultural sector relies on improved crop varieties, fertilizers and pesticides to increase production.
2.2 Livestock, poultry, and fisheries production
Among states in India, Tamil Nadu is one of the leaders in livestock, poultry and fisheries production, having the second largest number of poultry amongst all the states and accounted for 17.7% of the total poultry population in India. In 2003 - 2004, Tamil Nadu had produced 37,836 lakhs of eggs, which was the second highest in India representing 9.37% of the total egg production in the country. With the third longest coastline in India, Tamil Nadu represented 27.54% of the total value of fish and fishery products exported by India in 2006.
2.3 Industrialization
Industrial policy initiatives in the State are designed in the backdrop of the increasing multifaceted globalization of production systems, especially, in terms of technology transfers and development of physical infrastructure for higher growth. Recognising the importance of industry, Tamil Nadu formulated the dynamic New Industrial Policy 2003 and evolved strategies to make the State a leading industrial destination in India. The New Industrial Policy has its focus on optimal use of resources, up-gradation of managerial skills and administrative, technical improvement and modernisation in the fields of manufacturing and infrastructure sectors for higher growth in Tenth
Five Year Plan Period. In the Information Technology sector, the State is a leader. Chennai has become a hub of software industry. Besides Information Technology, the State has made strident progress in automobile sector and is poised to record significant growth in the Textile Sector in view of the abolition of the Textile Quota regime.
2.4 Industrial Production
During the year 2004-05, a disaggregated analysis of manufacturing group of industrial sector at two-digit level shows that as many as 13 sub-groups with a total weight of 69.02 percent had registered a positive growth against eight sub-groups in the previous year of 2003-04.
Among them, robust growth rate was exhibited by machinery and equipment other than transport equipment (41.3%). The robust growth rate was displayed by other eight sub groups viz. rubber, plastic, petroleum and coal products (27.3%), basic metals and alloys (17.0%), wool, synthetic and fibre textiles (15.3%), leather products (14.3%), metal products and parts except electrical machinery (12.3%), chemical and chemical products (12.8%), transport equipment and parts (11.9%), beverages, tobacco and tobacco products (11.0%), and moderate growth by four sub-groups viz. non-metallic mineral products (7.6%) paper and paper products (6.5%), other manufacturing industries (4.7%) and food products (4.3%) .
However, cotton textiles (-5.2%) and textile products other than mills (-37.4%) witness deceleration during the review year. There are five main industrial complexes in TamilNadu: Manali/Ennore, Ranipet. Cuddalore, Mettur and Tuticorin which have chemical, petro-chemical and other industries. There are cement units, distilleries, sugar, sago, paper, dairying, electroplating, chemical and fertilisers (agro-chemicals), mining industries, ores/mineral processing industries and a variety of other industries which are water consuming and also generate large quantities of effluent. Some of the industries have also provided the treated effluent for irrigation with some degree of success. However, other industries, particularly a pulp plant faced serious problems when the effluent used for irrigation contaminates the surrounding wells.
2.5. Governance and administration
the state constitutes 39 Lok Sabha constituencies, 234 Assembly constituencies, 32 districts, 10 city corporations, 152 municipalities, 611 town panchayats and 12,618 village panchayats. Tamil Nadu had a bicameral legislature until 1986, when it was replaced with a unicameral legislature, like most other states in India.
Tamil Nadu has 10 City Corporations: Chennai, Coimbatore, Madurai, Tiruchirapalli, Salem, Tirunelveli, Erode, Tirupur, Vellore and Thoothukudi. There is a plan to upgrade Tambaram, Nagercoil and Ambattur as City Corporations. The Corporation of Chennai, established in 1688, is the oldest Municipal Corporation not only in India but also in any Commonwealth nations outside United Kingdom. Tamil Nadu has been a pioneering state of e-Governance initiatives in India. A large part of the government records like land ownership records are digitised and all major offices of the state government like Urban Local Bodies (all the Corporations and Municipal Office activities) revenue collection, land registration offices, and transport offices have been computerised. Tamil Nadu is one of the states where law and order has been maintained largely successfully. The quality of surface water has deteriorated in many countries in the past few decades.
As a result of the growing population, increasing industry, agriculture, and urbanization, the inland water bodies are confronted with the increasing water demand, as facing with extensive anthropogenic inputs of nutrients and sediments, especially the lakes and reservoirs. To handle this problem, it is necessary to carry out water quality assessment, planning, and management, in which water quality monitoring plays an important role . The current in situ techniques for measuring water quality variables are time-consuming and do not give a synoptic view of a water body or, more significantly, a synoptic view of different water bodies across the landscape. It requires excessive traveling, sampling, and expensive laboratory analysis, especially for a large area; thus it is very difficult to report and predict the water quality situation in time [4]. Fortunately, while with the development of remote sensing (RS) techniques, water quality monitoring based on RS methods becomes accessible and very efficient.
Therefore, remote sensing techniques have been widely used in estimating the pollution situation of surface water [8-10]. Today, many satellites with high enough resolution have been used in water quality monitoring studies. For instance, Thiemann and Kaufmann [11] found that a linear spectral unmixing method using IRS-1C satellite data yielded a good estimation of chlorophyll-a content in lakes. Water pollution is a serious problem in developing coun- tries as majority of surface and groundwater resources are contaminated by biological, toxic,
organic and inorganic pollutants (MoWR 2000). In arid and semiarid parts of India, groundwater resources have condensed due to vagaries in monsoons, increase in population, industriali- zation, use of fertilizers and pesticides, non-adoption of adequate soil conservation measures, improper crop rota- tion, non-planning and management of irrigation systems and extraction of groundwater in excess of recharge (Sri- vastava and Ramanathan 2008), which make aquifers water stressed and most parts of India are likely to face severe water scarcity by 2050 (SERI 2009).
Hydro geochemical evaluation study is becoming very important to determine the processes involved in the chemical evolution of groundwater (Andrade and Stigter 2011; Singh et al. 2012). Groundwater undergoes inorganic chemical reactions as it moves through fracture zones and interacts with the aquifer materials; it becomes more enriched with cations and anions (Runnels and Wahlin 1993). Differential multivariate statistical analysis like principal component analysis (PCA), factor analysis (FA) and hierarchical clustering analysis (HCA) are used as a numerical method for identifying surface and groundwater quality through data reduction and classification (Yidana et al. 2008; Kumaresan and Riyazuddin 2008; Raju et al.2009; Kvitek et al. 2009; Sundaray 2010; Prasanna et al.2012). This technique helps to simplify and organize data set in order to make useful generalizations and insight in water systems for reliable management of water resources and rapid solution for pollution problems (Raghunath et al.2002; Nosrati and Van Den Eeckhaut 2012; Bakari et al.2012). With studies on pollutants’ spectral features and improvement of retrieval algorithms, it is possible to perform water quality monitoring through RS on more water quality variables and with higher precisions. But they still could not meet all the needs of water quality management. And the previous studies were mostly carried out on the seriously polluted inland water body. However, the slightly polluted water bodies, especially those drinking water sources, have not been taken into consideration. The main reason is that they are of weak optical characteristics and low signal noise ratio. Anyway, they are practically the most important part of water quality management. Consequently, this is the challenging part of our research.
III.
REMOTE SENSING AND GIS
characteristics, economic development opportunities, and vegetation types. GIS allows you to link databases and maps to create dynamic displays. Additionally, it provides tools to visualize, query, and overlay those databases in ways not possible with traditional spreadsheets. These abilities distinguish GIS from other information systems, and make it valuable to a wide range of public and private enterprises for explaining events, predicting outcomes, and planning strategies. For more, see GIS.com.
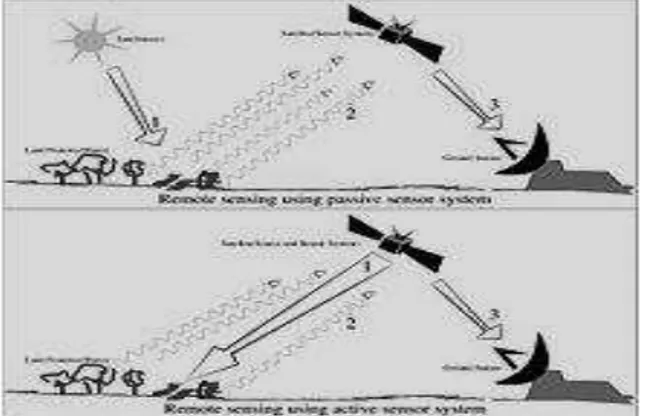
Remote sensing is the art and science of making measurements of the earth using sensors on airplanes or satellites. These sensors collect data in the form of images and provide specialized capabilities for manipulating, analyzing, and visualizing those images. Remote sensed imagery is integrated within a GIS. For more, see the Principles in Remote Sensing tutorials from the Satellite Observations in Science Education site.Remote sensing is the acquisition of information about an object or phenomenon without making physical contact with the object and thus in contrast to in situ observation. In modern usage, the term generally refers to the use of aerial sensor technologies to detect and classify objects on Earth (both on the surface, and in the atmosphere and oceans) by means of propagated signals (e.g. electromagnetic radiation). It may be split into active remote sensing, when a signal is first emitted from aircraft or satellites) or passive (e.g. sunlight) when information is merely recorded Passive sensors detect natural radiation that is emitted or reflected by the object or surrounding areas. Reflected sunlight is the most common source of radiation measured by passive sensors. Examples of passive remote sensors include filmphotography, infrared, charge-coupled devices, and radiometers. Active collection, on the other hand, emits energy in order to scan objects and areas whereupon a sensor then detects and measures the radiation that is reflected or backscattered from the target. RADAR and LiDAR are examples of active remote sensing where the time delay between emission and return is measured, establishing the location, speed and direction of an object.
Fig no 3.1 Illustration of remote sensing
Remote sensing makes it possible to collect data on dangerous or inaccessible areas. Remote sensing applications include monitoring deforestation in areas such as the Amazon Basin, glacial features in Arctic and Antarctic regions, and depth sounding of coastal and ocean depths. Military collection during the Cold War made use of stand-off collection of data about dangerous border areas.
Remote sensing also replaces costly and slow data collection on the ground, ensuring in the process that areas or objects are not disturbed. Orbital platforms collect and transmit data from different parts of the electromagnetic spectrum, which in conjunction with larger scale aerial or ground-based sensing and analysis, provides researchers with enough information to monitor trends such as El Niño and other natural long and short term phenomena. Other uses include different areas of the earth sciences such as natural resource management, agricultural fields such as land usage and conservation, and national security and overhead, ground-based and stand-off collection on border area.
Data acquisition technique:
The basis for multispectral collection and analysis is that of examined areas or objects that reflect or emit radiation that stand out from surrounding areas. For a summary of major remote sensing satellite systems see the overview table.
3.1 Applications of remote sensing data
Conventional radar is mostly associated with aerial traffic control, early warning, and certain large scale meteorological data. Doppler radar is used by local law enforcements’ monitoring of speed limits and in enhanced meteorological collection such as wind speed and direction within weather systems in addition to precipitation location and intensity. Other types of active collection includes plasmas in the ionosphere. Interferometric synthetic aperture radar is used to produce precise digital elevation models of large scale terrain (See RADARSAT, TerraSAR-X, Magellan).
Stereographic pairs of aerial photographs have often been used to make topographic maps by imagery and terrain analysts in trafficability and highway departments for potential routes.
3.2 Geodetic
3.3 Acoustic and near-acoustic
Sonar: passive sonar, listening for the sound made by another object (a vessel, a whale etc.); active sonar, emitting pulses of sounds and listening for echoes, used for detecting, ranging and measurements of underwater objects and terrain.
Seismograms taken at different locations can locate and measure earthquakes (after they occur) by comparing the relative intensity and precise timings. To coordinate a series of large-scale observations, most sensing systems depend on the following: platform location, what time it is, and the rotation and orientation of the sensor. High-end instruments now often use positional information from satellite navigation systems. The rotation and orientation is often provided within a degree or two with electronic compasses. Compasses can measure not just azimuth (i. e. degrees to magnetic north), but also altitude (degrees above the horizon), since the magnetic field curves into the Earth at different angles at different latitudes. More exact orientations require gyroscopic-aided orientation, periodically realigned by different methods including navigation from stars or known benchmarks.
3.4 Data processing
Generally speaking, remote sensing works on the principle of the inverse problem. While the object or phenomenon of interest (the state) may not be directly measured, there exists some other variable that can be detected and measured (the observation), which may be related to the object of interest through the use of a data-derived computer model. The common analogy given to describe this is trying to determine the type of animal from its footprints. For example, while it is impossible to directly measure temperatures in the upper atmosphere, it is possible to measure the spectral emissions from a known chemical species (such as carbon dioxide) in that region. The frequency of the emission may then be related to the temperature in that region via various thermodynamic relations. The quality of remote sensing data consists of its spatial, spectral, radiometric and temporal resolutions.
3.4.1 Spatial resolution
The size of a pixel that is recorded in a raster image – typically pixels may correspond to square areas ranging in side length from 1 to 1,000 metres (3.3 to 3,280.8 ft).
3.4.2 Spectral resolution
The wavelength width of the different frequency bands recorded – usually, this is related to the number of frequency bands recorded by the platform. Current Land satcollection is that of seven bands, including several in the infra-red spectrum, ranging from a spectral resolution of 0.07 to 2.1 μm. The
Hyperion sensor on Earth Observing-1 resolves 220 bands from 0.4 to 2.5 μm, with a spectral resolution of 0.10 to 0.11 μm per band.
3.4.3 Radiometric resolution
The number of different intensities of radiation the sensor is able to distinguish. Typically, this ranges from 8 to 14 bits, corresponding to 256 levels of the gray scale and up to 16,384 intensities or "shades" of colour, in each band. It also depends on the instrument noise.
3.4.4 Temporal resolution
The frequency of flyovers by the satellite or plane, and is only relevant in time-series studies or those requiring an averaged or mosaic image as in deforesting monitoring. This was first used by the intelligence community where repeated coverage revealed changes in infrastructure, the deployment of units or the modification/introduction of equipment. Cloud cover over a given area or object makes it necessary to repeat the collection of said location.
3.5 Radiometric correction
Gives a scale to the pixel values, e. g. the monochromatic scale of 0 to 255 will be converted to actual radiance values. Topographic correction (also called terrain correction) In rugged mountains, as a result of terrain, the effective illumination of pixels varies considerably. In a remote sensing image, the pixel on the shady slope receives weak illumination and has a low radiance value, in contrast, the pixel on the sunny slope receives strong illumination and has a high radiance value. For the same object, the pixel radiance value on the shady slope will be different from that on the sunny slope. Additionally, different objects may have similar radiance values. These ambiguities seriously affected remote sensing image information extraction accuracy in mountainous areas. It became the main obstacle to further application of remote sensing images.
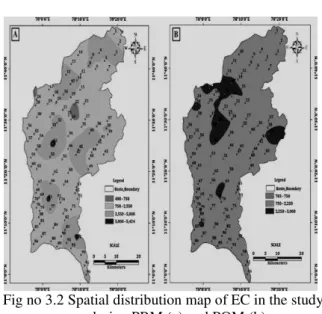
Fig no 3.2 Spatial distribution map of EC in the study area during PRM (a) and POM (b)
3.6 Atmospheric correction
Elimination of atmospheric haze by rescaling each frequency band so that its minimum value (usually realised in water bodies) corresponds to a pixel value of 0. The digitizing of data also makes it possible to manipulate the data by changing gray-scale values. Interpretation is the critical process of making sense of the data. The first application was that of aerial photographic collection which used the following process; spatial measurement through the use of a light table in both conventional single or stereographic coverage, added skills such as the use of photogrammetry, the use of photomosaics, repeat coveage
Making use of objects’ known dimensions in order to detect modifications. Image Analysis is the recently developed automated computer-aided application which is in increasing use.
IV.
RESULTS AND DISCUSSION
The statistical parameters like maximum, minimum, average and standard deviation of major ions are represented in Table 1. Detailed description of the findings is presented hereafter. Hydrogeochemical parameters. All the parameters show a wide fluctuation irrespective of seasons. The negative logarithm of Hydrogen ion (pH) concentration ranges from 6.78 to 9.22 and 5.3 to 8.6 during PRM and POM respectively indicating acidic to alkaline nature of groundwater. The EC ranges from 473 to 5,452 and 1,050 to 3,756 lS/cm during both seasons. Higher EC was noted in Salem region indicating the pol- luted nature of groundwater. Ca2? average ranges 74.17 and 93.32 mg/L during PRM and POM respectively. Mg2? average ranges 51.84 and 77.79 mg/L during both seasons. The Ca2? and Mg2? might be derived from dissolution of magnesium calcite and gypsum (Lakshmanan et al. 2003). High average (92.89) of
Na? is noted during PRM indi- cating sources from feldspar weathering (plagioclase bearing) along with over exploitation of groundwater (Hem 1985; Chidambaram et al. 2011). During PRM high aver- age (28.4 mg/L) of K is noted due to weathering of orthoclase, microcline and biotite from gneissic rocks. During POM, HCO3- average (907.79) is higher due to the action of CO2 upon the basic material of soil and granitic rock. Chloride
was high during PRM (339.79 mg/L) due to effective leaching from upper soil layers by industrial and domestic activities and dry cli- mates (Srinivasamoorthy et al. 2011b; Cheong et al. 2012). SO42- is higher in PRM (24.26 mg/L) due to release of sulphur gases from industries, which get oxidized and enter into the aquifer matrix during precipitation (Saxena 2004).
V.
CONCLUSION
Cleaner production is an attractive approach to tackle pollution in Tirumanimuthar River as environmental problems associated with industrial production and poor material efficiency. Since the cleaner production approach has been successfully implemented in some areas in the textile sector, sago serve and other industrial wastes, it shows that significant financial saving and environmental improvements can be made by relatively low-cost and straightforward interventions. This improves the quality of products and minimizes the cost of production, enabling the branch to compete in the global market with help of software.
Thus Remote sensing analysis has been carried out using Resource sat -1 multispectral satellite data along with DEM derived from IRS P5 stereo pair. GIS database generated of various thematic layers viz. base layer - inventorying all water bodies in the vicinity, transport network and village layer, drainage, geomorphology, structure, land use. Analysis of spatial distribution of the features and change detection in land use/cover carried out to find out the site suitability for water treatment plant in salem corporation with extra accuracy. The method of applying software in analyzing the site suitability is most advance and detailed which is adopted in future technology with time consuming.
and HCO3 and Cl- were recorded higher during POM. Reverse ion exchange and recharge process was noted by replacement of Na by Ca2 and Mg2. The spatial distribution for EC indicates 42, 38 and 20 % of study area exposed to very high, high and low pollution indices. Correlation analysis reveals good correlation between EC and TDS due to the linear correlation between the dissolved ions and conductivity. Factor analysis derived four factors with a 64 % of total variance during PRM indicating the domination of silicate weathering, ion exchange, leaching, anthropogenic input and longer distance of migrating groundwater.
REFERENCES
[1] Ajibade, L.T, Ifabiyi, I.P.,Iroye, K.A. and Ogunteru, S, (2010), Morphometic Analysis
of Ounapa Drainage Basins,
Ibadan,Nigeria.Journal Of Environment Studies And Management, 3, pp.13-19. [2] Dury, G.H, (1952) Methods of
Cartographical Analysis in
Geomorphological Research Silver Jubilee Volume, Indian Geographical Society, Madras, pp.136-139.
[3] Freeman, T.G, (1991), Calculating The Catchment Area with Divergent Flow Based on A Regular Grid: Computers And Geosciences, 17, pp.413-422.
[4] H. Shahabi, (2012), Application of GIS Models in Site Selection of Waste disposal in Urban, Area, Journal Of Applied Physics, 1, pp.01-07.
[5] Horton R.E, (1932), Drainage Basin Characteristics, Trans. Am.Geophys.Unon, 13, pp.350-361.
[6] Horton R.E, (1945), Erosional Development Of Stream And Their Drainage Basins, Bull. Geo. Soc. Am., 56, pp.275-370. [7] Hosseinzadeh S, (2011), Drainage Network
Analysis, Comparison of Digital Elevation from ASTER With High Resolution Satellite Image and Areal Photographs, International Journal of Environmental Science and Development, 2, pp.194-198
[8] Khwanruthai Bunruamkaew and Yuji Murayama, (2011) Site Suitability Evaluation for Ecotourism Using GIS & AHP: A Case Study of Surat Thani Province: Thailand, International Conference of Spatial Thinking And Geographic Information Sciences, 21 pp: 269-279
[9] Miles Sb And HO CL, (1999), Application and Issues of Gis As Tool for Civil Engineering Modelling, J. Comp.City.Engrg. ASCE 13, pp.144-152.
[10] Nishanth.t, prakash m.n and vijith.h, (2010),