www.hydrol-earth-syst-sci.net/13/195/2009/ © Author(s) 2009. This work is distributed under the Creative Commons Attribution 3.0 License.
Earth System
Sciences
Evaluation of radar-gauge merging methods for quantitative
precipitation estimates
E. Goudenhoofdt and L. Delobbe
Royal Meteorological Institute of Belgium, Brussels, Belgium
Received: 15 September 2008 – Published in Hydrol. Earth Syst. Sci. Discuss.: 31 October 2008 Revised: 20 January 2009 – Accepted: 23 January 2009 – Published: 18 February 2009
Abstract. Accurate quantitative precipitation estimates are of crucial importance for hydrological studies and applica-tions. When spatial precipitation fields are required, rain gauge measurements are often combined with weather radar observations. In this paper, we evaluate several radar-gauge merging methods with various degrees of complexity: from mean field bias correction to geostatistical merging tech-niques. The study area is the Walloon region of Belgium, which is mostly located in the Meuse catchment. Observa-tions from a C-band Doppler radar and a dense rain gauge network are used to estimate daily rainfall accumulations over this area. The relative performance of the different merging methods are assessed through a comparison against daily measurements from an independent gauge network. A 4-year verification is performed using several statistical qual-ity parameters. It appears that the geostatistical merging methods perform best with the mean absolute error decreas-ing by 40% with respect to the original data. A mean field bias correction still achieves a reduction of 25%. A seasonal analysis shows that the benefit of using radar observations is particularly significant during summer. The effect of the network density on the performance of the methods is also investigated. For this purpose, a simple approach to remove gauges from a network is proposed. The analysis reveals that the sensitivity is relatively high for the geostatistical methods but rather small for the simple methods. The geostatistical merging methods give the best results for all tested network densities and their relative benefit increases with the network density.
Correspondence to:E. Goudenhoofdt ([email protected])
1 Introduction
Interest in quantitative estimation of rainfall based on weather radar has increased during the last years. Indeed new applications have risen in the field of distributed hydrologi-cal modelling or numerihydrologi-cal weather prediction which require accurate precipitation estimates at high spatial resolution.
Weather radar is a remote sensing instrument that mea-sures the reflectivity of precipitation at a given altitude. Those measurements can be used to estimate precipitation at ground level. Several sources of errors affect the accu-racy of this estimation (e.g., Wilson and Brandes, 1979; Joss and Waldvogel, 1990; Germann et al., 2006; Ciach et al., 2007). The measure of reflectivity itself can suffer from elec-tronic miscalibration, contamination by non-meteorological echoes or range effect (attenuation, increase of the sample volume due to beam broadening). When retrieving the rain-fall estimation at ground level, additional uncertainties arise. Those are due to the non-uniform vertical profile of reflec-tivity (VPR) and the conversion of radar reflecreflec-tivity into rain rates (Z-Rrelationship). Nevertheless, a weather radar pro-vides precipitation estimation at high spatial and temporal resolution over a large area. A network of rain gauges can provide more accurate point-wise measurements but the spa-tial representativity is limited. The two observation systems are generally seen as complementary and it is interesting to combine them.
tion of different existing merging methods. Several meth-ods of various degrees of complexity have been implemented and tested. All selected methods are appropriate for oper-ational use. Verification of the merging methods faces the problem that the real precipitation field is unknown. A tra-ditional approach is to compare precipitation estimates with rain gauges. Cross-validation (i.e. removing a gauge from the adjustment network to use it for verification) is a pos-sible method but the drawback is that the network used for adjustment varies. In this study an independent verification network is used, more suitable to analyse the performance of the methods. Since the time sampling of this network is 24 h, the merging is made on daily accumulations. Several statis-tics are then computed to evaluate and compare the different methods. Similar long-term verification has been performed in recent studies but limited to one (e.g., Borga et al., 2002; Holleman, 2007) or a few methods (e.g., Cole and Moore, 2008; Heistermann et al., 2008; Salek and Novak, 2008). In Schuurmans et al. (2007), three different geostatistical meth-ods have been compared based on 74 selected rainfall events. The impact of the gauge network density on the merging methods performance has been little assessed in past studies (Sokol, 2003; Chumchean et al., 2006). One of the contribu-tions of this paper is to determine the best method for a given network density.
The characteristics of the radar and the rain gauge net-works can be found in Sect. 2. The different methods used for merging are described in Sect. 3 and the results of a 4-year verification against rain gauges are presented in Sect. 4. In Sect. 5, a sensitivity analysis to the density of the network used for merging is carried out.
2 Radar and gauge observations
The Royal Meteorological Institute of Belgium (RMI) op-erates a single-polarisation C-band weather radar. It is lo-cated in Wideumont at 592 m above sea level. The radar ob-servations are routinely used at RMI for operational short-term precipitation forecast, detection of severe thunder-storms (Delobbe and Holleman, 2006) and a posteriori anal-ysis in the case of severe weather events. The use of the Wideumont radar observations for hydrological studies and
scan (0.3, 0.9, 1.8, 3.3 and 6 ) on a Cartesian grid with a resolution of 600×600 m2. The height of the pseudo-CAPPI is chosen to limit the effect of ground clutter. Reflectivity factors are then converted into precipitation rates using the Marshall-Palmer relationZ=aRb witha=200 andb=1.6. The 5 min images are integrated in time to produce a 24 h rainfall accumulation starting at 08:00 LT.
The hydrological service of the Walloon region (SPW) op-erates a dense (1 gauge per 135 km2) and integrated network of 90 telemetric rain gauges. Most of them are tipping bucket systems providing hourly rainfall accumulations. The col-lected data are used for hydrological modelling and directly sent to RMI. The rain gauges are controlled on site every three months and in a specialised workshop every year. Ev-ery day, a quality control of the data is performed by RMI using a comparison with neighbouring stations. Radar data are also used in this quality control for the elimination of outliers.
RMI maintains also a climatological network including 270 stations with daily measurements of precipitation accu-mulation between 8 and 8 local time (LT). These stations are manual and the data are generally available with a significant delay. The data undergo a drastic quality control. This net-work is routinely used for the long-term verification of radar precipitation estimates. It will be used here to evaluate the radar-gauge merging methods.
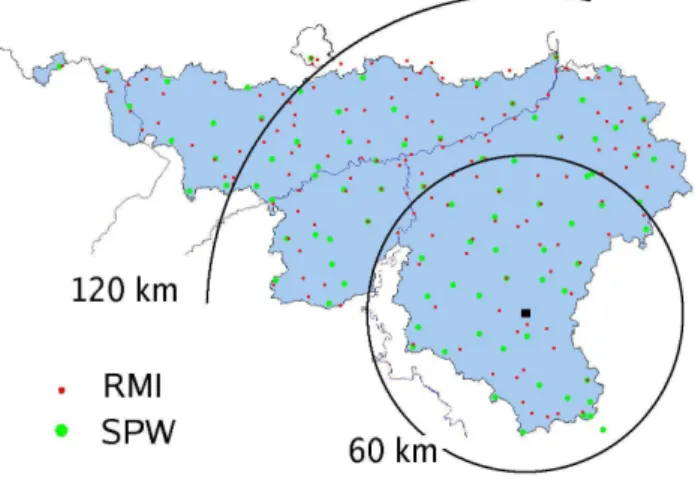
Since the estimation of precipitation can be very inaccu-rate at large distance from the radar, a maximum range of 120 km is used. The SPW network, used for adjustment, is then reduced to 74 gauges. Several stations of the RMI net-work are not always available during the 4-year verification period. Those stations are removed to ensure that the same network is used for the whole period. The remaining veri-fication network includes 110 gauges. The positions of the radar and the two rain gauge networks can be seen in Fig. 1. The topography of the area of interest is shown in Fig. 2.
3 Description of the methods
Fig. 1.Walloon Region with Wideumont radar (black square), SPW telemetric gauge network and RMI climatological gauge network.
rain gauge measurementGand a corresponding radar value R. The spatial sampling issue is of crucial importance when radar areal estimates are compared or combined with gauge point measurements (Villarini et al., 2008). In our study, the average over 9 radar pixels around the gauge location is used as the corresponding radar precipitation estimation. This allows limiting the effect of wind drift which can be very significant (Lack and Fox, 2007). Spatial sampling er-ror increases when the radar estimate is based on a larger number of pixels especially in convective situation. However this effect decreases with increasing accumulation time and is therefore relatively limited at a daily time scale. Besides, the use of a larger radar estimation area allows reducing the temporal sampling error.
Only the pairs for which bothR andGexceed 1 mm are considered as valid. A day is valid if there are at least 10 valid pairs. The methods are applied on a square domain containing the Walloon region. It means that some areas fall outside the network convex hull (i.e. the boundary of the min-imal convex set containing all the gauges). On those areas, adjusted values must be seen as extrapolation. The uncer-tainties associated with those values are then higher. 3.1 Mean field bias correction (MFB)
The assumption here is that the radar estimates are affected by a uniform multiplicative error. This error can be due for example to a bad electronic calibration or an erroneous co-efficienta in theZ-Rrelationship. The adjustment factor is estimated as a mean field bias:
CMFB= PN
i=1Gi
PN
i=1Ri
(1)
whereNis the number of valid radar-gauge pairs,Gi andRi are the gauge and radar values associated with gaugei.
Fig. 2.Topography of the Walloon region.
3.2 Range-dependent adjustment (RDA)
This method assumes that the R/G ratio is a function of the distance from the radar. Range dependences are essen-tially produced by the increasing height of the measurements, beam broadening and attenuation effects. The range depen-dent adjustment is mainly based on the BALTEX adjustment method (Michelson et al., 2000). The relation betweenR/G expressed in log-scale and range is approximated by a second order polynomial whose coefficients are determined using a least squares fit.
logCRDA=ar2+br+c (2)
wherer is the distance from the radar. The range dependent multiplicative factorCRDAis derived from the polynomial fit. 3.3 Static local bias correction and range dependent
adjust-ment (SRD)
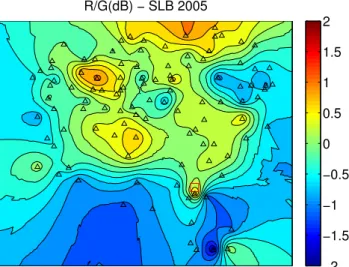
The static local bias correction aims at correcting for visibil-ity effects. The correction is calculated from a one-year data set using the climatological gauge network. The 24 h radar accumulations are first adjusted by a mean field bias correc-tion. Then, for each gauge location, the averaged residual bias over 1 year is estimated. Finally a spatial interpolation based on kriging is performed to obtain the correction field. To simulate an operational context, the correction calculated over a given year is used for the next year. The fields ob-tained for 2004, 2005 (see Fig. 3), 2006 and 2007 are very similar. This correction is applied before a range dependent adjustment (Slb+RDa=SRD).
3.4 Brandes spatial adjustment (BRA)
−2 −1.5
Fig. 3. Static local bias correction field (in dB) for the year 2005 with gauges (triangles) and radar (square) locations.
on a negative exponential weighting to produce the calibra-tion field:
CBRA= PN
i=1wi(Gi/Ri)
PN
i=1wi
wi =exp
−di2
k (3)
wherediis the distance between the grid point and the gauge i. The parameterkcontrols the degree of smoothing in the Brandes method. It is assumed constant over the whole do-main. The parameterkis computed as a function of the mean densityδof the network, given by the number of gauges di-vided by the total area. A simple inverse relation has been chosen:
k=(2δ)−1 (4)
The factor 2 was adjusted to get an optimalkfor the full net-work. The optimalkwas estimated by trial and error based on the verification for the year 2006. The same relation be-tweenkandδis used for the reduced networks (see Sect. 5). 3.5 Ordinary kriging (KRI)
A geostatistical method like ordinary kriging deals with the spatial interpolation of a random field from observations at several locations. A general description is presented in Goovaerts (1997). This method requires the definition of a variogram characterising the spatial variability of the precip-itation field. The estimation U0 at a specific location is a linear combination of the gauge valuesGi:
U0= N X
i=1
λiGi (5)
The weightsλiare computed to obtain the best linear unbi-ased estimator assuming a constant unknown mean across the
2005 2006 2007 2008
0 0.5
Year
Fig. 4.Mean absolute error of all radar-gauge merging methods.
field. This involves solving a linear equation system whose size is equal to the number of gauges.
In this study, only the 20 nearest gauges are used. This allows reducing the computational cost with little loss of ac-curacy. The model variogram, assumed isotropic, is a first order linear function of the distance. More complex climato-logical variograms (i.e. Gaussian, exponential and spherical) have been tested but no significant improvements of the per-formance were observed. Those results are consistent with the study of Haberlandt (2007). The KRI method, based only on rain gauges, is used to evaluate the added value of radar observations in the other methods.
3.6 Kriging with radar-based error correction (KRE) This method referenced as “conditional merging” in Sinclair and Pegram (2005) uses the radar field to estimate the error associated with the ordinary kriging method based on rain gauges and to correct it. First, radar values at each gauge site are used to produce a radar-based kriging field. This field is then subtracted from the original radar field to obtain an error field. Finally, the error field is added to the gauge-based kriging field. The KRE method is relatively simple and computationally efficient.
3.7 Kriging with external drift (KED)
ORI MFB RDA SRD BRA KRI KRE KED 0
0.5 1 1.5 2 2.5
methods
MAE (mm)
WID 24H R/G MAE (mm) −− 2005−2008 (612 days )
Fig. 5.Mean absolute error of all methods based on a 4-year verifi-cation.
the radar field. Additional constraints are then added to this scheme:
N X
i=1
λiRi =R0 (6)
whereRi is the radar value at gauge locationi,λi the cor-responding weight andR0 the radar value at the estimation location. The weights are given by solving the augmented system of linear equations. The variogram is also assumed linear and isotropic. This is the most complex and time con-suming method. Note that an automatic method to compute a variogram model has been proposed recently by Velasco-Forero et al. (2008).
4 Long-term verification
4.1 Methodology
The performance of the radar-gauge merging methods has been evaluated by comparing the adjusted 24-h precipita-tion accumulaprecipita-tions R to the measurements of the climato-logical gauge networkG. The testing period extends from 2005 to 2008, which includes 612 valid days. The gauge data used for the adjustment and for the verification are in-dependent. Unfortunately the two networks have several lo-cations in common or very close. The gauges of the RMI network situated at a distance less than 2 km from a gauge of the SPW network are then removed. The remaining verifica-tion network includes 75 gauges.
Several quality parameters are found in the literature. The Root Mean Square Error:
RMSE= s
PN
i=1(Ri−Gi)2
N (7)
−2 −1.5 −1 −0.5 0 0.5 1 1.5
10 20 30 40 50 60 70 80 90
WID 24h R/G −− ERROR DISTRIBUTION 2005−2008
R/G ratio [dB]
Cumulative rainfall [%]
ORI MFB RDA SRD BRA KRI KRE KED
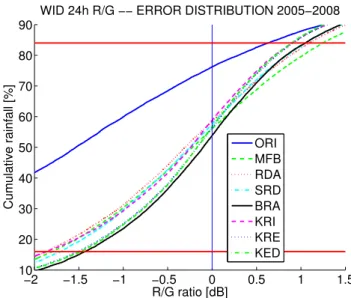
Fig. 6.Error distribution based on a 4-year verification. The scatter score for one method is half the distance between the 2 intersections of the curve with the 2 red lines.
is the most common parameter used in verification studies. However, the Mean Absolute Error:
MAE= PN
i=1|Ri−Gi|
N (8)
is less sensitive to large errors and it is used here as first qual-ity parameter. All pairs of gauge radar values are taken into account for these parameters.
A standard for objective judgement of radar performance is proposed in Germann et al. (2006). The mean bias, the error distribution and the scatter as defined in that paper are also used in the present study. The mean bias (MB) is the total precipitation as seen by the radar divided by the total precipitation measured by the gauges. The error distribution is the cumulative contribution to total rainfall as a function of the R-G ratio expressed in dB. The scatter is half the distance between the 16% and 84% percentiles of the error distribu-tion. It is a robust measure of the spread of the multiplicative error, insensitive to outliers. The standard deviation of the multiplicative error (STD) and the root mean square factor:
RMSF(dB)= v u u t
PN i=1
10 logRi
Gi
2
N (9)
have also been calculated. Only pairs with both adjusted and gauge values larger than 1 mm for all the methods are taken into account. This ensures that the same data set is used for comparison between the different methods.
4.2 Results
ORI MFB RDA SRD BRA KRI KRE KED 0
methods
Fig. 7.Scatter score for all methods based on a 4-year verification.
the results between the four datasets. As illustrated in Fig. 4, the relative performance of the different methods is similar for the four years. Nevertheless, the ordinary kriging method (KRI), using only rain gauges, exhibits some variability be-tween the years. The 4 years taken as a whole will now be considered for the rest of the evaluation.
As shown in Fig. 5, the Mean Absolute Error (MAE) of all methods is significantly reduced compared to the MAE of the original radar data (ORI). A simple mean field bias (MFB) correction reduces the error by about 25%. Using the range dependent adjustment (RDA) allows a small additional im-provement. A further improvement is obtained when a static local bias (SRD) correction is applied. The performance of the latter method is close to the Brandes one (BRA), which is also a spatial method. The ordinary kriging method (KRI), only based on rain gauge data, shows a result close to the RDA method. This good result is due to the high density of the rain gauge network (see Sect. 5). The two geostatis-tical methods using both radar and rain gauge observations (KRE, KED) perform best for this quality parameter. When the KED method is used, the error decreases by almost 40% with respect to the original data.
Figure 6 shows the error distribution for the different methods. The vertical line divides theR/Gratios (in dB) in underestimation (left) and overestimation (right). A perfect match should give a step function, with a mean bias and a scatter equal to zero. The original radar data (ORI) reveal a significant underestimation with a mean bias of−1.2 dB. The mean field bias correction (MFB) succeeds in balancing the error distribution. The method combining a range-dependent adjustment and a static local bias correction (SRD) slightly reduces the spread of the error while the most sophisticated geostatistical method (KED) further tightens the error distri-bution. The ordinary kriging (KRI) shows a small underesti-mation.
Jan Feb Mar Apr May Jun Jul Aug Sep Oct Nov Dec 0.4
0.5
Month
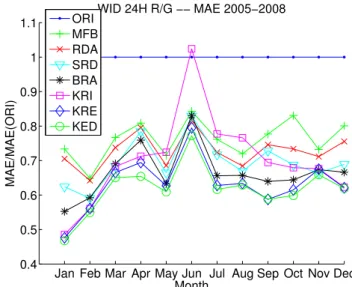
Fig. 8. Mean Absolute Error of all methods computed for each month and normalised by the Mean Absolute Error of the original radar data.
The results for the scatter (Fig. 7) are similar to the re-sults for the MAE. It is worth pointing out that the relative performance of Brandes compared to the other methods is slightly better. Actually this method can sometimes lead to large errors that are taken into account for the MAE but not for the scatter. This figure also shows that methods with a daily spatial correction feature based on radar and gauges (BRA, KRE, KED) perform significantly better.
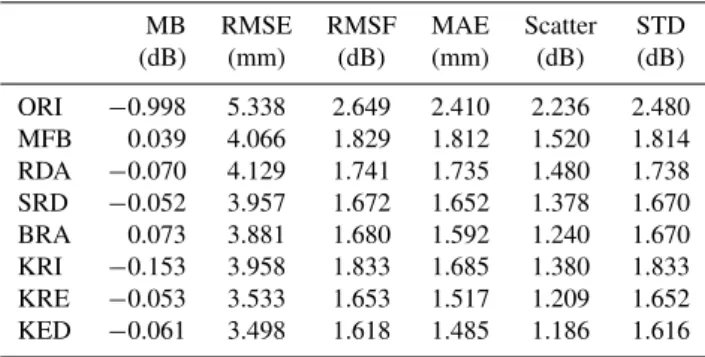
The values of the different statistics for all the methods can be found in Table 1. It appears that the ranking of the methods is very similar for the different scores.
4.3 Seasonal variation
The spatial pattern of 24 h rainfall accumulation varies sig-nificantly along a year, from widespread precipitation during stratiform events in winter to very local precipitation cells during convective events in summer. Therefore the accuracy of radar precipitation estimates and the spatial representativ-ity of gauge measurements depend on the season.
0−20 20−40 40−60 60−80 80−100 100−120 0
0.1 0.2 0.3 0.4 0.5 0.6 0.7 0.8 0.9 1
Distance (km)
MAE/MAE(ORI)
WID 24H R/G −− MAE 05/01/01−08/12/31
ORI MFB RDA SRD BRA KRI KRE KED
Fig. 9.Effect of the distance from the radar on the Mean Absolute Error of all methods normalised by the Mean Absolute Error of the original radar data.
4.4 Range-dependence
The performance of the different algorithms as a function of range is analysed up to 120 km from the radar. The study area is divided into 6 range intervals of 20 km as shown in Fig. 9. The gap between the performance of the radar and that of the gauges is significant at short distance (<20 km) due to the bright band effect. This is also the case at long distance (>100 km) due to the decreasing accuracy of radar estimates. The small difference between KRI and KRE or KED at those ranges shows that the radar added value is very limited. The positive effect of the range dependent adjustment when com-pared to the mean field bias appears at distances further than 80 km. KED is the best method for all distances. Seasonal variation of the range dependence may exists and a prelimi-nary analysis of this effect has been performed. A significant variability between the years has been found and no robust conclusions could be reached.
5 Effect of the network density
The effect of gauge density on the performance of the dif-ferent merging methods has been analysed. This is useful to select the most appropriate method for a given network den-sity or to determine the minimum network denden-sity needed to achieve a given level of performance. None of the methods takes directly into account the density of the network except the Brandes method where an inverse relation is used to de-termine the smoothing factork(see Sect. 3).
Table 1.Several statistics (see Sect. 4.1) for the 4-year verification of radar-gauge merging methods.
MB RMSE RMSF MAE Scatter STD (dB) (mm) (dB) (mm) (dB) (dB)
ORI −0.998 5.338 2.649 2.410 2.236 2.480 MFB 0.039 4.066 1.829 1.812 1.520 1.814 RDA −0.070 4.129 1.741 1.735 1.480 1.738 SRD −0.052 3.957 1.672 1.652 1.378 1.670 BRA 0.073 3.881 1.680 1.592 1.240 1.670 KRI −0.153 3.958 1.833 1.685 1.380 1.833 KRE −0.053 3.533 1.653 1.517 1.209 1.652 KED −0.061 3.498 1.618 1.485 1.186 1.616
5.1 Removing gauges
As the region seen by the radar is characterised by low cli-matological variations, the assumption that the probability of precipitation is the same everywhere is valid. Consequently, a perfect network should be made of a regular grid of points considering a rectangular area. Actually the position of the gauges depends on practical constraints and specific interest on catchment. The spatial distribution of gauges in a real net-work is then less uniform. It is obvious that gauges cannot be randomly removed from the network. Indeed, when the fur-thest gauge is removed, the coverage area decreases. Further-more, a gauge that belongs to the convex hull (see Sect. 3) cannot be removed without decreasing the study area. A rain gauge must be removed from the network in such a way that the spatial distribution of the remaining gauges is as uniform as possible. A simple approach is proposed here, based on the distance between gauges. For each gauge, the sum of the inverse of the distance to the four nearest gauges is com-puted. Then the gauge with the maximum value (that is too close to its neighbours) is removed. The effect of the algo-rithm can be seen in Fig. 10 which shows the reduced net-works of 50 and 20 gauges. Note that the convex hull is rela-tively well preserved while the number of gauges decreases. 5.2 Global statistics
A long term verification is performed with decreasing net-work densities. For the sake of consistency, the valid days for adjustment (see Sect. 3) at the lower density are taken as the common verification dataset for all densities.
150 200 250 300 200
km N=20
Radar
Fig. 10.Gauge network of decreasing densities obtained by an al-gorithm for removing gauges.
methods (KED, KRE) follow the same tendency but with a lower sensitivity. KED is the best method for all network densities. However, for the lowest tested density (1 gauge per 500 km2), the static local bias followed by a range dependent adjustment (SRD) performs as well as the most sophisticated methods (KRE and KED). Similar results have been obtained with the other quality parameters.
6 Conclusions
Various methods combining rainfall estimations from a C-band weather radar and an automatic rain gauge network have been implemented. A 4-year verification up to 120 km range was carried out against an independent gauge network of daily measurements. Several statistics have been com-puted to evaluate the performance of the radar-gauge merg-ing methods. The effect of the network density has also been tested.
The results point out that simple methods like mean field bias correction can significantly reduce the error of the radar estimation. Nevertheless, there is a clear benefit of using a spatial correction factor. Based upon our verification study, the best method is the kriging with external drift which makes use of the radar as secondary information to improve the spatial interpolation of gauges values. The kriging with radar-based error correction shows very similar performance while the computational cost is reduced. A seasonal verifica-tion shows interesting results. In the winter, when stratiform widespread precipitation prevails, the ordinary kriging based on gauges performs as well as the best radar-gauge merging method. In the summer, when convective events occur, the added value of radar observation is very clear. The sensitivity
20 30 40 50 60 7074
1.8 2 2.2
Number of gauges
MAE (mm)
Fig. 11. Mean absolute error of the merging methods for different network densities from 1 gauge per 500 km2(N=20) to 1 gauge per 135 km2(N=74).
analysis to the gauge network density shows that the geosta-tistical merging methods perform best for all tested densities. Furthermore, their relative benefit increases with the density. A method combining a static local bias correction and a range dependent adjustment is less sensitive to the gauge density. For the lowest tested network density (1 gauge per 500 km2), this method is as efficient as the most sophisticated merging methods.
Acknowledgements. The authors would like to thank the four referees for their very valuable questions, comments and sug-gestions. The data from the automatic rain gauge network were kindly provided by the hydrological service of the Walloon Region of Belgium (Phillipe Dierickx and Marina Thunus). The contri-bution of Georges Bastin, Guillaume Leclercq and Luc Moens from the Centre for systems engineering and applied mechanics (Universit´e catholique de Louvain) in the operational use of radar for hydrological applications is highly appreciated. Thanks to Maarten Reyniers for helpful comments and to Didier Dehem for providing the topography map. This study was carried out with the financial support of the Belgian Federal Science Policy Office.
References
Berne, A., ten Heggeler, M., Uijlenhoet, R., Delobbe, L., Dierickx, Ph., and de Wit, M.: A preliminary investigation of radar rainfall estimation in the Ardennes region and a first hydrological appli-cation for the Ourthe catchment, Nat. Hazards Earth Syst. Sci., 5, 267–274, 2005,
http://www.nat-hazards-earth-syst-sci.net/5/267/2005/.
Borga, M., Tonelli, F., Moore, R. J., and Andrieu, H.: Long-term assessment of bias adjustment in radar rainfall estimation, Water Resour. Res., 38, 1226, doi:10.1029/2001WR000555, 2002. Brandes, E. A.: Optimizing rainfall estimates with the aid of
RADAR, J. Appl. Meteorol., 14, 1339–1345, 1975.
Chumchean, S., Sharma, A., and Seed, A.: An Integrated Approach to Error Correction for Real-Time Radar-Rainfall Estimation, J. Atmos Ocean. Tech., 23, 67–79, 2006.
Ciach, G. J., Krajewski, W. F., and Villarini, G.: Product-error-driven uncertainty model for probabilistic precipitation estima-tion with NEXRAD data, J. Hydrometeorol., 8(6), 1325–1347, 2007.
Cole, S. J. and Moore, R. J.: Hydrological modeling using raingauge- and radar-based estimators of areal rainfall, J. Hy-drol., 358, 159–181, 2008.
Delobbe, L., Dehem, D., Dierickx,P., Roulin, E., Thunus, M., and Tricot, C.: Combined use of radar and gauge observations for hydrological applications in the Walloon Region of Belgium, in: Proceedings of ERAD 2006, Barcelona, Spain, 18–22 September 2006, ERAD Publication Series, 3, 418–421, 2006.
Delobbe, L. and Holleman, I.: Uncertainties in radar echo top heights used for hail detection, Meteor. Appl., 13, 261–374, 2006.
Germann, U., Galli, G., Boscacci, M., and Bolliger, M.: Radar pre-cipitation measurements in a mountainous region, Q. J. Roy. Me-teor. Soc., 132, 1669–1692, 2006.
Gjertsen, U., Salek, M., and Michelson, D. B.: Gauge adjustment of radar-based precipitation estimates – a review, COST 717 Work-ing Document WDD 02 200310 1, 2003.
Goovaerts, P.: Geostatistics for Natural Resources Evaluation, Ox-ford University Press, New York, 1997.
Haberlandt, U.: Geostatistical interpolation of hourly precipitation from rain gauges and radar for a large-scale extreme rainfall event, J. Hydrol., 332, 144–157, 2007.
Heistermann, M., Ehret, U., Bronstert, A., and Zehe, E.: Merg-ing radar and ground observations for operational quantitative rainfall estimation in a mountainous head catchment in Ger-many, International Symposium on Weather Radar and Hydrol-ogy, Grenoble, France, 10–12 March 2008, WRaH2008-O2-008, 2008.
Holleman, I.: Bias adjustment and long-term verification of radar-based precipitation estimates, Meteorol. Appl., 14, 195–203, 2007.
Joss, J. and Waldvogel, A.: Precipitation measurement and hydrol-ogy, in: Radar in meteorology: Battan memorial and 40th an-niversary conference on radar meteorology, edited by: Atlas, D., American Meteorological Society, Boston, 577–606, 1990. Krajewski, W. F.: Cokriging of radar-rainfall and rain gage data, J.
Geophys. Res., 92, 9571–9580, 1987.
Lack, S. A. and Fox, N. I.: An examination of the effect of wind-drift on radar-derived surface rainfall estimations, Atmos. Res., 85, 217–229, 2007.
Leclercq, G., Bastin, G., Moens, L., Delobbe, L., Dierickx, P., and Thunus, M.: Using weather radar measurements for real-time river flow forecasting, in: Proceedings of WraH 2008, Grenoble, France, 10–12 March 2008.
Michelson, D. B., Andersson, T., Koistinen, J., Collier, C. G., Riedl, J., Szturc, J., Gjertsen, U., Nielsen, A., and Overgaard, S.: BALTEX Radar Data Centre Products and their Methodolo-gies, SMHI Reports Meteorology and Climatology RMK Nr. 90, SMHI, SE-601 76, Norrk¨oping, Sweden, 76 pp., 2000.
Pereira Fo., A. J., Crawford, K. C., and Hartzell, C. L.: Improv-ing WSR-88D Hourly Rainfall Estimates, Weather Forecast., 13, 1016–1028, 1998.
Salek, M. and Novak, P.: Experience gained by five years of the uti-lization of the radar-based quantitative precipitation estimation at the Czech Hydrometeorological Institute, in: Proceedings of ERAD 2008, Helsinki, Finland, 30 June–4 July 2008, 2008. Schuurmans, J. M., Bierkens, M. F. P., Pebesma, E. J., and
Uijlen-hoet, R.: Automatic Prediction of High-Resolution Daily Rain-fall Fields for Multiple Extents: The Potential of Operational Radar, J. Hydrometeorol., 8, 1204–1224, 2007.
Seo, D. J. and Breidenbach, J. P.: Real-Time Correction of Spatially Nonuniform Bias in Radar Rainfall Data Using Rain Gauge Mea-surements, J. Hydrometeorol., 3, 93–111, 2002.
Sinclair, S. and Pegram, G.: Combining radar and rain gauge rain-fall estimates using conditional merging, Atmos. Sci. Lett., 6, 19–22, 2005.
Sokol, Z.: Utilization of regression models for rainfall estimates using radar-derived rainfall data and rain gauge data, J. Hydrol., 278, 144–152, 2003.
Sun, X., Mein, R. G., Keenan, T. D., and Elliott, J. F.: Flood es-timation using radar and raingauge data, J. Hydrol., 239, 4–18, 2000.
Tabary, P.: The New French Operational Radar Rainfall Product. Part I: Methodology, Weather Forecast., 22, 393–408, 2007. Todini, E.: A Bayesian technique for conditioning radar
precipita-tion estimates to rain-gauge measurements, Hydrol. Earth Syst. Sci., 5, 187–199, 2001,
http://www.hydrol-earth-syst-sci.net/5/187/2001/.
Uijlenhoet, R. and Berne, A.: Stochastic simulation experiment to assess radar rainfall retrieval uncertainties associated with atten-uation and its correction, Hydrol. Earth Syst. Sci., 12, 587–601, 2008,
http://www.hydrol-earth-syst-sci.net/12/587/2008/.
Velasco-Forero, C. A., Seed, A., Sempere-Torres, D., and Pegram, G.: Optimal estimation of rainfall fields merging radar and rain gauges data in an operational context, in: Proceedings of ERAD 2008, Helsinki, Finland, 30 June–4 July 2008, 2008.
Villarini, G., Mandapaka, P. V., Krajewski, W. F., and Moore, R. J.: Rainfall and sampling uncertainties: A rain gauge perspective, J. Geophys. Res., 113, D11102, doi:10.1029/2007JD009214, 2008. Wilson, J. W. and Brandes, E. A.: Radar measurement of rainfall –
A summary, B. Am. Meteor. Soc., 60, 1048–1058, 1979. Wackernagel, H.: Multivariate Geostatistics, An Introduction with