Estimated features from surface EMG of the lower limb
correlate with the subjective sensation of pain
Iraides M. Oliveira, Alessandro R. P. Machado, Adriano A. Pereira, and Adriano O. Andrade
Universidade Federal de Uberlândia, Uberlândia, MG, Brazil
Abstract
Pain assessment is very important in establishing the eficacy of analgesics and therapies, but because pain is a subjective experience, using methods that represent pain objectively is necessary. A number of biopotentials have been employed in studies of the objective assessment of pain. However, few investigations have considered the peripheral nervous system response to electrical stimulation. The present study evaluated a method for pain quantiication based on the analysis of biopotentials. We assessed electromyographic activity that resulted from evoked movements from the nociceptive lexion relex (NFR). We investigated correlations between stimulus intensity, features extracted from surface electromyography (EMG), and subjective pain reported by subjects using a Visual Analog Scale (VAS). A total of 10 healthy male subjects without any pain disorder, aged 20-27 years, participated in the study. A high correlation (r2 > .87) was found between stimulus intensity and the following features extracted from the EMG: area, root mean square (RMS), and entropy. A high correlation (r2 > .99) was also found between stimulus intensity and subjective pain reported on the VAS. We conclude that estimating features from electromyographic signals that are correlated with subjective pain sensations and the intensity of the electrical stimulus is possible. Entropy, RMS, and the area of the electromyographic signal appear to be relevant parameters in correlations with subjective pain. Keywords: pain, electromyography, nociceptive lexion relex, electrical stimulation.
Received 01 August 2013; received in revised form 22 July 2014; accepted 26 July 2014. Available online 25 November 2014.
Iraides M. Oliveira, Alessandro R. P. Machado, Adriano A. Pereira, and Adriano O. Andrade, Biomedical Engineering Laboratory (BIOLAB), Faculty of Electrical Engineering, Federal University of Uberlândia, Brazil. Correspondence regarding this article should be directed to: Adriano Alves Pereira, Biomedical Engineering Laboratory (BIOLAB), Federal University of Uberlândia, Av. João Naves de Ávila, 2121, Bl E, Room 08, Uberlândia – Minas Gerais, 38408-100, Brazil. E-mail: [email protected]
Introduction
The International Association for the Study of Pain reports that pain is an unpleasant sensory and emotional experience associated with actual or potential tissue
damage (IASP) , and the deinition of pain is clearly made in terms of human experience (Ong & Seymour, 2004).
Knowing the differences between pain and nociception is important. Pain is mediated by the nervous system, and nociception is the neural process that involves the transduction and transmission of a noxious stimulus to the brain through pain pathways as a response to tissue damage. Awareness of the stimulus is not implicated in
or required for these deinitions (Kandel, Schwartz, & Jessell, 2003; Steeds, 2009). With regard to pain, tissue
injury is not necessary—only sensory perception is
suficient (Holdcroft & Jaggar, 2005). This perception is
the result of abstraction of the brain and the development of sensory information. Pain is the result of a complex
interaction between signaling and modulation from higher centers and unique perception by the individual
(Kandel et al., 2003; Steeds, 2009).
Pain measurement occurs only using subjective
scales, such as self-reports, with potential susceptibility
to contamination by several factors that are external to the immediate pain sensation. Some of these factors are anxiety, expectations, and past experiences, which may contribute to errors and make subjective pain ratings
confusing (Chan & Dallaire, 1989). Although
self-reported pain provides useful clinical information and has proven to be an effective approach to pain assessment in most situations, it can fail when applied to certain vulnerable populations. Subjects with major cognitive or communicative impairments, such as intensive care unit patients or elderly individuals with dementia, may not be
able to provide valid self-reports of pain (M. Averbuch, 2000). For these individuals, few methods are available
for determining the presence or absence of pain.
Because of various physiological and psychosocial factors, subjects may report different levels of pain
in response to the same painful stimulus (Kane, Bershadsky, Rockwood, Saleh, & Islam, 2005). Pain
evaluation is important and necessary to establish the
Several studies reported the importance of identifying pain intensity, but most of them used
subjective methods for such measurements (Ahlers et al., 2008; Lee, 2001; Machado, Oliveira, Alves, & Andrade, 2011). Thus, according to Chan and Dallaire (1989), validating the measurement of pain
using psychophysical and physiological instruments simultaneously is desirable, such as the nociceptive
lexion relex (NFR) evoked from electrical stimulation
that has been proposed as a physiological nociceptive
indicator (Chan & Dallaire, 1989; Rhudy & France, 2007; Willer, 1977).
The NFR is typically evaluated by monitoring
the electromyographic activity of the biceps femoris when the sural nerve is electrically stimulated
(France, Rhudy, & McGlone, 2009; Willer, 1977). The stimulation intensity required to evoke the NFR is
used as an objective indicator of nociception threshold and applied in clinical and experimental studies of
nociception and pain modulation (Dincklage, Olbrich, Baars, & Rehberg, 2013; France et al., 2009; Rhudy & France, 2007, 2011).
Chan and Dallaire (1989) demonstrated that
volunteers reported the highest score for pain, based on the VAS, with increasing intensity of the electrical
stimulus to yield the NFR. An increase in pain was
also associated with an increase in the area of the electromyogram.
The main focus of the present study was to determine the set of characteristics extracted from the electromyographic signal that better represent the correlation with pain sensation. One of the features we
evaluated was approximate entropy (S. Pincus, 1995; S. M. Pincus, 1991), which has become an additional tool
in electromyographic studies related pain.
Methods
Subjects
A total of 10 healthy male subjects, aged 20-27 years, participated in the study. None of the subjects
were athletes. The number of subjects was based on the
studies by (Chan & Dallaire, 1989; Willer, 1977). Data
collection was performed at the Biomedical Engineering Laboratory, Federal University of Uberlândia, Brazil. The data were collected after issuance of the opinion of the Ethics Committee in Research of the institution.
The subjects underwent a prior physical evaluation to evaluate physical and functional status. For all of the subjects, the inclusion criteria were the following: no history of surgery or injury or chronic pain in the
right lower limb and age between 18 and 30 years.
The exclusion criteria were the following: central or peripheral neurological disorders and rheumatic affections, use of a pacemaker or any heart problems,
obesity (body mass index > 30 kg/m2), use of medications that cause changes in motor control and peripheral
sensitivity (e.g., benzodiazepines, opioid narcotics, antihistamines, anticonvulsants, and antidepressants),
lower limb amputation, and diabetes mellitus that causes impairment in peripheral sensitivity.
Apparatus
A commercial Myosystem-Br1 ampliier (DataHominis Technology, Brazil) was used for
conditioning, digitalization, and recording of surface
electromyographic activity. Neuropack S1 MEB-9400 equipment (Nihon Kohden, Japan) was used for
electrical stimulation.
Procedure
The subjects were initially informed of the objectives of the research and data collection and subsequently signed a consent form. These participants were subjected to training to familiarize them with the data collection
procedures. Data collection occurred in a calm and
comfortable environment with controlled temperature
(21-23°C). During the test, the subjects were asked to
maintain all of their muscles as relaxed as possible in the prone position.
An active Ag/AgCl electromyography (EMG) parallel bar electrode (gain, 20; length, 25 mm; inter-electrode distance, 10 mm) was ixed with adhesive tape to the skin at the right biceps femoris, 10 cm above the popliteal fossa, according to previous reports (France et al., 2009; Rhudy & France, 2011). The EMG reference electrode was placed on the head of the right ibula over electrically conductive
gel. For electrical stimulation, the cathode was positioned on the external retromalleolar pathway of the right sural
nerve, and the reference electrode (anode) was positioned proximally to the right medial malleolus (Oliveira et al., 2012). These were disposable electrodes (Meditrace Ag/ AgCl; 1.5 cm diameter).
An additional EMG electrode was positioned over the right extensor digitorum brevis muscle on the right lower limb with the aim of aiding the detection of the exact time when the electrical stimulus occurred. This is possible because of the short distance between the extensor digitorum brevis muscle and stimulation site
(Oliveira, et al., 2012). Before positioning the sensors
on the skin it was properly cleaned with alcohol and shaved whenever necessary. This procedure may help
reduce skin impedance and thus increase the
signal-to-noise ratio of the collected electromyographic activity.
The electromyographic signals were ampliied with a gain of 2000, iltered by means of a band-pass ilter with cutoff frequencies set at 20 Hz and 5000 Hz and digitized at 10 kHz by means of a 16-bit
analog-to-digital signal converter.
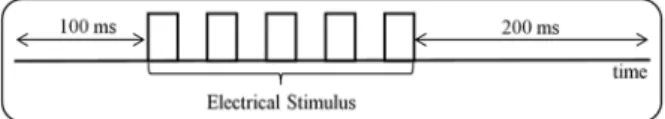
Rectangular pulse trains (pulse width, .2 ms; inter-pulse interval, 10 ms) were used for stimulation. This
current was used because of the fact that it is more uncomfortable for the subject. Electromyographic
data collection began 100 ms before the electrical stimulation and inished 200 ms after it (Figure 1). Data
from these two periods were collected to compare both
The RIII component of the lexion relex that was
evaluated in the present study has a long latency and
normally appears between 85 and 120 ms after the
stimulus. However, individual differences exist at the
beginning and end of the lexion relex (Chan & Dallaire, 1989; Sandrini et al., 2005; Skljarevski & Ramadan, 2002). Thus, we analyzed the full 200 ms period after
the electrical stimulus. To prevent anticipatory reactions
and habituation, the inter-stimulus interval varied randomly between 10 and 20 s (Chan & Dallaire, 1989).
The threshold of perception by the subjects was determined according to the method of limits, which
consisted of the presentation of 10 series of ascending
and descending stimuli during which the subject should
report the perceived pain (Sidowski, 1966). The subject’s
pain tolerance level was determined by gradually increasing the intensity of the stimuli to the maximum
tolerable limit using a VAS (Figure 2). The VAS allows the subject to quantify the perceived pain from 0 (no pain) to 10 (maximum tolerable pain). For purposes of
analysis, the stimuli intensity was normalized between
0% and 100%, with 0% corresponding to the pain threshold and 100% corresponding to the maximum
tolerable pain for each subject. The VAS value reported
by the subjects was multiplied by 10.
The change between these two intensities was
then divided into 10% increments, yielding a total of 11 stimulus intensities. Each stimulus intensity was presented 10 times to the subject in random order. The
data were collected on different days for each subject
and saved in a text ile ofline for analysis using MatLab software (MathWorks).
Approximate entropy (S. Pincus, 1995), the area of the electromyogram, and root mean square (RMS)
were estimated from the electromyographic signal
(evoked response). These features were correlated
with the pain reported on the VAS and intensity of the electrical stimulus. The ApEn and RMS were estimated
100 ms before and 200 ms after electrical stimulation as suggested by Chan and Dallaire (1989).
Approximate entropy is a tool used to quantify the
regularity of a signal, returning a value between 0 and
2. ApEn = 0 represents a deterministic signal as well as
a sinusoid. ApEn = 2 represents a random signal, such as white noise.
The procedure for calculating the ApEn was performed by considering the electromyographic signal
sequence (demg). Choosing values for the parameters m
(standard length) and s (tolerance or similarity criterion
of comparison) was necessary to calculate the ApEn of
the sequence. If an m signal sample window, starting from sample i, is denoted by pm (i), then two windows, pm (i) and pm (j), are similar if the difference between any pair of corresponding samples of the windows are smaller than r [demg (i + k) - demg (j + k)] < r, for 0 ≤ k < m. pm is the set of all windows of length mdemg, the number of windows of length m that resemble the window of the same length, starting from i is Cim (r). Cim (r) is the number of windows in pm that are similar to pm (i). Thus, Cim (r) can be calculated for each pm window, estimating Cm (r) as an average of these values. Cm (r) measures the regularity or frequency of similar windows in a given set of windows, demg, that contained an m length, complying with tolerance r. Then, demg
ApEn can be deined as in Equation 1.
Equation 1
where demg is the electromyographic signal, m is the window length, and r is the tolerance.
Approximate entropy, ApEn, measures the similarity between the windows of lengths m and m+1. The technique was applied to the electromyographic signal with a value of m = 2 and r = .2 SD (demg), where .2 SD
(demg) is the standard deviation of demg, as suggested by
Pincus (S. M. Pincus, 1991). For data processing, we developed speciic software tools using MatLab.
Statistical analysis
The study analyzed the ApEn before and after stimulation, the area of the electromyographic signal, and VAS and RMS before and after stimulation as a function of the intensity of electrical stimuli applied to correlate these variables with the sensation of pain.
We calculated the Pearson correlation coeficient (r)
and coeficient of determination (r²) and performed linear regression analysis. The alpha level of the statistical
tests was 5%. The data followed a normal distribution, based on the Shapiro-Wilk test, with a conidence level of 95%. These data are shown in Table 1. The results are
presented as the average for the subjects.
Results
Table 1 presents the estimated linear models,
describing the correlation among the stimulus intensity
(%) and investigated features (i.e., area, entropy before
and after the stimulus, and VAS and RMS before and
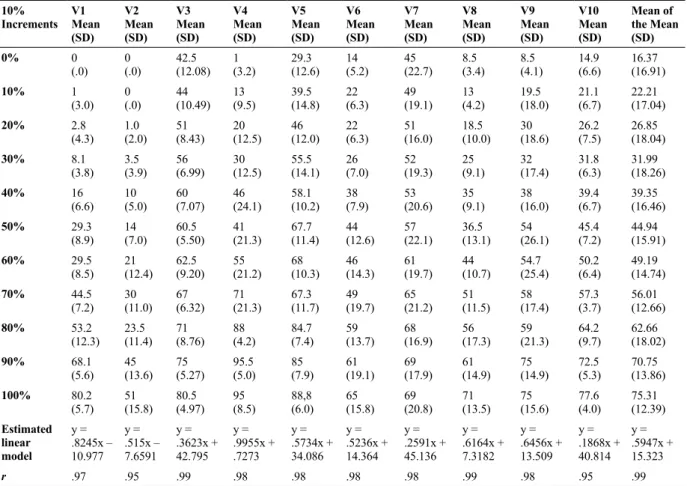
after the stimulus). Table 2 presents the mean values of the VAS and standard deviation in 10 presentations
Figure 1. Schematic representation of the time of the electromyographic signal. Data collection began 100 ms before the electrical stimulation and inished 200 ms after it.
of current intensities for the subjects at each 10% increment. Figures 3-6 show the regression lines and estimated features. In the igures, the mean estimates for
all subjects are given.
A high positive linear correlation was found between
VAS score and stimulus intensity (Figure 3). A weak
correlation was found between entropy estimated before the stimulus and stimulus intensity. Entropy after the stimulus had a high negative correlation with stimulus
intensity (Figure 4). The area had a high correlation with stimulus intensity (Figure 5). A weak correlation
was found between the RMS before the stimulus and stimulus intensity. The RMS after the stimulus had
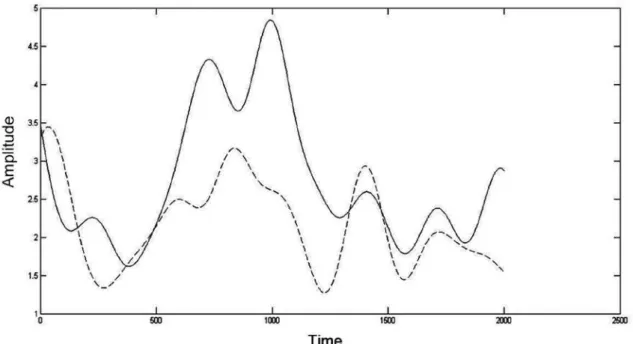
a high correlation with stimulus intensity (Figure 6). Figure 7 presents an example of raw data of the NFR.
Discussion
To ind objective EMG parameters that can be
correlated with pain, several features were analyzed. This protocol showed a strong linear correlation between VAS score and stimulus intensity. Chan and
Dallaire (Chan & Dallaire, 1989) also reported a linear
correlation between VAS score and stimulus intensity. As the stimulus intensity increased, the subjects reported a higher VAS score. Entropy estimated after the stimulus
was strongly correlated with pain sensation (Oliveira et al., 2012). The area of the electromyographic signal was
positively correlated with the intensity of the electrical stimulation that caused the pain. The RMS showed a strong positive linear correlation with the stimulus. This
Table 1. Correlations between the stimulus intensity (%) and investigated features.
Feature Pearson’s correlation coeficient (r)
Estimated linear model Coeficient of determination (r²)
p
VAS .998307 y = .5502x + 18.011 .9966 p<.05
Entropy (before stimulus) -.677000 y = -.0573x + 52.935 .4589 p>.05
Entropy (after stimulus) -.933150 y = -.2433x + 60.415 .8708 p<.05
Area .9740940 y = .3559x + 16.971 .9489 p<.05
RMS (before stimulus) .0900000 y = .0114x + 40.141 .0082 p>.05
RMS (after stimulus) .970000 y = .321x + 20.333 .9460 p<.05
Table 2. Mean VAS score and standard deviation (SD) of 10 presentations of current intensities for each subject at each 10% increment.
10% Increments
V1 Mean (SD)
V2 Mean (SD)
V3 Mean (SD)
V4 Mean (SD)
V5 Mean (SD)
V6 Mean (SD)
V7 Mean (SD)
V8 Mean (SD)
V9 Mean (SD)
V10 Mean (SD)
Mean of the Mean (SD)
0% 0
(.0) 0(.0) 42.5 (12.08) 1(3.2) 29.3(12.6) (5.2)14 45(22.7) 8.5(3.4) 8.5(4.1) 14.9 (6.6) 16.37 (16.91)
10% 1
(3.0) 0(.0) 44 (10.49) 13 (9.5) 39.5(14.8) (6.3)22 49(19.1) 13(4.2) 19.5(18.0) 21.1(6.7) 22.21 (17.04)
20% 2.8
(4.3) 1.0(2.0) 51(8.43) 20(12.5) 46(12.0) (6.3)22 51(16.0) 18.5(10.0) 30(18.6) 26.2(7.5) 26.85 (18.04)
30% 8.1
(3.8) 3.5 (3.9) 56(6.99) 30(12.5) 55.5(14.1) (7.0)26 52(19.3) 25(9.1) 32(17.4) 31.8(6.3) 31.99 (18.26)
40% 16
(6.6) 10(5.0) 60(7.07) 46(24.1) 58.1(10.2) (7.9)38 53(20.6) 35(9.1) 38(16.0) 39.4(6.7) 39.35 (16.46)
50% 29.3
(8.9) 14(7.0) 60.5(5.50) 41(21.3) 67.7(11.4) (12.6)44 57(22.1) 36.5(13.1) 54(26.1) 45.4(7.2) 44.94 (15.91)
60% 29.5
(8.5) 21(12.4) 62.5(9.20) 55(21.2) 68(10.3) (14.3)46 61(19.7) 44(10.7) 54.7(25.4) 50.2(6.4) 49.19 (14.74)
70% 44.5
(7.2) 30(11.0) 67(6.32) 71(21.3) 67.3(11.7) (19.7)49 65(21.2) 51(11.5) 58(17.4) 57.3(3.7) 56.01 (12.66) 80% 53.2
(12.3) 23.5 (11.4) 71(8.76) 88(4.2) 84.7(7.4) (13.7)59 68(16.9) 56(17.3) 59(21.3) 64.2(9.7) 62.66 (18.02)
90% 68.1
(5.6) 45(13.6) 75(5.27) 95.5(5.0) 85(7.9) (19.1)61 69(17.9) 61(14.9) 75(14.9) 72.5(5.3) 70.75 (13.86)
100% 80.2
(5.7) 51(15.8) 80.5(4.97) 95(8.5) 88,8(6.0) (15.8)65 69(20.8) 71(13.5) 75(15.6) 77.6(4.0) 75.31 (12.39) Estimated
linear model
y = .8245x – 10.977
y = .515x – 7.6591
y = .3623x + 42.795
y = .9955x + .7273
y = .5734x + 34.086
y = .5236x + 14.364
y = .2591x + 45.136
y = .6164x + 7.3182
y = .6456x + 13.509
y = .1868x + 40.814
y = .5947x + 15.323
r .97 .95 .99 .98 .98 .98 .98 .99 .98 .95 .99
Figure 6. Linear regression and correlation between RMS (200 ms after the stimulus) and the stimulus. On the x-axis, 0% and 100% correspond to the intensity threshold and pain tolerance, respectively (p < .05).
Figure 3. Linear regression and correlation between VAS and the painful stimulus. On the x-axis, 0% and 100% correspond to the intensity threshold and pain tolerance, respectively (p < .05).
Figure 4. Linear regression and correlation between entropy (after stimulus) and the painful stimulus. On the x-axis, 0% and 100% correspond to the intensity threshold and pain tolerance, respectively (p < .05).
Figure 5. Linear regression and correlation between area and stimulus. On the x-axis, 0% and 100% correspond to the intensity threshold and pain tolerance, respectively (p < .05).
correlation was high during the period 200 ms after
electrical stimulation and was not observed during the
100 ms period before stimulation.
According to S Pincus (1995) and S.M. Pincus (1991), ApEn was introduced for use in time series by
quantifying the predictability, regularity, or complexity of experimental data. This decrease in entropy according to the increase in pain may be attributable to the fact
that some muscle ibers are already pre-recruited to implement the relex response. As the pain increases, the proportion of recruited ibers increases. These
observations suggest that the nociceptive response is a highly organized mechanism that allows painful stimuli to activate appropriate muscles that initiate the most
adequate withdrawal response (Skljarevski & Ramadan, 2002). Therefore, the ApEn has a lower value in regular
time series and a greater value in irregular and complex temporal series.
Skljarevski and Ramadan (2002) reported that
Sherrington, in the early twentieth century, observed that pain caused by electrical stimulation in a limb in animal
experiments caused a withdrawal relex or the hip, knee, and ankle of the same limb, a phenomenon called the NFR. Because the relex does not appear without the activation of nociceptive ibers, the method has become a useful tool
for clinical pain research.Furthermore, digital technology
advances have allowed greater reproducibility (Skljarevski & Ramadan, 2002).
In addition to the NFR, different studies utilized
other methods, such as the M wave, algometry, pain scales and questionnaires, hypertonic saline solution, electroencephalography, thermosensitivity, functional
magnetic resonance imaging, and lasers (Bottega & Fontana, 2010; Buchgreitz, Egsgaard, Jensen, Nielsen, & Bendtsen, 2008; Ervilha, Farina, Arendt-Nielsen, & Graven-Arendt-Nielsen, 2005; Graven-Arendt-Nielsen, Arendt-Nielsen, & Mense, 2002; Hogeweg, Langereis, Bernards, Faber, & Helders, 1992; Iannetti, Hughes, Lee, & Mouraux, 2008; Iannilli, Gratta, Gerber, Romani, & Hummel, 2009; Kane et al., 2005; Machado et al., 2011; Ong & Seymour, 2004).
The NFR can also be studied in subjects with headaches, ibromyalgia, back pain, and knee pain. In
such disorders, central hyperexcitability occurs because of central facilitation sustained by continuous peripheral nociceptive afferents from an unrecognized source,
which leads to signal ampliication by hyperexcited nociceptive spinal neurons (Lim, Sterling, Stone, & Vicenzino, 2011).
The present study evaluated male subjects because many women experience hormonal changes during their
menstrual cycle (Shefield, Biles, Orom, Maixner, & Sheps, 2000; Sherman & LeReche, 2006), which may
interfere with pain assessment.
Some reports have indicated that the very slow loss
of muscle mass occurs at 25-50 years of age (Matsudo, Matsudo, & Neto, 2000). Because this sarcopenia is rather insigniicant at 25 to 28 years of age (i.e., accounting for < 1% loss (Powers & Howley, 2005),
we chose 20- to 27-year-old subjects for this study, for whom no signiicant sarcopenia would be expected.
An important contribution of the present study was
the veriication that entropy after stimulation, RMS, and area of the lexion relex are relevant parameters for quantifying pain. The identiication of these features
may be used in more complex algorithms and tools
for automatic pain quantiication procedures. The
methodology used for data collection in the present
EMG-based protocol was based on investigations of correlations performed by several research groups (Chan & Dallaire, 1989; France, et al., 2009; Rhudy & France, 2007, 2011; Willer 1977) that used similar techniques
in studies of pain assessment. Electromyography does not measure pain itself but provides an inference to pain with parameters that can be analyzed, including the area of the electromyographic signal RMS, and entropy. The discovery of the relationship between
the above-cited features and pain is very important for
the development of new protocols that can objectively contribute to solving problems associated with pain and
its quantiication. A relevant factor is that this research
utilized an easily reproducible protocol that can be used for the development of future studies.
Acknowledgements
This project was supported by CAPES, CNPq,
and FAPEMIG. The authors thank Guilherme Lopes
Cavalheiro, Nayara Nascimento Moraes Damasceno,
Talita Conte Granado, and Vitória Gonçalves da Silva Chagas for the development of the MatLab software used in this study.
References
Ahlers, S., van Gulik, L., van der Veen, A., van Dongen, H., Bruins, P., Belitser, S., et al. (2008). Comparison of different pain scoring systems in critically ill patients in a general ICU. Critical Care, 12(1), R15.
Ahmad, S. A., & Chapell, P. H. (2008). Moving approximate entropy applied to surface electromyographic signals. Biomedical Signal Processing and Control, 3, 88-93.
Bottega, F. H., & Fontana, R. T. (2010). A dor como quinto sinal vital: utilização da escala de avaliação por enfermeiros de um hospital geral. Texto Contexto Enfermagem, 19(2), 283-290.
Buchgreitz, L., Egsgaard, L. L., Jensen, R., Arendt-Nielsen, L., & Bendtsen, L. (2008). Abnormal pain processing in chronic tension-type headache: a high-density EEG brain mapping study. Brain, 131, 3232-3238.
Chan, C. W. Y., & Dallaire, M. (1989). Subjective pain sensation is linearly correlated with the lexion relex in man. Brain Research, 479, 145 - 150.
Dincklage, F. v., Olbrich, H., Baars, J. H., & Rehberg, B. (2013). Habituation of the nociceptive lexion relex is dependent on inter-stimulus interval and stimulus intensity. Journal of Clinical Neuroscience, 20, 848-850.
Ervilha, U. F., Farina, D., Arendt-Nielsen, L., & Graven-Nielsen, T. (2005). Experimental muscle pain changes motor control strategies in dynamic contractions. Experimental Brain Research, 164, 215-224.
France, C. R., Rhudy, J. L., & McGlone, S. (2009). Using normalized EMG to deine the nociceptive lexion relex (NFR) threshold: Further evaluation of standardized NFR scoring criteria. Pain, 145, 211-218.
Hogeweg, J. A., Langereis, M. J., Bernards, A. T. M., Faber, J. A. J., & Helders, P. J. M. (1992). Algometry. Scandinavian Journal of Rehabilitation Medicine(24), 99-103.
Holdcroft, A., & Jaggar, S. (2005). Core Topics in Pain: Cambridge University Press.
Iannetti, G. D., Hughes, N. P., Lee, M. C., & Mouraux, A. (2008). Determinants of laser-evoked EEG responses: pain perception or stimulus saliency? Journal of Neurophysiology, 100,
815-828.
Iannilli, E., Gratta, C. D., Gerber, J. C., Romani, G. L., & Hummel, T. (2009). Trigeminal activation using chemical, electrical and mechanical stimuli. Pain, 139, 376-388.
IASP. International Association for the Study of Pain - IASP. Retrieved March, 17, 1994, from http://www.iasp-pain.org/Education/ Content.aspx?ItemNumber=1698
Kandel, E. R., Schwartz, J. H., & Jessell, T. M. (2003). Princípios da neurociência (4 ed.). Barueri, São Paulo: Manole.
Kane, R. L., Bershadsky, B., Rockwood, T., Saleh, K., & Islam, N. (2005). Visual analog scale pain reporting was standardized
Journal of Clinical Epidemiology, 58, 618-623.
Lee, J. S. (2001). Pain measurement: Understanding existing tools and their application in the emergency department. Emergency Medicine, 13(3), 279-287.
Lim, E. C. W., Sterling, M., Stone, A., & Vicenzino, B. (2011). Central hyperexcitability as measured with noceceptive lexor relex threshold in chronic musculoskeletal pain: A systematic review.
Pain, 152, 1811-1820.
M Averbuch, M. K. (2000). Baseline pain and response to analgesic medications in the post surgery dental pain model. Journal of Clinical Pharmacology, 40, 5.
Machado, A. R. P., Oliveira, I. M., Alves, A., & Andrade, A. O. (2011). Análise da relação entre parâmetros da onda M e a dor. Revista Dor, 12(4), 301-307.
Matsudo, S. M., Matsudo, V. K. R., & Neto, T. L. B. (2000). Impacto do envelhecimento nas variáveis antropométricas, neuromotoras e metabólicas da aptidão física. Revista Brasileira de Ciência e Movimento, 8(4), 21-32.
Noble, B., Clark, D., Meldrum, M., Have, H. t., Seymour, J., Winslow, M., et al. (2005). The measurement of pain, 1945-2000. Journal of Pain and Symptom Management, 29(1), 14-21.
Oliveira, I. M., Machado, A. R. P., Chagas, V. G. S., Granado, T. C., Pereira, A. A., & Andrade, A. O. (2012). On the use of evoked
potentials for quantiication of pain. Paper presented at the 34th Annual International Conference of the IEEE EMBS, San Diego, CA, USA.
Ong, K. S., & Seymour, R. A. (2004). Pain measurement in humans.
Journal of the Royal Colleges of Surgeons of Edinburgh and Ireland, 2(1), 15-27.
Pincus, S. (1995). Approximate entropy (ApEn) as a complexity measure. Chaos, 5(1), 110-117.
Pincus, S. M. (1991). Approximate entropy as a measure of system complexity. Proceedings of the National Academy of Sciences of the USA, 88, 2297-2301.
Powers, S. K., & Howley, E. T. (2005). Fisiologia do exercício: Teoria e aplicação ao condicionamento e ao desempenho (5 ed.). São
Paulo: Manole.
Rhudy, J. L., & France, C. R. (2007). Deining the nociceptive lexion relex (NFR) threshold in human participants: A comparison of different scoring criteria. Pain, 128, 244-253.
Rhudy, J. L., & France, C. R. (2011). Reliability and validity of a brief method to assess nociceptive lexion relex (NFR) Threshold. The Journal of Pain, 12(7), 782-791.
Sandrini, G., Serrao, M., Rossi, P., Romaniello, A., Cruccu, G., & Willer, J. C. (2005). The lower limb lexion relex in humans.
Progress in Neurobiology, 77(6), 353-395.
Shefield, D., Biles, P. L., Orom, H., Maixner, W., & Sheps, D. (2000). Race and sex differences in cutaneous pain perception.
Psychosomatic Medicine, 62, 517-523.
Sherman, J. J., & LeReche, L. (2006). Does experimental pain response vary across the menstrual cycle? A methodological review. American Journal of Physiology - Regulatory, Integrative and Comparative Physiology, 291, R245—R256.
Sidowski, J. B. (1966). Experimental methods and instrumentation in psychology: McGraw-Hill.
Skljarevski, V., & Ramadan, N. M. (2002). The nociceptive lexion relex in humans — review article. Pain, 96, 3-8.
Steeds, C. E. (2009). The anatomy and physiology of pain. Surgery, 27(12), 507-511.