ON THE SPECIAL CURRENT ANO WATER LEVEL V ARIATIONS IN THE CHANNEL
OF SÃO SEBASTIÃO
'f.(Received in 21/ 11/ 1966)
THOR KVINGE ·::··x·
SYNOPSIS
In this paper were discussed current measurements recorded at 5 meter depth
in the São Sebastião ChanneI and its correIation with tidaI currents and prevailing
weather conditions.
It
has been shown that the recorded current is dominated by Iong periodic
variation with periods of about four days and is characterized by a net transport
towards
NE.
Computations of the currents of tidaI origin have shown that they
are very smalI and of minor importance to the current conditions in the ChanneI,
however there are evidences of the connection between the non tidaI currents, the
irregular sea leveI variation and the prevailing weather conditions.
INTRODUCTION
The island of São Sebastiãwo, located at 23°50'S,
45°20'W, or about 50 miles north-east of Santos, is
a huge and rocky island, where the highest peaks
reach altitudes of more than 1300 m. The
neighbour-ing continent is also very high and the channel
between the continent and the island therefore forms
a well protected natural harbour: São Sebastião.
However, althought the channel and the port are
well protected from the Atlantic Ocean, quite severe
navigational difficulties may arise due to the strong
currents frequently present in lhe channel.
In 1961, therefore, investigations were made in
order to obtain more knowledge of the current
condi-tions in the channel.
Later on observations were
supplemented by weather reports and tidal data.
Before discussing the observations and analysis
it is of interest to consider the topography and
surroundings of the channel.
SÃO SEBASTIÃO
The island of São Sebastião is of tectonic origin
and the channel itself is considered to be due to a
• This w ork w a s a ccomplished w hile under contrac t a s Visiting Professor a t the Instituto Oceanográfico, Uni-versidade d e São Paulo, on a For d Founda tion Gra nt. .. Present address - Geo1'ysisk Instltutt, Universitetet
Ber gen, Norway.
landslide (FRANÇA, 1954) .
The shelf is even and
very shaIlow, extending 60-70 miles oH the coast,
nowhere deeper than 100 m. At the southern
en-trance the channel of São Sebastião runs in
NE-direction, reaching its narrowest part at Pt. de Araçá.
Further to the north-east the channel bends more to
the north and becomes graduaIly wider until running
into the open shallow bay of Caraguatatuba.
The bottom topography is unique: a ' relatively
deep and narrow trench runs close to the island, the
full length of the channel. At the southern entrance
the bottom is even, and the trench only just
percepti-ble.
North · of Pt. de Araçá the channel becomes
narrower and the underwater trench deeper, formin g
the most important part of the channel.
The different profiles and their loca tion s are
illustrated on Figures 1 and 2.
The configuration of the shaIlow zone at the
northern entrance is obviously closely rela ted to lhe
current conditions and to a counter-clockwise eddy
in the bay of Caraguatatuba.
T he material
the middle of the channel between Pt. de Araçá and
Ilha das Cabras (Section 2, Fig. L).
The current was observed during a period of
16 days from October 1st to October 16th 1961.
This period was, however, interrupted for 5 hours
on October 7th, and from October 12th to 15th, due
to instrumental failure.
SÃO SEBASTIÃO
CANAL
COAST BR ASIL
Sea leveI variations were observed during
Sep-tember and October 1961 by the maregraph at the
port of São Sebastião.
Another series of sea leveI observations was made
during 1964 and 1965, the data being put at our
disposal by Laboratório de Hidráulica of the Uni
ver-sity of São Paulo.
/
/
,
I
/
( \ /
-dM'~ ______ ~ --- ____________
+ _________
~~~_______
~_______________
-+ ____
~~~~~ ~~___
~uu~ _ ~1Flg. 1 - The channel of São SebastIão.
SECTION
Plil do Toque - Tog ue Pt a da 5 e I a
5 SECTION 2
"
SCALES: 3 Ptil do Araç~ Ilha dils Cabra s
2
KM 4---- •• - - - - ,- - -,.
----.-- --+
OO 1 2 3 " 5
SECTION 3 SECTION 4
;>\ a d a C r u z P\ a do paq u eã Pia das Canas
39000
m
2Fig. 2 - The channel of São Sebastião, bottom proflles.
The meteorological data are based upon daily
weather maps issued by D.H.N. (Diretoria de
Hidro-grafia e Navegação). Daily air pressure data for
1964 and 1965 from the Instituto Oceanográfico
station in Ubatuba have also been included.
The
latter data are based on hourly values as registered
by a barograph.
T
he cllrrent
It can be shown that the current-component in
the transverse direction of lhe channel is negligible.
Only the components par alIei to the channel
there-sAo SEBASTiAo
fore will be dealt with, those towards 50° true being
referred to as positive. Hourly current speed values
are determined from the smoothed curve (Fig. 3).
An even more smoothed curve is given in Figure 4,
representing the residual current-component after the
principal tidal and short periodic oscilIations are
eliminated by the process of 25 hours running mean.
Long periodic variations
mlhe cllrrent
It
can clearly be seen from the curves mentioned
(Fig. 3 and 4) that the current is dominated by
periods of about 4 days.
12 13 14 DAVS
TABLE
1 -
Long-period variations in current
Periods
Duration
Max. amplo
Min.amplo
Range
N .o
Date Hours
Date Hour
hours
cm/ sec
cm/sec
cm/sec
1.
From
2 / 10 11to
6 / 10 10 94 42 -41 832 .
From
6 / 10 09to
10/ 10 00 87 52 -32 843. 20 -31 51
4 . 76
cm/sek
70 60 50 40 30 20 10
O
-10 2 6 B 12 13 14 15 16 DAYS
-20 -30 -40 -50
Fig.
4 -Current components,
25hours running mean.
The figures given in Table I are taken from
Figure 4, based on 25 hours running mean. Applied
on a 94 hours period, this process will reduce the
amplitude to about 91
1%.
Periods no. 3 and 4 are indicated on Figure 4,
but their lengths can hardly be determined beca use
of interruption in the observations.
A possible
explanation of the oscillations and the acting forces
will be given in the section dealing with long-period
terms.
The curve on Figure 4 also indicates that the NE
component is greater than the SW one, and by
integrating the curve (Fig. 4) it can further be
shown that there is a net mass-transport towards NE.
However, this may be connected with a long time
variation which remains unrevealed beca use the
observation period is too short.
The tidal current
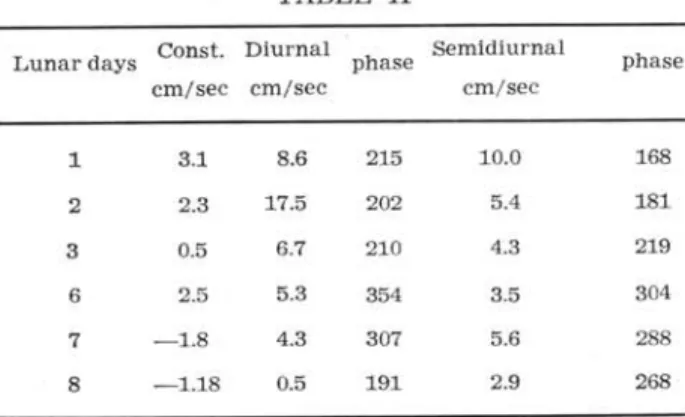
Harmonic analyses with respect to diurnal and
semidiurnaI components have been performed, by
appIying the method given by Doodson. The results
are given in Table lI.
The harmonic constants given in Table II are
more or less of the same order of magnitude, and
remarkably small compared with the amplitudes of
the long-period current. These conditions have been
explained by
I.
Emilsson (unpublished manuscript
1962), who suggests that the observations are taken
in a position very elose to where the tidal wave from
NE meets the wave from SW. The consequence is
no tidal transport and no tidal current at this
location. However, stronger tidal currents may occur
at other locations in the channeI.
Bolm Inst. oceanogr.
SPaulo,
l-6(1) :23-38, 1967TABLE
IILunar days Consto Diurnal phase
Semldiurnal
phase
cm/sec cm/sec
cm/ sec
1 3.1 8.6 215 10.0 168
2 2.3 17.5 202 5.4 181
3 0.5 6.7 210 4.3 219
6 2.5 5.3 354 3.5 304
7 - 1.8 4.3 307 5.6 288
8 -1.18 0.5 191 2.9 268
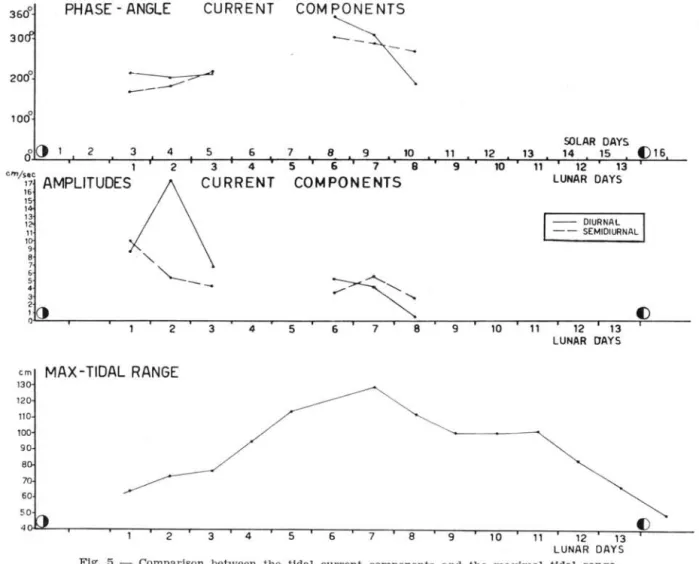
The curve on Figure 5 shows that the maximal
tidal range coincides very elosely with the
moon-phase. The diurnal and semidiurnal
current-compo-nents, however, decrease to a minimum when the
moon is in the first quarter. An adequate
explana-tion of these condiexplana-tions can hardly be given from
the available data.
If
one accepts that the tidal
current-components are small because the observations
were taken near the Iocation where the two tidaI
waves meet, onde may also expect that this location
may change with the moon-phase, and consequently
that a chance in the current does not directly coincide
with the actual tidal force. The author would,
how-ever, emphasize the fact that the tidal
current-components are very smaIl, and obviously only minor
importance to the current conditions of this location.
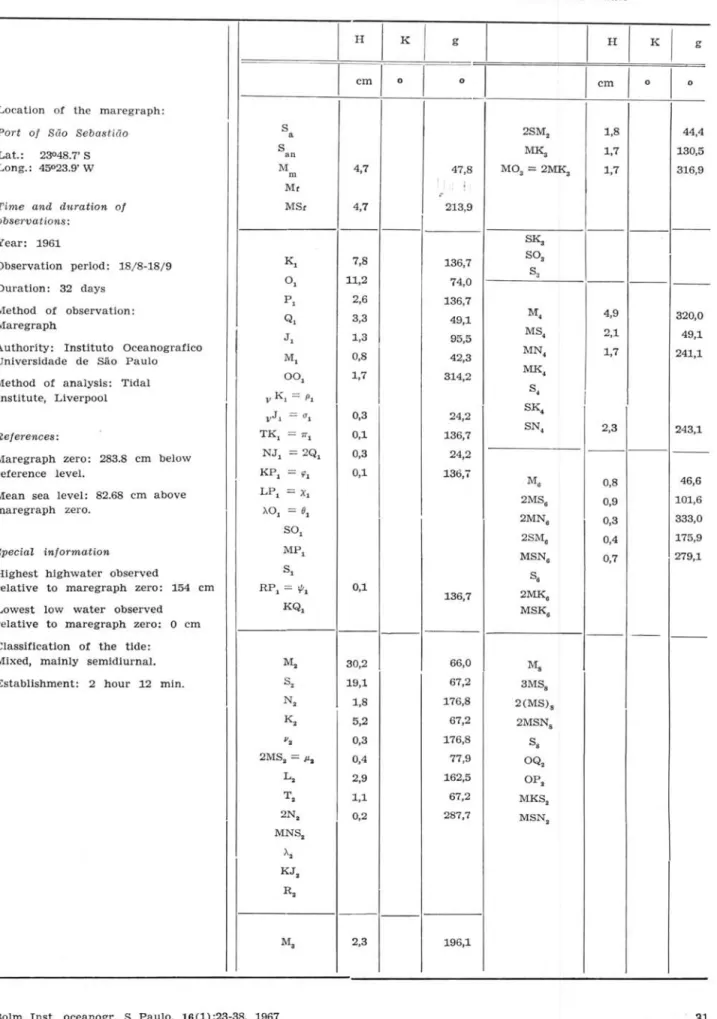
T he tida/, conditions at São Sebastião
The tidal conditions at the port of São Sebastião
have been analysed by Instituto Oceanográfico da
COM~
30
PHASE - ANGLE
CURRENT
SOLAR DAY!)
f)16
Ü()
1
2 3 45
6 7 8 910
11
12
13
14
15
1
23
4
5 6 7 8 910
1112
13
0_'\\0
AMPLlTUOESI\URRENT
COMPONENTS
LUNAR DAYS16 15 1 13
- - DIURNAL 1
11 - - SEMIDIURNAL
1
9
8 .
"-~
"'--~
5 ~
4 ~
3
~ ()
f)
O
2
3
45
6 7 8 910
11
12
13
LUNAR OAYS
em
MAX -TlDAL RANGE
f)
2 3 4 5 6 7 8 9
10
11 12 13LUNAR DAYS
Fig. 5 - Comparison between the tldal current components and the maximal tldal range.
Universidade de São Paulo and the harmonic cons·
tants are given in Table 111. The analysis is based
on tidal observations, taken during a period of one
month, from 18/ 8-18/9/1961, applying a method
provided by the Tidal Institute in Liverpool.
Thp· classification formula:
K
1+
0
1F=~-
--M
2+
S2
gives for São Sebastião: F
=
0.385: hence a mixed,
mainly semidiurnal tide
(DEFANT,1961). The
pro-cess of 25 hours running means has aIs o Leen applied
to the tidal observations during the period 1st to
16th of October 1961, and
it
can be shown that there
is a variation in the sea leveI with approximateIy
the same period as found for the Iong period
varia-tion in the current (Fig. 10).
The maximal range of the variation for the
period concerned amounts to about 40 em, and the
component should consequently be regarded as one
of the most important contributions determining the
sea leveI at this location.
To establish more knowledge of the existence
and the length of this period, daily mean sea leveI
values have been determined for a period of one
year, September 1964 to September 1965, and
perceptible and irregular variations in the daily mean
sea leveI can be shown.
The number of equal periods has then been
plotted as a function of Iengths, and the
period-gram (Fig. 6) shows a particularly high frequency
on periods of 4-5 days' length.
'"
"O
o
.;:
~20
....
o
o.
Z
10
o 2 3 .. 5 6 7 8 9 10 DAYS
Period
length
There is a reason to believe that the frequencies
of the different periods are unevenly distributed
throughout the year, but an investigation of these
conditions will require a longer observation period.
The long-period, non tidal current and the
irregular sea leveI variations found in the channel
of São Sebastião are probably due to,
OI'connected
with the meteorological conditions.
It
is therefore
of interest to consider the prevailing weather system
for the Brazilian coast.
The prevailing weather condition
The weather system of Brazil is very persistent,
and a typical sequence may briefly be characterized
as follows:
The South-Atlantic anticyclone will normally
dominate the ocean and the coastal regions of the
continent. The winds are generally weak and
vari-able_ At intervals cold airmasses accumulate along
the south-western coast of Patagonia, followed by
minor anticyclonic movements. A frontlike
configur-ation traveIs northwards over the Argentine part
of the continent, where the front becomes wider and
more intense. The passage of the front is
characte-rized by apressure minimum, and a sudden drop
in the air temperature. The winds generally blow
from SE to SW in heavy gusts, even when the air
pressure is minimal.
Provided it is sufficiently
strong, the front system may go as far as the
north-eastern coast of Brazil, where it becomes more and
more diffuse, and finally disappears altogether
(Brasil. Ministério da Marinha).
Since the passage of a front is characterized by
apressure minimum, the period of a weather-cycles
can be easily detected from a barogram, by
measur-ing the time length between two consecutive pressure
minima.
Daily mean air pressures for the period
Septem-bel' 1964 to September 1965 for the station in
Uba-tuba have been determined by applying the process
of 24 hours running mean, and the number of equal
periods have been plotted as a function of period
hmgth (Fig_ 7). The periodgram shows a
configura-'"
-:17
;::. 15
õ
13o~
11
9
1
5
3
o
2 :5 4 5 6 7 8 9 10 11Period daYI
Fig. 7 - Perlodgram, 24 hours mean alr pressure.
Bolm Inst. ocea nogr. S Paulo, 16(1) :23-38, 1967
tion similar to that found for the daily mean sea
leveI oscillation, with a most frequent period of 4-5
days.
Periods of 7-8 days also apparently occur
quite frequently.
This phenomenon may, however,
partly be due to the method, as a period of 7-8 days
may be composed of two 3-4 days' periods.
T he long term variations
It is shown that the current components, the
mean sea leveI, and the weather system cycles are
dominated by 4-5 days' periods. There is therefore
reason to expect a close connection between these
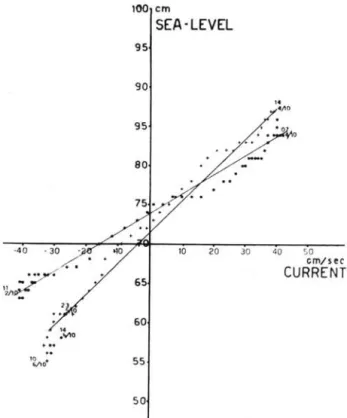
parameters. HourIy values of mean sea leveI have
therefore been plotted as a function of the
current-components (Fig. 8 and 9). The first period (Fig. 8)
-40 · 30
7
'1, _
,
.
• 1,1\...
I ~O ·
100 em
SEA-LEVEL
95
90
95
80
20
65
60
55
50
30
,.
'/10
40 50
em/ser
CURRENT
Fig. 8 - Relation between mea n sea leveI and current components durlng the period October 2nd to October 6th.
shows a remarkably close, nearIy linear correIation,
that by a careful examination will reveal a slightly
different configuration for ascending and descending
tide.
The regression equation will therefore be
different for ascending and descending sea leveI. In
the diagram the sea leveI has been compared with
simultaneous current components. There is, however,
reason to expect a time lag, depending on the phase
of the period.
These conditions may very well
explain the difference in regression curves for
ascend-ing and descendascend-ing tide. An investigation, applyascend-ing
different time lags has been considered of little value,
owing to the incomplete and short series of current
observations.
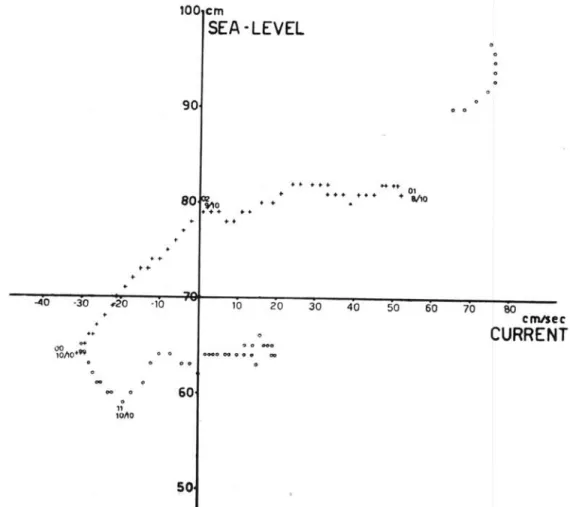
The second period only comprises the decreasing
part, but the curve (Fig. 9) shows a good correlation
100 em
SEA -LEVEL
-'10 ,30 ~20
o
11 10/10
...
'lO
90
80~o + • .. + + ...
• •
10 20
60
so
.. .. .. ++
+.
fo+. t + . +O~,O
30 40 50 60 70 80
cmlSec
CURRENT
Fig, 9 - Relatlon between mean sea leveI and current components during the period October 8th to October 11th,
between mean sea leveI and current components,
although not linear. During the second period the
mean sea level keeps its value till the moment of no
current, then it descends nearly proportionally with
the current.
During the third period there are only small
current components, and relatively low or medi um
mean sea leveI throughout the whole period.
The
current shows little or no significant correlation with
the mean sea leveI.
The fourth period, of which only fragments can
be presented, shows very strong current and extremely
high mean sea leveI. We may therefore condu de :
there is a dose correlation between mean sea leveI
100
em
90
60
70
60
()
and current towards NE along the channel,
particular-ly in extreme situations. There is, however, reason
to believe that the long-period current and the mean
sea leveI oscillations are due to events or forces
mainly acting off this particular locality. The acting
forces will probably have a different effect on the
two parameters, so that a differing time response is
to be expected. Friction will have a nonlinear effect
on the current, and the wind is also generally
reckoned to have a nonlinear effect on surface
currents.
One should therefore expect no direct and
constant proportionality between current and mean
sea leveI, although there seems to be a relatively
strong connection.
•
50f ---~ -- --~ ----1---r--- ~ ---- ~ ----1---r--- ~ ---- ~ ----1- ----+ I ----4- '---1---r--- ~ --
--9 10 11 12 13 14 15 16
OCTOBER 1961
FINAL REMARKS
The weather system of Brazil is considered very
persistent, and it has been shown that the most
frequent weather cycles has the same length as that
of the most frequent mean sea leveI. The weather
is therefore considered to be the cause, or one of
the causes, of the unique sea leveI and current
condi-tions in the channel of São Sebastião.
However, the author would emphasize the fact
that the topographic conditions and the frictional
forces will most certainly influence the final picture.
The cross-section of the channel decreases from
south to north until the section Pt. da Cruz -
Pt.
do Paqueá. An inward waterflow passing the section
at Pt. Toque-Toque will therefore either cause a
more than 3 times as strong current, or an alternative
piling up at Pt. da Cruz. Part of the mean sea leveI
oscillation may be due to piling up caused by the
current, but the current alone is not considered
responsible for the total elevation.
The air pressure is not an adequate weather
parameter, but since the weather conditions are very
persistent
it
may still give a good indication. A more
adequate parameter might probably be the air
pressure gradient, because
it
is more representative
of the great scale wind conditions.
The channel of São Sebastião is subjected to
strong currents of which the tidal components play
a nearly negligible parto
The strongest non tidal
component is estimated to be nearly 80 cm/sec, .
Bolm Inst. ocea nogr. S Paulo, 16 (1) :23-38, 1967
running along the channeI in
NE
direction. For the
interval dealt with, the dominating non tidal current
has periods of about 4, days.
The most important components determining the
sea leveI are thus irregular, the most frequent period
is found to be about 4-5 days. There is a relativeIy
strong correIation between currents towards
NE
and
the mean sea leveI, particularly under extreme
con-ditions.
It is indicated that the weather system
propaga-tion may be entirely or partly responsible for the
conditions mentioned above. The 4-5 days periods
are probably characteristic for the Brazilian shelf
and are likely to be responsible for the most
conspicuous and characteristic current and sea level
conditions along the coast of Brazil.
The author would therefore strongly recommend
further investigations on these conditions.
REFERENCES
BRASIL. MINISTÉRIO DA MARINHA. DIRETORIA DE HIDROGRAFIA E NAVEGAÇÃO.
s . d.
Evoluções típicas do tempo no Brasil.
DEFANT,
A.
1961.
FRANÇA,
A.
1954.
D.H.N. - DG
7-4.
Physical oceanography.
gamon Press, 2 vol.
London,
Per-Ilha de São Sebastião. Bolm Fac. Filos.
Ciênc. Univ. S Paulo, Geogr. n.o 10.
TABLE lI!
Port: São Sebastião
State: São Paulo
I
HI
KI
gI
I
HI
KI
gI
emI
oI
oI
I
emI
oI
oLocation of the maregraph:
Port of São Sebastião S a 2SM. 1,8 44,4
S MK. 1,7 130,5
Lat.: 23048.7' S an
Long.: 45°23.9' W M m 4,7 47,8 MO,
==
2MK. 1,7 316,9, ,
~ I , M,
~
Tirne and duration of MS, 4,7 213,9
observa tions:
- - -
---- ---- ----
- - --Year: 1961 SK.
K, 7,8 136,7 SO,
Observation period: 18/8-18/ 9 S,
0,
11,2 74,0- - -
---Duration: 32 days
P, 2,6 136,7
Method of observation:
Q, 3,3 49,1 M, 4,9 320,0
Maregraph MS,
2,1 49,1
J, 1,3 95,5
Authority: Instituto Oceanografico
0,8 MN, 1,7 241,1
Universidade de São Paulo M, 42,3
0O, 1,7 314,2 MK,
Method of analysis: Tidal
S.
Institute, Liverpool v RI = P1
SK,
i
vJ ,
=
aI 0,3 24,2TK, 0,1 136,7 SN, 2,3 243,1
References: = 1r1
NJ,
==
2Q, 0,3 24,2-Maregraph zero: 283.8 em below
reference levei. KP,
==
~ , 0,1 136,7M. 0,8 46,6
Mean sea levei: 82.68 em above LP,
=
Xl2MS. 0,9 101,6
maregraph zero.
,,0,
==
0,2MN. 0,3 333,0
SO,
2SM. 0,4 175,9
Special inforrnation MP, MSN.
0,7 279,1
Highest highwater observed S, S.
relatlve to maregraph zero: 154 em RP,
==
0/, 0,12MK. 136,7
Lowest low water observed KQ, MSK.
relatlve to maregraph zero: O em
- - -
- - -
---Classifica tion of the tlde :
Mixed, malnly semidiurnai. M. 30,2 66,0 M.
Establishment: 2 hour 12 mino S. 19,1 67,2 3MS.
N. 1,8 176,8 2(MS).
K. 5,2 67,2 2MSN.
v.
0,3 176,8 S.2MS.
==
fi, 0,4 77,9 OQ.L. 2,9 162,5 OP.
T. 1,1 67,2 MKS.
2N. 0,2 287,7 MSN.
MNS.
".
KJ. R.CURRENT OBSERV ATION
Instrument: NEYRPIC B.B.T. 187 837
Location: Canal de São Sebastião
Depth: 5 meters
Period: 1st to 16th October 1961
OCTOBER 1
Local Direc- Local Direc- Local
Direc-hour tion Speed hour tion Speed hour tion Speed
1500 20 5 1814 350 5 2114 165 8
. 15 295 5 29 35 5 29 160 14
30 220 7 44 30 5 44 165 10
45 220 5 59 50 5 59 170 20
1600 230 4 1914 165 5 2214 175 23
15 310 4 29 170 7 29 175 20
30 350 5 44 175 11 44 170 20
45 350 5 59 175 11 59 175 20
1700 O 5 2014 180 15 2314 170 23
14 10 5 29 175 11 28 170 23
29 10 5 44 170 11 43 175 26
44 30 5 59 165 11 58 185 26
59 15 5
OCTOBER 2
Local Direc- Lo cal Direc- Local
Direc-hour tion Speed hour tion Speed hour tion Speed
0013 175 32 0812 180 61 1611 190 27
28 180 39 27 175 62 26 190 27
43 180 41 42 175 48 41 185 29
58 180 42 57 175 58 56 190 33
0113 175 42 0912 175 58 1711 185 33
28 180 48 27 175 51 26 185 27
43 185 54 42 175 55 41 185 23
58 185 55 57 175 58 56 190 23
0213 180 45 1012 175 58 1810 190 26
28 180 42 27 175 58 25 185 23
43 190 42 42 175 61 40 185 17
58 185 42 57 180 58 55 185 20
0313 180 48 1112 185 58 1910 190 20
28 175 48 27 185 51 25 190 20
43 180 55 42 185 10 40 195 20
58 180 48 56 185 53 55 200 20
0413 180 51 1211 185 54 2010 195 26
28 180 54 26 185 55 25 190 29
43 180 48 41 180 52 40 185 29
58 180 48 56 180 48 55 185 26
0513 185 54 1311 180 51 2110 185 35
28 180 60 26 180 45 25 185 32
42 180 51 41 180 42 40 180 32
57 180 51 56 185 42 55 180 29
0612 180 48 1411 185 42 2210 180 29
27 180 42 26 185 45 25 175 23
42 180 42 41 185 42 40 175 27
57 180 45 56 185 45 55 175 23
0712 180 51 1511 185 42 2310 180 20
27 180 54 26 185 36 25 180 26
42 180 63 41 190 29 40 180 26
0757 180 61 1556 190 27 55 190 26
OCTOBER 3 Local hour 0010 24 39 54 0109 24 39 54 0209 24 39 54 0309 24 39 54 0409 24 39 54 0509 24 39 54 0609 24 38 53 0708 23 38 53
OCTOBER 4
OCTOBER 5 Local hour 0002 17 32 47 0102 17 32 47 0202 16 31 46 0301 16 31 46 0401 16 31 46 0501 16 31 46 0601 16 31 46 0701 16 31 46
OCTOBER 6
Local hour 0013 28 43 58 0113 28 43 58 0213 28 43 58 0312 27 42 57 0412 27 42 57 0512 27 42 57 0612 27 42 57 0712 27 42 57 Direc-tion 5 O 5 5 5 10 O O 350 355 350 350 5 5 O 355 5 10 20 25 25 20 10 5 O 355 350 345 345 355 350 345 Direc-tion 185 185 185 185 180 180 185 185 180 185 180 180 185 190 190 190 190 190 190 180 190 185 185 195 190 190 195 190 195 185 190 190 Speed 17 20 23 20 17 7 7 7 10 14 10 7 7 10 17 7 7 7
4
4 4 4 7 7 10 7 10 14 7 14 14 14 Speed 35 36 51 54 41 51 48 51 51 58 51 51 51 51 51 44 45 48 45 41 41 45 45 42 38 29 29 29 29 35 38 38 Local hour 0801 16 30 45 0900 15 30 45 1000 15 30 45 1100 15 30 45 1200 15 30 45 1300 13 30 45 1400 15 3044
59 1514 29 44 Local hour 0812 27 42 57 0912 26 41 56 1011 26 41 56 1111 26 41 56 1211 26 41 56 1311 26 41 56 1411 26 41 56 1511 26 40 55Bolro Inst. oceanogr. S Paulo, 16 (1) :23-38, 1967
OCTOBER 7 Local hour 0009 24 39 54 0109 24 39 54 0209 24 1330 45 1400 15 30 45 1500
OCTOBER 8
Local hour 0013 28 43 58 0113 28 43 58 0213 28 43 58 0313 28 42 57 0412 27 42 57 0512 27 42 57 0612 27 42 57 0712 27 42 57 Direc-tion 185 180 180 180 185 185 180 180 180 175 350 355 355 350 350 355 350 Dlrec-tion
o
O 5 5 355 O 5 O O O O O O O O 355 355 O O O O O O O O O O O O O 5 5 Speed 20 23 26 26 29 23 20 17 17 4 42 45 42 45 51 51 58 Speed 48 45 51 48 51 51 51 51 51 48 51 51 51 42 42 48 55 58 61 64 58 58 55 55 58 55 51 51 55 51 48 48 Local hour 1514 29 44 59 1614 29 44 59 1714 29 44 59 1814 29 44 59 1914 29 Local hour 0812 27 42 57 0912 27 42 56 1011 26 41 56 1111 26 41 56 1211 26 41 56 1311 26 41 56 1411 26 41 56 1511 26 41 56Bolm ]:I}§~ : gceanogr. S Paulo, 16 (1) :23-38, 1967
OCTOBER 9 Local hour 0009 24 39 54 0109 24 39 54 0209 24 39 54 0309 24 39 54 0409 24 38 53 0508 23 38 53 0608 23 38 53 0708 23 38 53
OCTOBER 10
Local hour 0005 20 35 50 0105 20 35 50 0205 20 35 50 0305 20 35 50 0405 20 35 50 0505 20 34 49 0604 19 34 49 0704 19 34 49 Direc-tion 320 315 205 190 180 175 170 130 125 150 170 180 180 180 180 175 180 180 170 170 175 175 180 170 165 165 160 145 140 140 155 150 Direc-tion 185 185 185 190 190 190 190 190 190 185 195 190 185 185 185 190 190 190 185 180 185 190 200 195 200 195 185 200 195 195 195 185 Speed
o
4 4 4 4 O O 4 4 4 4 4 4 7 10 14 7 10 7 4 4 7 7 10 7 4 O 4 4 7 7 17 Speed 48 48 48 48 48 48 45 39 42 42 48 45 48 45 45 48 42 45 51 39 39 35 29 30 30 29 20 20 23 20 23 26 Local hour 0808 23 38 53 0908 23 38 53 1008 23 38 52 1107 22 37 52 1207 22 37 52 1307 22 37 52 1407 22 37 52 1507 22 37 52 Local hour 0804 19 34 49 0904 19 34 49 1004 19 34 49 1104 19 34 48 1203 18 33 48 1303 18 33 48 1403 18 33 48 1503 18 33 48Bolm Inst. oceanogr. S Paulo, 16(1) :23-38, 1967
OCTOBER 11 Local hour 0002 16 31 46 0101 16 31 46 0201 16 31 46 0301 16 31 46 0401 16 31 46 0501 16 31 46 0601 16 30 45 0700 15 30 45
OCTOBER 12
OCTOBER 15
Local Direc- Local Direc- Local
Direc-hour tion Speed hour tion Speed hour tion Speed
0722 300 4 1306 O 70 1835 O 79
37 40 O 21 O 73 50 5 82
52 O 4 36 5 76 1905 O 82
0801 285 4 51 10 79 20 O 82
22 285 4 1406 10 85 35 5 79
31 310 4 21 10 95 50 O 73
52 325 7 36 5 95 2005 O 70
0907 355 26 51 O 97 20 O 73
22 340 7 1506 O 97 35 O 73
37 350 10 21 5 104 50 O 79
52 10 14 36 5 95 2105 O 82
1007 355 10 51 5 95 20 O 88
22 O 10 1600 5 85 35 355 85
36 350 13 21 10 85 50 O 85
51 355 23 36 10 85 2205 O 85
1106 355 29 50 5 88 20 O 82
21 350 17 1705 5 80 35 O 79
36 345 39 20 5 79 50 355 79
51 355 45 35 5 76 2304 355 77
1206 355 51 50 5 76 19 355 77
21 O 57 1805 O 76 34 355 73
36 O 64 20 O 76 49 355 73
51 O 73
OCTOBER 16
Local Direc- Local Direc- Local
Direc-hour tion Speed hour tion Speed hour tion Speed
0004 350 77 0518 O 70 1018 O 67
19 350 73 33 355 73 33 O 64
34 355 79 48 355 60 48 O 70
49 355 76 0603 355 57 1103 O 70
0104 355 79 18 345 64 18 O 70
19 355 82 33 355 70 32 O 64
34 355 82 48 355 76 47 O 60
49 355 79 0703 355 70 1202 O 77
0204 355 76 18 5 73 17 355 60
19 355 76 33 O 73 32 O 58
34 O 76 48 355 70 47 O 61
49 O 80 0803 O 73 1302 5 64
0304 355 79 18 355 73 17 5 64
19 355 76 33 355 75 32 O 70
34 355 76 48 O 76 47 O 73
49 O 79 0903 O 73 1402 O 70
0404 5 79 18 O 79 17 O 70
19 O 79 33 O 76 32 O 73
34 5 76 48 O 70 47 355 73
49 O 76 1003 O 76 1502 O 79
0504 O 73