Alexandre GrangeiroI Maria Mercedes EscuderII Karina WolffenbüttelIII Ligia Rivero PupoII
Maria Ines Battistella NemesI Paulo Henrique Nico MonteiroII
I Departamento de Medicina Preventiva. Faculdade de Medicina. Universidade de São Paulo. São Paulo, SP, Brasil
II Instituto de Saúde. Secretaria de Estado da Saúde de São Paulo (SES-SP). São Paulo, SP, Brasil
III Centro de Referência e Treinamento em DST/AIDS. SES-SP. São Paulo, SP, Brasil Correspondence:
Alexandre Grangeiro Av. Dr. Arnaldo 455, 2º andar Cerqueira César
01246-903 São Paulo, SP, Brasil E-mail: [email protected] Received: 04/30/2008 Revised: 08/04/2008 Approved: 09/07/2008
Technological profi le
assessment of voluntary HIV
counseling and testing centers
in Brazil
ABSTRACT
OBJECTIVE: To characterize and analyze technological profi les of voluntary HIV counseling and testing centers in Brazil.
METHODS: A structured self-completion questionnaire with 78 questions was used. This questionnaire was answered by 320 (83.6%) of the 383 Brazilian centers, in 2006. Responses that characterized the services’ technological profi le were analyzed using K-means clustering technique. Associations between the profi les described and the municipal contexts were analyzed using the chi-square and residue analysis for proportions, and ANOVA and Bonferroni for means.
RESULTS: Centers showed signifi cant defi ciencies to guarantee adequate services. A total of four technological profi les were identifi ed. The “care” profi le (21.6%) predominated among the services instituted before 1993, in areas with high AIDS incidence and in large cities. The “prevention” profi le (30.0%), prevalent between 1994 and 1998, was the type that best complies with the Ministry of Health’s norms, with better readiness and productivity indicators. The “care and prevention” profi le (26.9%), included in the AIDS services, predominated between 1999 and 2002, and developed the most comprehensive set of activities, including STD treatment. The “testing” profi le (21.6%) was the most precarious, found where the epidemic is most recent and with a lower number of people tested.
CONCLUSIONS: Counseling and testing centers constitute a set of heterogeneous services. In addition, service implementation guidelines have not been completely incorporated in Brazil, thus having and infl uence on low resolution and productivity indicators and also the inadequate development of prevention activities.
DESCRIPTORS: Acquired Immunodefi ciency Syndrome, prevention & control. AIDS Serodiagnosis. Health Service Access. Health Service Assessment. Health Care Quality, Access and Assessment.
INTRODUCTION
In the 1980’s, when the fi rst tests for HIV diagnosis appeared, a service network named Centros de Testagem e Aconselhamento – CTAa(Voluntary Counseling
and Testing Centers – VCT) began to be organized in Brazil. This was the fi rst alternative to promote, anonymously and voluntarily, access to information
on diseases, prevention materials and AIDS services by the population.21 This service network also aimed
to increase blood transfusion safety, helping individu-als who sought blood banks to have the anti-HIV test performed.1,20
The fi rst norms of the Ministry of Healtha recommended
services to be established with multidisciplinary teams, where there is a great fl ow of population, and indepen-dently from existing health services. To achieve this, in the 1990’s, the Ministry of Health funded projects to establish a service network in cities with signifi cant HIV prevalence, a process which was subsequently decentralized.22,b
The CTA’s role changed in the late 1990’s,b as a result
of changes in the epidemic’s tendency2,6,15 and the
incor-poration of technological innovations for HIV diagnosis and disease treatment.7,11,19 Among these changes are
the need to promote early HIV infection diagnosis and increase the number of clients served, including women, heterosexuals and low-income individuals; and to incorporate hepatitis diagnosis and HIV rapid tests, especially in areas with less developed laboratory infrastructure.c
Changes in the epidemic and policies adopted, such as the AIDS program decentralization, the adoption of strategies to reduce vertical transmission and the campaigns to promote anti-HIV testing contributed to reorganize the CTA network. In this way, new direc-tives caused the requirement of client anonymity to be optional; expanded prevention activities, developing actions for vulnerable populations and in the com-munity; incorporated vertical transmission prevention activities, performing diagnosis in pregnant women; and increased interaction with outpatient services to guarantee access and infected individuals’ adherence to services and antiretroviral therapy.b Concomitantly,
the Ministry of Health began to recommend the avail-ability of diagnosis in primary care, especially in pre-natal care, tuberculosis clinics and population served by family health teams.
These different organizational situations have contrib-uted for the CTA organization and functioning to occur with specifi c characteristics and in some unknown way.
Moreover, there are no studies that analyze service characteristics on a national basis, as well as their contribution to control the epidemic in Brazil. Despite these specifi c characteristics studies have shown that diagnosis promotion policies, including the CTA proposal, yield poor results. Among these results, it is estimated that 70% of the adult Brazilian population has never had an anti-HIV test performed,d a
propor-tion reaching 34.2% of drug users,4 72.7% of men who
have sex with other mene and 63.5% of sex workers not
included in prevention activities.d
In addition, similarly to developed countries,8 over 40% of the infected people
begin clinical follow-up late, resulting in severe im-munological impairment, and 48% of pregnant women infected are not identifi ed, missing the opportunity to prevent vertical transmission.18
This study aimed to characterize and analyze techno-logical profi les of the national network of voluntary counseling and testing centers, associating them with the network establishment’s history and with the mu-nicipality contexts.
METHODS
A total of 383 services, self-denominated CTAs or thus denominated by national and state STD and AIDS programs, were included in this study, regardless of other organizational characteristics and inclusion in the health system. CTAs were identifi ed from the National STD and AIDS Program registration database and from information of the health state departments in 2006.
The technological profile analyzed considered the service health work process (structure and activities performed) that characterize each CTA or groups of CTA.9,14 Information was obtained from a structured
self-completion questionnaire, designed and used in the research study “Situational Diagnosis of Counseling Centers in Brazil”.f
The self-completion questionnaire with 78 questions was mailed to service managers between August 2006 and January 2007. Inconsistent responses were checked by telephone.
The variables analyzed refer to: structure – the existence
a Ministério da Saúde. Programa Nacional de DST e AIDS. Normas de organização e funcionamento dos Centros de Orientação e Apoio Sorológico. Brasília; 1993.
b Ministério da Saúde. Programa Nacional de DST e AIDS. Diretrizes dos Centros de Testagem e Aconselhamento (CTA) – Manual. Brasília; 1999. c Ministério da Saúde. Programa Nacional de DST e AIDS. Teste rápido – Por que não? Estudos que contribuíram para a política de ampliação da testagem para o HIV no Brasil. Brasília; 2007.
d Ministério da Saúde. Programa Nacional de DST e AIDS. Pesquisa de conhecimento, atitudes e práticas na população brasileira de 15 a 54 anos, 2004. Brasília; 2005.
e França-Junior I, Lopes F, Paiva V, Venturi G. Acesso ao Teste Anti-HIV no Brasil 2003: A Pesquisa MS/Ibope. Brasília: Ministério da Saúde; 2003 [cited 2009 Feb 24]. Available from: http://www.aids.gov.br/data/documents/storedDocuments/%7BB8EF5DAF-23AE-4891-AD36-1903553A3174%7D/%7B7B791F50-5AC7-4F86-ABE7-1C7A578EBFB3%7D/artigo_teste.pdf
of a minimum physical area (individual and group counseling, waiting, and blood collection rooms), the presence of doctors in the team (% in relation to the total number of professionals), and the existence of prevention materials (male and female condoms and gel lubricant); clients served – origin of demand and social segment they belong to; activities performed – serologi-cal tests available, prevention actions in and out of the service sphere, STD treatment and the availability of specialized service referrals; and access – possibility of an anonymous service, mandatory pre- and post-test counseling and visit time.
Analysis was performed in two dimensions: description of technological profi les and analysis of the context where CTAs are included. K-means clustering analysis16
was used to describe the profi les, with nominal variables turned into dichotomic variables, attributing values to the absence (0) and presence (1) of each attribute studied. The permanence of variables in the analytical model was defi ned using the ANOVA variance analysis test, adopting a 0.05 level of signifi cance.
Characterization of technological profi les was based on the percentages of occurrence of variables included in the analytical model.
The second dimension of the study – context analysis – was performed by means of a study of association between different technological profi les and the period of service implementation, its geographical distribution and health system and AIDS epidemiological charac-teristics, with special attention to public investments and reproductive health policy. The following indica-tors were considered for this analysis: year and area of service implementation, population and municipal HDI, number of AIDS cases, CTA inclusion in the health system, pre-natal coverage and public health expenses. Indicators were based on the Unifi ed Health System De-partment of Computer Sciences (Datasus), the Instituto Brasileiro de Geografi a e Estatística (IBGE – Brazilian Institute of Geography and Statistics) and the (Sinan – Information System on Disease Notifi cation).
To analyze the context, cities were considered as a unit of study, and each city’s technological profi le was characterized, i.e., the profi le present in more than 50% of the CTAs established in this location. The cities of Aracaju (state of Sergipe), Contagem (state of Minas Gerais), Cuiabá (state of Mato Grosso), Manaus (state of Amazonas), Ribeirão Preto (state of São Paulo), Rio de Janeiro (state of Rio de Janeiro), São Paulo (state of São Paulo) e Sinop (state of Mato Grosso) were ex-cluded from this analysis as they did not have a defi ned technological profi le.
In addition, technological profi les were analyzed ac-cording to their capacity to make HIV diagnosis avail-able, considering the information included in the
self-completion questionnaire: population served (inclusion of vulnerable populations and positive HIV rate among clients), testing productivity (number of tests performed daily by a university professional/technician) and readi-ness (user’s length of stay in the service and delivery of test result and return rate).
Chi-square test and residue analysis on a contingency table (Zres), with a 0.05 signifi cance level, were used to analyze associations. Considering the 95% confi dence level, every Zres > |1,96| was regarded as either excess or lack of occurrence.16 ANOVA variance analysis was
used to compare means of indicators observed in each technological profi le, with the application of Bonferroni test for multiple comparisons.
This study was approved by the Instituto de Saúde (Institute of Health) Research Ethics Committee of the State of São Paulo Department of Health (Protocol 06/2006).
RESULTS
As regards the technological profi le, information about 320 CTAs that answered the survey was analyzed (83.6%) (Table 1) with response rates varying between 72.3% in Brazil’s Center-West region and 90.6% in the Southeast region. The CTAs analyzed were concen-trated in the Southeast (39.4%) and Northeast regions (17.5%) (Table 2), of which the majority (81.9%) were classifi ed as small- and average-sized, with a production of 1.7 anti-HIV tests/day per university professional/ technician. Rates above 1% HIV positivity were re-ported by 63.1% of the services (Table 3). Readiness indicators for testing were relatively low: 19.1% of the services showed user’s length of stay in the service below one hour, with delivery of test results in up to 15 days and a return rate above 60% (Table 3).
In the analysis of the three populations mainly served in each service, the general population (91.9%), pregnant women (49.1%) and vulnerable populations (30.6%) were more prevalent. Among the activities reported, preventive activities in the community for the general and vulnerable populations (59.4%), the availability of a minimum syphilis, hepatitis and HIV serology set (65.6%) and the STD service (56.3%) predominated (Table 1).
Physical structure was found to be precarious in 44.4% of the services, as these did not have a minimum space for the client’s reception, performance of counseling activities and biological material collection. Of all the services, 18.8% had all STD prevention materials, such as male and female condos and gel lubricant (Table 1).
other and with distinct vocations and natures, which were used to name each group, as detailed below (Tables 1 and 2).
In the “testing” profi le, 69 services were identifi ed, cor-responding to 21.6% of the universe studied. Services were mostly directed towards offering HIV diagnosis, with a priority service for pregnant women as a vertical transmission prevention strategy. This set of services had the lowest positive anti-HIV test rates, of which 50% showed rates below 1%. In addition, they were the ones that least performed the activities recommended by the Ministry of Health, such as the availability of syphilis and hepatitis B and C diagnosis and the development of prevention and care activities. CTAs
that showed precarious physical structure, defi ciency in the establishment of care referrals, low availability of prevention materials and restrictive criteria for user access, with mandatory identification and pre-test counseling comprised this group.
The “care” profi le was also comprised by 69 CTAs (21.6% of services) and was characterized as the group in which individual care prevailed, mainly offering STD treatment and HIV, syphilis and hepatitis sero-logical tests. However, services of this profi le showed the worst readiness indicators, performing the lowest number of anti-HIV tests per university professional/ technician (1.4 tests/day) and the smallest proportion of CTAs with delivery of test results in up to 15 days Table 1. Technological profi le of counseling and testing centers and percentage distribution of structural characteristics, service clientele, activities developed and access criteria. Brazil, 2006.
Characteristic
Profi le (%)
Care Prevention Care and
prevention Testing Total
(n=69) (n=96) (n=86) (n=69) (N=320)
Structure
Presence of individual and group counseling, waiting and
collection rooms 55.1 62.5 61.6 39.1 55.6
Blood sample collection in the service itself 65.2 88.5 50.0 52.2 65.3
Availability of male and female condoms and gel lubricant 11.6 35.4 18.6 2.9 18.8
Doctors in the technical team 17.9 9.1 24.0 15.7 16.5
Service clientele
Vulnerable populations 47.8 50.0 17.4 2.9 30.6
Secondary service referral 39.1 3.1 51.2 13.0 25.9
Pregnant women 4.3 45.8 45.3 98.6 49.1
Activities performed Prevention inside the unit
Vulnerable population 33.3 56.3 64.0 17.4 45.0
Therapy adherence groups and/or counseling for
HIV-discordant couples 20.3 27.1 44.2 4.3 25.3
Prevention outside the unit
Not performed 15.9 - - 21.7 8.1
For the general population 79.7 - 1.2 50.7 28.4
For the general and vulnerable population - 95.8 97.7 20.3 59.4
Harm reduction 02.9 19.8 17.4 - 11.3
Mobile CTA 13.0 65.6 37.2 20.3 36.9
Diagnosis and care
HIV, syphilis, and hepatitis B and C serology 79.7 65.6 81.4 31.9 65.6
STD treatment 60.9 27.1 91.9 47.8 56.3
Formal care referral 63.8 61.5 89.5 58.0 68.7
Access
Night service 8.7 24.0 14.0 1.4 13.1
Free identifi cation (password, nickname or name) 60.9 84.4 40.7 33.3 56.6
Pre- or post-test counseling not mandatory 15.9 31.3 30.2 7.2 22.5
and to more than 60% of clients. This was the second group with fewer prevention actions inside and outside the unit and, when such actions were performed, they were directed towards the general population. Among the clientele served, there were a great number of vulnerable populations and individuals sent by the secondary care network. This technological profi le, resulting from the clientele make-up, was comprised by services with the highest positive anti-HIV test rates: 24.6% were above 5%.
The “care and prevention” profi le was present in 26.8% (86) of services, and it was characterized by the de-velopment of the most comprehensive set of activities, performing preventive and care actions, both in and out of its sphere. This profi le showed the highest availabil-ity for STD treatment and HIV, syphilis and hepatitis serological tests, with the best tools to refer infected people. In addition, it was the one that most performed prevention activities for vulnerable populations cared for in the unit. There were a proportionately higher number of doctors, compared to the other groups, and the clientele was comprised of referred patients and
pregnant women.
The “prevention” profi le was responsible for the highest number of centers, 96 (30.0%). The object of work was characterized by offering prevention actions, inside and outside the unit, such as the existence of mobile CTAs, availability of prevention materials and execution of harm-reducing actions. This profi le was the one that most adopted fl exible criteria for client access, maintain-ing a night service and not requirmaintain-ing user identifi cation and pre-test counseling. These services were those that most cared for vulnerable populations, showing the greatest diversity of social groups among the clientele served, including drug users, homosexuals, transvestites, and sex workers. In addition, they showed the best readiness and productivity indicators. The daily mean of tests per university professional/technician was 2.3 and it included the greatest proportion of services with delivery of test results in less than 15 days, with a user return rate above 60%. Comparatively to other profi les, this group had the best physical structure and the lowest proportion of doctors in the team of professionals. Table 2. Standardized residual (Zres) of technological profi les per region, location, health network inclusion and implementation period. Brazil, 2006.
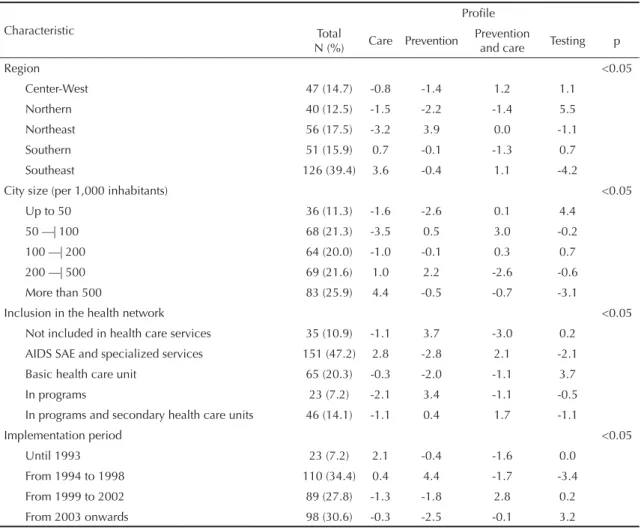
Characteristic
Profi le Total
N (%) Care Prevention
Prevention
and care Testing p
Region <0.05
Center-West 47 (14.7) -0.8 -1.4 1.2 1.1
Northern 40 (12.5) -1.5 -2.2 -1.4 5.5
Northeast 56 (17.5) -3.2 3.9 0.0 -1.1
Southern 51 (15.9) 0.7 -0.1 -1.3 0.7
Southeast 126 (39.4) 3.6 -0.4 1.1 -4.2
City size (per 1,000 inhabitants) <0.05
Up to 50 36 (11.3) -1.6 -2.6 0.1 4.4
50 —| 100 68 (21.3) -3.5 0.5 3.0 -0.2
100 —| 200 64 (20.0) -1.0 -0.1 0.3 0.7
200 —| 500 69 (21.6) 1.0 2.2 -2.6 -0.6
More than 500 83 (25.9) 4.4 -0.5 -0.7 -3.1
Inclusion in the health network <0.05
Not included in health care services 35 (10.9) -1.1 3.7 -3.0 0.2
AIDS SAE and specialized services 151 (47.2) 2.8 -2.8 2.1 -2.1
Basic health care unit 65 (20.3) -0.3 -2.0 -1.1 3.7
In programs 23 (7.2) -2.1 3.4 -1.1 -0.5
In programs and secondary health care units 46 (14.1) -1.1 0.4 1.7 -1.1
Implementation period <0.05
Until 1993 23 (7.2) 2.1 -0.4 -1.6 0.0
From 1994 to 1998 110 (34.4) 0.4 4.4 -1.7 -3.4
From 1999 to 2002 89 (27.8) -1.3 -1.8 2.8 0.2
From 2003 onwards 98 (30.6) -0.3 -2.5 -0.1 3.2
In terms of context analysis, there was an important association between the technological profi les and the geographical, epidemiological, and health network (of the cities where it is included) characteristics, which may have contributed to the diversifi cation in the way services were organized (Tables 2 and 4).
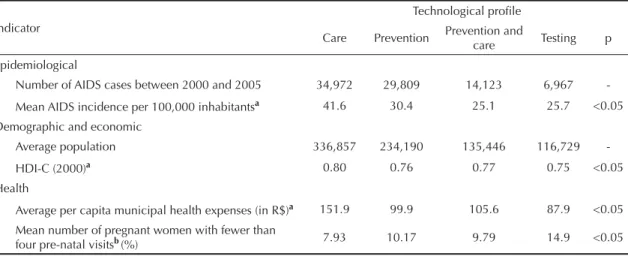
The fi rst stage of CTA expansion, which occurred be-fore 1993, was associated with the “care” technological profi le and the CTAs located in the Southeast region, in cities with more than 500,000 inhabitants. This profi le showed the best mean municipal human development indices (2000), the highest AIDS incidence rates, the
Table 4. Epidemiological, demographic, economic and health indicators, according to cities characterized by predominant technological profi le. Brazil, 2006.
Indicator
Technological profi le
Care Prevention Prevention and care Testing p
Epidemiological
Number of AIDS cases between 2000 and 2005 34,972 29,809 14,123 6,967
-Mean AIDS incidence per 100,000 inhabitantsa 41.6 30.4 25.1 25.7 <0.05
Demographic and economic
Average population 336,857 234,190 135,446 116,729
-HDI-C (2000)a 0.80 0.76 0.77 0.75 <0.05
Health
Average per capita municipal health expenses (in R$)a 151.9 99.9 105.6 87.9 <0.05
Mean number of pregnant women with fewer than
four pre-natal visitsb(%) 7.93 10.17 9.79 14.9 <0.05
HDI-C: Human Development Index of the city
a Signifi cant difference between “care” profi le and the other three profi les. b Signifi cant difference between “care” profi le and basic profi le.
Table 3. Proportion and standardized residual (Zres) of counseling and testing centers per readiness and productivity indicators. Brazil, 2006.
Indicator
Profi le % and (Zres)
p Total
% Care Prevention
Prevention
and care Testing
Proportion of services that care for
Sex professionals, homosexuals, transvestites and
transsexuals 48.4 12.8 (1.8) 18.8 (3.3) 10.9 (-1.7) 6.3 (-3.7) <0.00
Drug users (injecting and non-injecting) 27.5 7.8 (1.8) 11.6 (2.9) 5.0 (-2.2) 3.1 (-2.7) <0.00
Secondary health service referrals 53.1 12.2 (0.6) 10.0 (-4.6) 19.1 (3.9) 11.9 (0.4) <0.00
Health professionals 6.9 3.1 (2.8) 1.6 (-0.8) 0.9 (-1.5) 1.3 (-0.4) <0.04
Pregnant women 52.8 3.1 (-7.2) 15.3 (-0.4) 13.1 (-0.9) 21.3 (8.6) <0.00
HIV prevalence
Services with less than 1% (%) 36.9 4.9 (-2.5) 12.3 (-0.1) 9.7 (0.4) 10.1 (2.2) <0.00
Services with more than 5% (%) 12.7 5.2 (3.0) 3.4 (-0.9) 3.0 (-0.2) 1.1 (-1.8) <0.05
Readiness
Services with user length of stay below one hour, delivery of test result in less than 15 days and return rate above 60% (%)
19.1 2.2 (-2.1) 7.8 (2.1) 6.3 (1.2) 2.8 (-1.4) <0.03
Mean Mean Mean Mean Mean p
Productivity a
Mean number of tests/day per university
professional and technician 1.7 1.3b 2.3b 1.4b 1.9 <0.00
a Mean productivity tested with ANOVA, multiple differences with Bonferroni test
greatest number of doctors and medical visits per thousand inhabitants and the highest municipal health expenses (Tables 2 and 4).
The second stage of CTA expansion, between 1994 and 1998, was associated with “prevention” tech-nological profi le CTAs, which predominate in cities with 200,000 to 500,000 inhabitants, in the Northeast region. This was the second group in number of AIDS cases and in population, and it was the most prevalent profi le among the CTAs not included in health units or which were associated with AIDS programs. The period of establishment of these CTAs coincided with the stage when the Ministry of Health funded service effectiveness projects.
The CTAs’ third stage of expansion occurred between 1998 and 2002 and was related to the “care and preven-tion” group, better distributed throughout the country’s administrative regions, and predominating in average-sized cities, with a number of inhabitants ranging between 50,000 and 100,000. The inclusion of these CTAs occurred mainly in specialized AIDS services, and the period of occurrence was characterized by the epidemic’s spread to the countryside, the use of high-potency antiretroviral therapy, and the increase in the number of AIDS outpatient clinics.
“Testing” CTAs predominated among those established after 2003, in the Northern region, in small-sized cities with up to 50,000 inhabitants. These cities included the lowest number of people and AIDS cases and, when compared to cities with “care” CTA, showed the worst reproductive health indicators – 14.9% of pregnant women made less than four pre-natal visits (Table 4). Even though services with this profi le were included on several health care levels, those established in primary care units predominated.
DISCUSSION
Findings suggest that, after two decades, the CTA network shows signifi cant limitations to guarantee di-agnosis service quality and prevention action develop-ment. This network’s period of establishment, the epi-demiological profi le and regional and health network characteristics contributed to determine different CTA organization and functioning ways in Brazil, character-izing the existence of distinct technological profi les. The principles their establishment was founded upon have not been completely incorporated into the CTA work process, and the “prevention” profi le was the one that best organized its activities, in accordance with
equity and comprehensiveness directives. Furthermore, this profi le adopts health practices centered on the com-munity and individual needs – directives expressed as Ministry of Health norms for service organization. The “testing” profi le was the model that least incorporated such principles.
Among the CTA limitations identifi ed, four of them substantially restrict the capacity these services have to fulfi ll their role: precarious infrastructure, represented by a large number of services without minimum space to perform diagnosis, counseling and prevention ac-tivities; insuffi cient prevention actions due to a lack of materials and the reduced number of activities for vulnerable populations and in communities; low readi-ness, considering the long test result waiting time, the low number of tests performed and the reduced variety of tests available; and restrictive service access criteria, with a predominant day service and mandatory
identi-fi cation and pre-test counseling.
CTA precariousness has already been reported by other studies, which, in addition to what was previously de-scribed here, emphasize the fact that prevention actions are restricted to counseling; the small interaction with the health network, contributing to the fragility of mech-anisms of care service referrals and integration with policies to fi ght the disease; and service inaction.12,a,b
Even though limitations can be observed in all techno-logical profi les, the “testing” and “care” services show the major defi ciencies, which may mean additional diffi culties to fi ght the epidemic. CTAs with a “testing” profi le, the most precarious ones, are established in areas where epidemics are more recent, characterized by high incidence growth rates.3 In addition, these areas
showed the lowest proportion of population testedc and
high late diagnosis prevalence, facts that require higher service response capacity to, among other things, mini-mize the greater health structure defi ciency shown by this study’s analysis.
CTAs with the “care” profi le, in their turn, are estab-lished in areas with the highest AIDS incidence rates and a substantial proportion of cases in marginalized social classes.3 Even though these areas have better
health structure, the fact that specialized services have been better assessed in their capacity to include vulnerable populations and to offer high-quality tests and counseling should be considered.17 This fact may
contribute to promote equity among these regions.
Another aspect is the analysis of incorporation of directives upon which CTA establishment in Brazil
a Silva SMB. Centro de Testagem e Aconselhamento (CTA): caminhos e trilhas em construção. [dissertação de mestrado]. Rio de Janeiro: Universidade Federal do Rio de Janeiro; 2004.
b Wolffenbuttel K. A Organização Tecnológica do Centro de Testagem e Aconselhamento (CTA) no enfrentamento da epidemia de DST/ AIDS no Estado de São Paulo. [dissertação de mestrado]. São Paulo: Faculdade de Ciências Médicas da Santa Casa; 2006.
was founded. In the late 1980’s, in a context of great stigma associated with the disease and restructuring of the Brazilian health system, CTAs proposed the organization of an innovative service model,12 which
sought to overcome the common barriers of health network access and of service models founded upon doctor-individual care.
Analysis of the set of work processes predominating in the CTAs indicated, however, that the directives which presupposed a new service model organization had not been fully incorporated, a fact indicated by insuffi cient activities to promote health equity, comprehensiveness and practices centered on the community and indi-vidual needs. This aspect may contribute to the low readiness in diagnosis availability, service inaction, and reduced inclusion of vulnerable groups and those with high HIV prevalence.
Corroborating this hypothesis, the “prevention” and “prevention and care” technological profi les, which, comparatively, incorporated the recommended CTA organization principles more fully, are those that had the best performance, considering the indicators ana-lyzed. This hypothesis had already been discussed by other studies, showing that service organization based on the needs and context of individuals contributes
to increase action effectiveness10,13,17 and minimizes
stigma associated with the disease. Moreover, the exclusion of common service access barriers, such as mandatory user identifi cation, has been reported as an important requirement to promote diagnosis and the search for services.5,10
The present study did not aim to create a hierarchy among the different work processes that characterize CTAs, but sought to describe aspects that infl uenced the capacity of services to offer diagnosis and prevention actions. The technological profi les identifi ed pointed out that each group has its own vocation and nature. These specifi ci-ties were constituted from the contexts in which services are included and from the changes that occurred in the epidemic profi le and disease-fi ghting policies, an aspect that should be analyzed in-depth by future studies.
1. Basso CR. O programa nacional de DST/AIDS no SUS. In: Barjas-Negri AL, D’Avila V, editores. O Sistema Único de Saúde em dez anos de desafi o. São Paulo: Sobravine/Cealag; 2002. p. 135-62.
2. Bastos FI, Szwarcwald CL. AIDS e pauperização: principais conceitos e evidências empíricas. Cad Saude Publica. 2000;16(Supl 1):65-76. DOI: 10.1590/ S0102-311X2000000700006
3. Dourado I, Veras MASM, Barreira D, Brito, AM. Tendências da epidemia de Aids no Brasil após a terapia anti-retroviral. Rev Saude Publica.
2006;40(Supl):9-17. DOI: 10.1590/S0034-89102006000800003
4. Ferreira AD, Caiaffa WT, Bastos FI, Mingoti SA. Usuários de drogas injetáveis que (des)conhecem seu status sorológico para a infecção pelo HIV: achados do Projeto AJUDE-Brasil II. Cad Saude Publica. 2006;22(4):815-26. DOI: 10.1590/S0102-311X2006000400020
5. Ferreira MPS, Silva CMFP, Gomes MCF, Silva SMB. Testagem sorológica para o HIV e a importância dos Centros de Testagem e Aconselhamento (CTA) – Resultado de uma pesquisa no município do Rio de Janeiro. Cienc Saude Coletiva. 2001;6(2):481-90. DOI: 10.1590/S1413-81232001000200017
6. Fonseca MG, Szwarcwald CL, Bastos FI. Análise sociodemográfi ca da epidemia de AIDS no Brasil, 1989-1997. Rev Saude Publica. 2002;36(6):678-85. DOI: 10.1590/S0034-89102002000700004 7. Galvão J. Brazil and access to HIV/AIDS drugs: a
question of human rights and public heath. Am J Public Health. 2005;95(7):1110-16.
8. Girardi E, Sabin CA, Monforte AA. Late diagnosis of infection: epidemiological features, consequences and strategies to encourage earlier testing. J Acquir Immune Defi c Syndr.2007;46(Supl 1):3-8.
9. Gonçalves RBM. Tecnologia e organização social das práticas de saúde: características tecnológicas do processo de trabalho na Rede Estadual de Centros de Saúde de São Paulo. São Paulo: Hucitec; 1994. 10. Irwin KL, Valdisseri RO, Holberg SD. The acceptability
of voluntary HIV antibody testing in the united states: a decade of lessons learned. AIDS. 1996;10(14):1707-17. 11. Levi GC, Vitoria MAA. Fighting Against AIDS: The
Brazilian Experience. AIDS. 2002; 16(18):2373-83.
12. Minayo MCS, Souza ER, Assis SG, Cruz Neto O, Deslandes SF, Silva CMFP. Avaliação dos Centros de Orientação e Apoio Sorológico (CTA/ COAS) da Região Nordeste do Brasil. Cad Saude Publica. 1999;15(2):355-67. DOI: 10.1590/S0102-311X1999000200020
13. Myers T, Worthington C, Haubrich DJ, Ryder K, Calzavara L. HIV testing and counseling: test provider’s experiences of best practices. AIDS Educ Prev.
2003;15(4):309-19.
14. Nemes MIB. Prática programática em saúde. In: Schraiber LB, Nemes MIB, Mendes-Gonçalves RB, editores. Saúde do adulto: programas e ações na unidade básica. 2. ed. São Paulo: Hucitec; 2000. p. 48-65.
15. Parker R, Camargo Jr. KR. Pobreza e HIV/AIDS: aspectos antropológicos e sociológicos. Cad Saude Publica. 2000;16(Sup1):89-102. DOI: 10.1590/S0102-311X2000000700008
16. Pereira JCR. Análise de dados quantitativos: estratégias metodológicas para as ciências da saúde, humanas e sociais. 3.ed. São Paulo: Edusp; 2001. p. 94-111. 17. Rudy ET, Mahoney-Anderson PJ, Loughlin AM, Metsch
LR, Kerndt PR, Gaul Z, et al. Perceptions of Human Immunodefi ciency Virus (HIV) testing services among HIV positive persons not in medical care. Sex Transm Dis. 2005,32(4):207-13.
18. Souza Jr PRB, Szwarcwald CL, Barbosa Júnior A, Carvalho MF, Castilho EA. Infecção pelo HIV durante a gestação: Estudo-Sentinela Parturiente, Brasil, 2002.
Rev Saude Publica. 2004;38(6):764-72. DOI: 10.1590/ S0034-89102004000600003
19. Teixeira PR, Vitória MA, Barcarolo J. Antiretroviral treatment in resource-poor setting: the Brazilian experience. AIDS. 2004;18(Supl 3):5-7.
20. World Health Organization. The Joint United Nations Programme on HIV/AIDS. Guidance on provider
-initiated HIV testing and counselling in health facilities. Geneva; 2007.
21. Valdisseri RO. HIV Counseling and testing: evolving role in HIV Prevention. AIDS Educ Prev. 1997;9(Supl 3):2-13.
22. World Bank. Implementation Completion Report Brazil: Aids and STD Control Project. Washington; 1998.
REFERENCES