ISSN 1450-288X Issue 10 (2009) © EuroJournals Publishing, Inc. 2009 http://www.eurojournals.com/JMIB.htm
Determinants of Portuguese Bank’s Provisioning
Policies: Discretionary Behaviour of Generic and
Specific Allowances
1Paulo Soares de Pinho
Corresponding Author, Universidade Nova de Lisboa Faculdade de Economia Rua Marquês de Fronteira
20, 1099-038 Lisbon, Portugal
E-mail: pjpinho@fe.unl.pt Nuno Carvalho Martins2
Barclays Capital, London
Abstract
In this paper we test for the impact of the regulatory environment on a bank’s discretionary provisioning practices. We develop a model that structures the dynamics of the provision policy for the two classes of provisions: generic provisions and specific provisions. The model is tested using a comprehensive database of all financial institutions operating in Portugal for 1990-2000. This unique dataset comprises banks subject to the Portuguese rules as well as bank subsidiaries subject to their home-country regulation and we were able to identify distinct behaviours between them. Our results show the importance of handling the two types of provisions separately. They support the hypothesis that banks have a discretionary behaviour in setting up their provisions, and find evidence of income-smoothing and capital management. We also find that the regulatory regime impacts on discretionary provisioning policies because banks when forced to increase one type of provision react by reducing the discretionary component of the other, a finding we designated as a substitution effect.
Keywords: Banking, Provision Policy, Income Smoothing. JEL Classification Codes: G21
1. Introduction
Bank regulators require deposit-taking institutions to create cushions against future unexpected loan losses. These safeguards, meant to protect depositors, usually take the form of provision allowances and bank “own funds”, usually designated as “capital”. Although for the latter there is an increasing
1
We are grateful to Paul Laux and Maximiano Pinheiro as well as participants in several conferences for helpful comments and suggestions
2
harmonization of the capital adequacy rules 3, there are no internationally-adopted standards for loan loss provisions 4. Even if banks’ supervision agencies generally agree on the need to create buffers against expected and unexpected future loan losses, they tend to differ regarding the quality and quantity limits of provisioning requirements. Some countries such as the US and UK, tend to be less conservative and rely on the banks’ individual policies, while other countries, such as Portugal, Spain and Italy define minimum requirements for both a generic and a specific provision. In the European Union (EU), financial institutions are subject to the home-country rule according to which banks are only subject to their own country banking supervision.5 In this paper we analyze the impact of different regulatory environments on the banks’ provisioning policies.
The literature on the determinants of provision policies set by commercial banks has been primarily focused on finding whether provisions for credit losses are driven solely by actual changes in the levels of bad loans or if they are also influenced by other “discretionary” factors, such as the banks’ need to manage their capital and reported net income. Previous research 6 has found mixed evidence of capital management and income smoothing practices, most studies being concentrated on the United States 7.
In this paper we study the determinants of provisioning policy in a particularly interesting framework, which is that of Portugal. In this country there are specific rules for the two most important types of provisions for credit risks: specific and generic provisions. The former are created to account for expected levels of losses on loans already with overdue payments, while the latter refer to future losses on loans that are already booked but currently without payments in arrears. The Portuguese legislation requires a minimum level for generic provision allowances, which is set as an arbitrary percentage of total loans outstanding, regardless of their nature. However, such regulations do not apply to bank subsidiaries from other EU countries which, in accordance with European Union rules, are subject to their “home-country” regulations. Consequently, we have two sets of banks operating in the same market under different sets of rules.
We depart from existing literature by constructing a structural model that sets up the accounting relationship between the bank loan activity and the dynamics of the provision allowances. We analyze the bank’s provisioning plan as a decision process that simultaneously determines the level of specific and generic provisions. This methodology differs from the traditional one, which is usually based upon a reduced form analysis of the determinants of total provision expenses. We test the model for the Portuguese banking system using detailed annual balance sheet and income statement data of all financial institutions operating in Portugal during the 1990-2000. For 1990-1994, banks regulated by local authorities were required to hold generic provisions at the minimum amount of 2% of total loans while this lower bound moved to 1% starting in 1995. We find that for banks subject to an increasing demanding provision regulation, as during the 1990-1994 period, there is a substitution effect between the two types of provisions for loans losses.
Our results are consistent with Lobo and Yang (2001) and Kim and Kross (1998) in finding that banks use earnings to increase their discretionary provision expense level. However, by separating between generic and specific provisions, we can uncover different effects. We find that income smoothing is more relevant for specific provisions than for generic ones. The level of generic provisions is mainly determined by total outstanding loans, while specific provisions are mainly determined by the amount of non-performing loans. Additionally, specific provisions are very sensitive
3
The first steps related to the harmonization of capital adequacy rules date back to the 1988 Basel Accord (Jackson, 1999). Later in 1992, new amendments were set forth. In the EU, legal harmonization was achieved via the Capital Adequacy Directive (CAD) in 1994. A new Basel Accord entered in place in 2008
4
Recent initiatives to provide harmonization of accounting practices resulted in the development of an International Accounting Standard (IAS) - IAS 39. For a more detailed analysis of these accounting practices see Borio and Lowe (2001).
5
This specifically applies to banks that are headquartered in the European Union.
6
See, for example, Wetmore and Brick (1994), Bhat (1996), Lobo and Yang (2001) and Kim and Kross (1998).
7
to the bad loan recoveries, write-offs and collateral coverage, which don’t seem to explain discretionary changes in generic provisions.
We observe that the provisioning plans vary across the financial institutions that operate in the same local market and differences depend on whether banks are domestic or foreign-regulated. Although it appears that all banks follow a dynamic provisioning plan, we find that foreign-owned banks tend to respond immediately to an increase in the stock of provisions, while showing evidence of a substitution effect between generic and specific provisions. The different dynamic patterns presented by domestic and foreign banks are of interest to regulatory authorities who should look carefully at the two types of financial institutions and their provision policies.
The paper is organised as follows. In Section 2 we review the literature and present the regulatory environment. In Section 3 we describe the data. Section 4 presents the structural model and the empirical analysis. Section 5 summarizes the main conclusions.
2. The Regulatory Framework
2.1. Literature ReviewPrevious research has analyzed the relationship between managerial discretionary efforts and the amount of loan loss provisions for four major practices: income smoothing, capital management, signalling and tax benefits. While agreeing upon the tax benefits motive, prior studies, mainly done for the US, reveal some mixed evidence with respect to capital management and income smoothing. Looking at the 1986-1990 period, Wetmore and Brick (1994) find no evidence of the income-smoothing hypothesis while Bhat (1996), considering the 1981-1991 period or Kanagaretnem et al. (2001) using US data for bank holding companies during the 1987-2000 period, find a close relationship between loan loss provisions and earnings. Hoggarth and Pain (2002) for the UK, find strong evidence of the income smoothing and capital management hypotheses.
Financial institutions are required to maintain minimum reserves for loan losses. The analysis of managerial discretionary practices should therefore account for the regulatory standards. Additionally, as explained in detail in the next section, different minimum standards are established for the level of the general credit and for non-performing loans. In an attempt to distinguish between the minimum requirements and the banks’ individual practices, Beaver and Engel (1996) used a two-stage empirical methodology in which the level of minimum requirements was determined at the first stage and the discretionary level was explained at the second. Other studies, such as Lobo and Yang (2001) and Kanagaretnam et al. (2001), use a one-stage approach, pooling both factors. Regardless of the empirical methodology, previous research has identified the level of the non-discretionary provisions based on a reduced form relation between the loan loss provisions expense and the total amount of loans and non-performing loans. In this framework we differ from existing literature by constructing a structural model of provisioning policy and by specifically incorporating the yearly levels of bad loan recoveries and write-offs and determine their impact on minimum provision requirements. We argue that this enlarged structural set-up is essential to distinguish between the minimum regulatory requirements and the banks’ idiosyncratic behaviour.
four discretionary effects simultaneously. They find strong evidence for income smoothing and some evidence of the signalling and capital management hypothesis when using the same measure of capital as in Ahmed et al. (1999).
Prior studies have considered that changes around the US Tax Reform Act of 1986 or the regulatory changes of 1989 determined changes in the banks practices. Alternatively, banks’ sensitivity to different regulatory regimes can be analyzed when banks operate in multiple countries and face a home country regulation. This is specifically analysed in this paper. In this way we are able to identify whether bank “idiosyncrasies” depend on the local country environment or on company-specific bank practices.
2.2. The Regulatory Environment
Unlike the capital adequacy rules set forth by the Bank of International Settlements and according to the principles advanced by the Basel Committee on Banking Supervision, there is no underlying proposal for full harmonization of the provision requirements and bad loan classification.8
Generally, all countries and bank supervision authorities agree upon the need to create buffers against loan losses on future defaults and past-due loans. However, the way this is implemented in practice differs among countries. Some countries specifically define separate provision categories for expected futures losses and for past due loans. This is what happens in Portugal, Italy, France, Denmark, Spain 9 and the Netherlands. Other countries, such as the US, Germany and the UK10, rely on the banks themselves to actually determine the adequate provisioning amount. In the latter, local authorities provide the standards and consulting advice for the definition of the expected loan losses.
In Portugal, the central authority for banking supervision, Banco de Portugal, determines the minimum required levels of provisions for loan losses. They are separated in two types of provisions: generic and specific. The latter are directly related to loans which have overdue payments. The percentage of the loan principal that should be covered by provision allowances is set upon how long payments have been overdue (time since first defaulted payment). Generic provision allowances are intended to cover unexpected loan losses and therefore should be open to some bank discretion. However, the regulator has set up strict rules for this class of provisions. Their minimum requirement is set as a percentage of outstanding loans, being 2% until 1994 and 1% after that year. Since 2000, generic provisions for consumer credit are set at a minimum of 1.5% of the total outstanding consumer debt.
Countries such as Austria, Finland and Sweden require banks to only make specific provisions against loans with overdue payments. The determination of their required level is quite ambiguous in the sense that in these countries banks have a good deal of discretionary ability to decide upon the definition of impaired assets, the quality of the collateral and the percentage of the individual loan that is recoverable.
As in Belgium, Denmark, Ireland, Sweden and the UK, in Portugal there is no tax benefit from making generic provisions. This suggests that banks may have no incentive to pursue a dynamic provision policy, and maintain the provisions at their minimum regulatory levels. However, even in the absence of a tax incentive for generic provisions, banks should be concerned about providing a buffer against future risks of its economic activity and the wide macro-economic environment. Further, in the eminence of the establishment of a new international framework of capital 11adequacy, banks should be required to provide additional capital buffers in periods of economic downturn.
8
Regulatory environments differ with respect to the loan classification and to the definition of non-performing loans. For a detailed analysis on the accounting features related with loans and credit losses see Basel Committee on Banking Supervision (1999).
9
Additionally to the generic and specific provisions, the Spanish banking supervision has introduced the statistical provisions category to account for an ex ante measure of credit risk. For a definition and empirical analysis see Lis, Pagés and Saurina (2001)
10
See for example Hoggarth and Pain (2002) for an analysis of the UK provisioning regulation
11
In Portugal, specific provision allowances are required when the principal or interest payment is past due. Depending on how long the loan has been in default (of payment not covenant) and whether the loan has collateral coverage, banks are required to make minimum provisions that can vary up to the full amount lent.
3. Data
Our database is a panel drawn from annual balance sheet and income statement data of all financial institutions operating in Portugal from 1990 to the end of 2000. This covers a period of relatively stable provision regulation. The data is collected from Banco de Portugal’s Supervision databases and the panel consists of 56 banks belonging to 27 financial groups. Among the banks operating in Portugal there are 33 domestic banks and 24 are foreign-owned. The number of banks in the panel has been changing as a result of entries, exits and mergers in the sector. By the end of 2000, the sample included 35 banks, while there were 28 in 1990. Additionally, the number of foreign banks operating in Portugal has changed from 12 in 1990 to 16 by the end 2000.
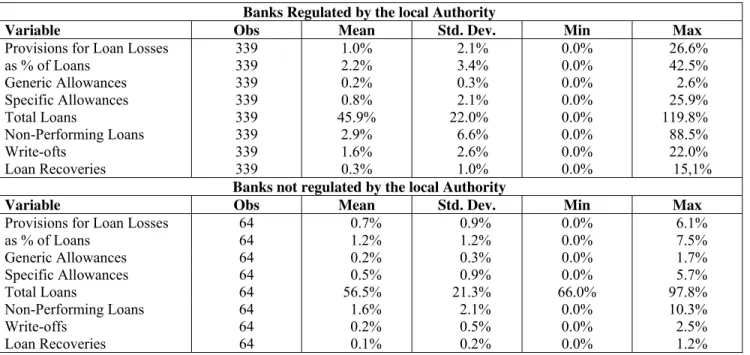
Table 1 presents the summary statistics for a selected group of variables. Outstanding loans represent on average 47% of the total assets. This ratio is lower than the 60% value found in Kim and Kross (1998) for a sample of US banks. However, for the present database, this percentage has changed in time, increasing from around 45% in the mid-1990s to 52% in 2000. In our sample loan loss provisions are on average 0.9% of the total assets for the total number of banks, while in the US it is around 0.6%, as highlighted in Kim and Kross (1998). For the present sample, non-performing loans are on average 2.5% of total assets and vary during the sample period. The write-offs are, on average 1.3% of the total assets and for the US, non-performing loans vary between 0.08% and 2%, depending on the sample period and whether the financial institution is a low or high capitalized bank as found in Kim and Kross (1998).
Table 1: Statistics on Provision Allowances and Outstanding Loans
Banks Regulated by the local Authority
Variable Obs Mean Std. Dev. Min Max
Provisions for Loan Losses 339 1.0% 2.1% 0.0% 26.6%
as % of Loans 339 2.2% 3.4% 0.0% 42.5%
Generic Allowances 339 0.2% 0.3% 0.0% 2.6%
Specific Allowances 339 0.8% 2.1% 0.0% 25.9%
Total Loans 339 45.9% 22.0% 0.0% 119.8%
Non-Performing Loans 339 2.9% 6.6% 0.0% 88.5%
Write-ofts 339 1.6% 2.6% 0.0% 22.0%
Loan Recoveries 339 0.3% 1.0% 0.0% 15,1%
Banks not regulated by the local Authority
Variable Obs Mean Std. Dev. Min Max
Provisions for Loan Losses 64 0.7% 0.9% 0.0% 6.1%
as % of Loans 64 1.2% 1.2% 0.0% 7.5%
Generic Allowances 64 0.2% 0.3% 0.0% 1.7%
Specific Allowances 64 0.5% 0.9% 0.0% 5.7%
Total Loans 64 56.5% 21.3% 66.0% 97.8%
Non-Performing Loans 64 1.6% 2.1% 0.0% 10.3%
Write-offs 64 0.2% 0.5% 0.0% 2.5%
Loan Recoveries 64 0.1% 0.2% 0.0% 1.2%
4. The Regulatory Model of Loan Loss Provisions
4.1 Regulatory DeterminantsAt this stage we must make a clear distinction between provision stocks and flows. The regulators sets up rules for the stocks of provision allowances, i.e., those that figure on the banks’ balance sheets. However, in this and most other studies on bank provisions, we shall focus on provision flows, i.e., provision expenses. In order to relate the two, i.e., to establish the relationship between regulatory requirements and their impact on the banks’ reported provision allowances, we specify the relevant accounting relations and incorporate them in the model.
The dynamics of the stock of provision allowances is, by accounting definition, given by:
StockProvit = StockProvit-1 + LLPit - PRECit – PWOit (1)
where StockProvit represents the stock of provisions allowances of bank i at year t, LLPit is the provision for loan losses expense (the flow), PREC is the stock of provision allowances cancelled out due to loan recoveries (REC), while PWO is the stock of provision allowances cancelled out due to loan write-offs (WO).
Equation (1) above describes the dynamics of the provision allowances 12. This figure is affected by additions of new non-performing loans, which have a direct impact on StockProv via LLP. Additionally, a loan write-off implies a reduction in StockProvt via the simultaneous writing-off of the loan and its corresponding provision (PWO). Similarly, a loan recovery implies a reduction of StockProvt via a reduction in this account corresponding to the value of the provisions directly related to the loan recovered (PREC). Thus, both write-offs and recoveries imply a direct reduction of the stock of provisions, while new provision allowances have the opposite effect.
According with the described regulatory framework, the value of the bank’s stock of provisions is, at each moment, a function of the total outstanding loans (LOAN) and the total stock of non-performing loans (NPL). The first variable should influence, primarily, generic provisions, while the second would be more relevant for specific provisions. The regulator requires banks to provision for non-performing loans according to the time the loan is due and whether the loan is guaranteed by collateral.
Taken together, these factors suggest that we may model the required stock of provision allowances as:13
StockProv = α0+ α1NPL + α2LOAN + α3durNPL + α4COLL + υ (2) where the variable COLLit corresponds to the total collateral coverage on the loan portfolio issued by bank i by the end of year t and is measured as the ratio of collateral received divided by the amount of outstanding loans while durNPLit measures the average duration on default of the bank’s non-performing loans. The usual white noise residual is also added.
Usually, WO coincides with the actual outstanding principal of written-off loans, since these are usually fully provisioned. However, the value that is reported by the banks in the balance sheet data might also include a fraction for which the bank may not have totally provisioned 14. However, since we do observe WO, but not PWO, we formally approximate PWO = δWO, with 0 ≤ δ ≤ 1. As for recoveries, they relate not only to loans that have been fully or partially provisioned, but also to loans that have already been written-off.
Taking first differences in (2) and combining with (1), we get the following relation for LLP:
LLPit = α0 + α1ΔNPLit+ α2ΔLOANit + α3ΔdurNPLit + α4ΔCOLLit + PRECit+ δWOit+ υit (3) Therefore, according to this regulatory model, provision expenses should depend upon the change in non-performing loans (ΔNPL), the change in total loans outstanding (ΔLOAN), the change
12
In this paper we use “provision allowances”, “cumulative provisions” and “stock of provisions” inter-changeably. We refer to the period’s addition (flow) to provision allowances as “provision expenses”.
13
In the next section we consider an alternate model to this specification, namely a non-linear relation between the cumulative provisions and the non-performing loans
14
in the average “duration” of loans with overdue payments (ΔdurNPL), change in the level of loan guarantees (ΔCOLL), provisions cancelled out due to loan recoveries (PREC) and loan write-offs (WO). This last effect is more complex than it appears. A loan write-off has two impacts on the above equation: it implies a reduction of NPL, thus a negative impact on α1ΔNPL, and a similar positive
impact on PWO, thus leaving LLP unaffected.
Under the described regulatory framework, α2 relates to the required generic provision allowances, and should exceed the minimum requirement set by the regulatory authorities. The coefficient α1 represents the level of specific provision allowances defined by the bank, which is also affected by the average duration of its overdue loans via α3 and α4 represents the impact on specific provisions of the bank’s collateral coverage of problem loans. An alternate specification to deal with this last issue is presented in a later section.
The reader should note that because of write-offs and recoveries, the yearly net additions to the bank’s non-performing loans exceed the value of ΔNPL. For example, a massive write-off usually implies a negative value for that variable, resulting in a decrease of the book value of NPL. The figure for new bad loans is in fact the sum ΔNPL+REC+WO. These facts may help the reader to gain a better understanding of equation (3).
4.2. Determinants of Discretionary Behaviour
The model presented in the previous section provides a structural framework that determines the level of provisions under this particular regulatory environment. In addition to this set-up, banks have some discretion in setting their provision expenses. This happens not only because the regulatory percentages for allowances represent minimum values that may be exceeded, but also because banks may have the incentive to manage their reported income and / or capital position, on which provisions may have an important impact. In this section we assume that the actual level of bank provision expenses may be influenced by additional factors, usually designated as management discretionary motives.
In order to determine whether the observed loan loss provisions (LLP) expenses are determined by unexpected managers’ discretionary actions, namely income smoothing or capital management behaviour, the level of LLP is modelled as a function of the regulatory provisions described in (3), hereinafter labelled LLPR, as well as the managers’ discretionary factors, according to:
LLPit = LLPRit + γ1StockProvit-1 + γ2EBTit + γ3CAPit + γ4PRECit + γ5WOit + vit (4) In the equation, EBT represents earnings before provisions and taxes, CAP is a measure of primary capital that is defined as the sum of equity and subordinated debt and v is a white noise residual.
If managers smooth reported earnings through an active management of provisions we should expect the coefficient γ2 to be positive, as a consequence of a “low earnings - low provision expense” policy.
For capital management there are two conflicting views. Ahmed et al. (1999), among other authors, expect γ3 to be negative, arguing that since provisions are classified as capital, when the bank has insufficient capital managers will increase the provision allowances in order to comply with capital regulations. We do not share this view. As observed in Kim and Kross (1998), when the bank discretionarily increases its provision allowances via increase in provision expenses, it is reducing its profits, which are also part of bank capital. However, by provisioning, the bank is reducing its taxes, thus the net effect of increasing provisions is a reduction in taxes, which only leads to a small increase in bank capital.
never set up provisions above that level since provisioning, under this context, leads to lower capital, via lower profits. That being the case, we should observe a positive γ3.
Other than the managers’ discretionary decision, other factors may smooth the provision level and we should account for these effects in the empirical model. As an example, if the financial institution has a high stock of provisions at the beginning of the year (StockProvit-1), other things equal, it is more likely that current year’s provisions would be lower and we expect the coefficient γ1 to be negative (as highlighted in Wetmore and Brick, 1994). In a similar way, Wahlen (1994) finds that financial institutions may use the fact that investors use past provisions policies to generate expectations about future provision decisions.
Finally, the level of recoveries and write-offs may also influence discretionary provisions. In particular, the bank may interpret an increase of the former as a signal of improving credit conditions, leading it to make lower generic provisions.
Decomposing LLPR according to the specification in (2) and incorporating it in (4), the empirical model jointly estimates the regulatory and discretionary effects:
LLPit = α0 + α1ΔNPLit + α2ΔLOANit + α3ΔdurNPLit + α4ΔCOLLit + (1+γ4) PRECit+ (δ+γ5)WOit+γ1StockProvit-1+ γ2EBTit + γ3CAPit + γ4PRECit + γ5WOit + εit (5) For1990-2001 there was a change in generic provisions requirements. For 1990-1994, banks regulated by local authorities were required to hold generic provisions at the minimum amount of 2% of the total value of loans. Starting in 1995, the minimum requirement changed to 1%. As a consequence, we consider a dummy variable (D95), with value 1 if the year is 1995 and 0 otherwise. With the change in the regulatory requirements, the bank can benefit from the reduction in the 1995 minimum provision allowances and reduce the loan loss provision expenses for 1995. The reduction in the minimum requirements may additionally affect the banks’ provisioning policy and therefore the relation between provision expenses, total loans and non-performing loans. Thus, we additionally considered the dummy variable D90-94 which assumes value 1 for 1990-1994 and 0 otherwise. The model described in (5) becomes:
LLPit = α0+β1D95 + (α1+ β2D90-94) ΔNPLit + (α2+ β3D90-94) ΔLOANit + α3ΔdurNPLit +
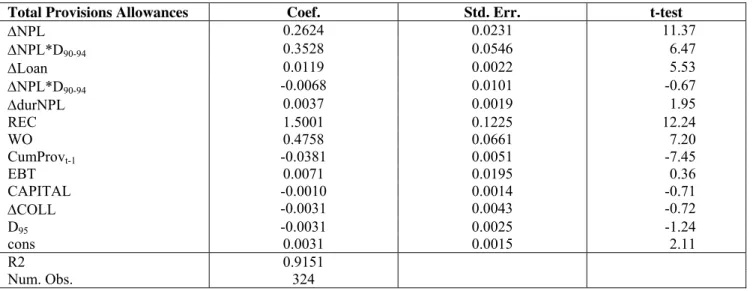
Table 2: Regression Results for Yearly Total Provisions
Total Provisions Allowances Coef. Std. Err. t-test
ΔNPL 0.2624 0.0231 11.37
ΔNPL*D90-94 0.3528 0.0546 6.47
ΔLoan 0.0119 0.0022 5.53
ΔNPL*D90-94 -0.0068 0.0101 -0.67
ΔdurNPL 0.0037 0.0019 1.95
REC 1.5001 0.1225 12.24
WO 0.4758 0.0661 7.20
CumProvt-1 -0.0381 0.0051 -7.45
EBT 0.0071 0.0195 0.36
CAPITAL -0.0010 0.0014 -0.71
ΔCOLL -0.0031 0.0043 -0.72
D95 -0.0031 0.0025 -1.24
cons 0.0031 0.0015 2.11
R2 0.9151
Num. Obs. 324
Generally, the bank’s provision policy comprehends the simultaneous decision of the amount of generic and specific provisions. In the empirical specification described in (6), we should thus consider two separate equations, one for each type of provision allowance that should be simultaneously estimated using a seemingly unrelated regression system.15 In this new empirical set-up, the variables PREC and StockProv refer to the particular provision allowances considered. In that case, the following equations are then estimated using the Zellner technique:
LLPitG = α0G+β1GD95 + (α1G+ β2GD90-94) ΔNPLit + (α2G+ β3GD90-94) ΔLOANit+α3GΔdurNPLit+
α4GΔCOLLit+(1+γ4G)PRECGit+ (δG+γ5G)WOGit
+γ1GStockProv it-1+ γ2GEBTit + γ3GCAPit + ε it (7a) LLPitS = α0S + α1SΔNPLit + α2SΔLOANit + α3SΔdurNPLit + α4SΔCOLLit + (1+γ4S)PRECSit +
(δS+γ5S)WOSit +γ1SStockProv it-1+ γ2SEBTit + γ3SCAPit + ε it (7b) where G and S denote generic and specific provisions, respectively.
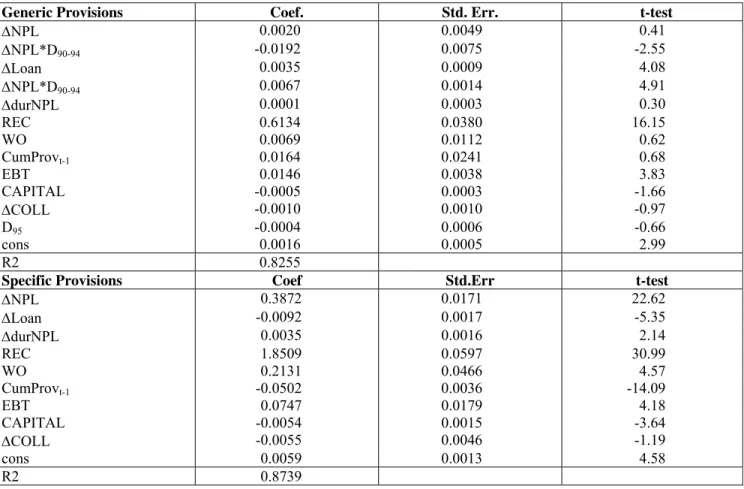
Table 3 presents the results. We find that each type of provision has its own particular determinants. As expected, generic provision expenses are mainly determined by the variation of total loans outstanding, whose coefficient was higher in the period before 1995. Additionally we find γ4G to be negative, thus meaning that an increase in recoveries leads to a reduction of generic provisions expense.
15
Table 3: Estimation Results of the SUR Model - all banks
Generic Provisions Coef. Std. Err. t-test
ΔNPL 0.0020 0.0049 0.41
ΔNPL*D90-94 -0.0192 0.0075 -2.55
ΔLoan 0.0035 0.0009 4.08
ΔNPL*D90-94 0.0067 0.0014 4.91
ΔdurNPL 0.0001 0.0003 0.30
REC 0.6134 0.0380 16.15
WO 0.0069 0.0112 0.62
CumProvt-1 0.0164 0.0241 0.68
EBT 0.0146 0.0038 3.83
CAPITAL -0.0005 0.0003 -1.66
ΔCOLL -0.0010 0.0010 -0.97
D95 -0.0004 0.0006 -0.66
cons 0.0016 0.0005 2.99
R2 0.8255
Specific Provisions Coef Std.Err t-test
ΔNPL 0.3872 0.0171 22.62
ΔLoan -0.0092 0.0017 -5.35
ΔdurNPL 0.0035 0.0016 2.14
REC 1.8509 0.0597 30.99
WO 0.2131 0.0466 4.57
CumProvt-1 -0.0502 0.0036 -14.09
EBT 0.0747 0.0179 4.18
CAPITAL -0.0054 0.0015 -3.64
ΔCOLL -0.0055 0.0046 -1.19
cons 0.0059 0.0013 4.58
R2 0.8739
Looking at the specific provisions regression, the change in non-performing loans, the value of loan write-offs and recoveries are among the major determinants. Almost 40% of net additions to non-performing loans are immediately subject to provisioning. The low coefficient (less than 1), associated with the loan write-offs, may be associated with a low value for δ (thus indicating a higher than expected percentage of written-of loans that are not fully-provisioned). For the recoveries, the coefficient exceeds 1, which is an indication that recoveries have a positive influence on discretionary specific provisions.
We find that both types of provisions are affected by income-smoothing practices, a finding only uncovered after separating the estimation for the two types of provisions. The variable EBT has positive and statistically significant coefficients in both equations. A one-unit increase in the net earnings before provisions leads to a 1.46% increase in the level of generic provisions and 7.47% of specific’s. With respect to the latter, results also support the capital management hypothesis, with higher capitalization resulting in lower specific provisioning.
As highlighted in Table 3, we observe that the change in non-performing loans, the main driver of specific provisions, has a negative impact on the generic provisions in the period before 1995. This intriguing result apparently means that banks reacted to the “over-provisioning” requirements of the 1990-1994 period by reducing their discretionary yearly contributions for generic provisions every time that they had to increase their contributions to specific alowances. We designate this practice as a substitution effect between generic and specific provisions. This effect could not be observed when the two types of provisions were handled as a mere sum.
provision policies. As a consequence, we also estimated (7) considering separately the sample for both sub-groups. Tables 4 and 5 present the results for the sub-samples of domestically regulated and foreign-regulated banks, respectively.
Looking at tables 4 and 5, we observe distinct behaviours depending on whether banks are domestic or foreign-regulated. For the former, most results are in line with these of the pooled sample. Table 5 reveals that for foreign banks the impact of the change in total loans on the level of specific provisions is negative but not significant, suggesting that there is no such substitution effect for foreign-regulated banks. This result is in contrast to what is found for the domestic-regulated banks (Table 4). Being subject to stricter provisioning requirements, domestic-regulated banks decrease the level of specific provisions by 0.9% upon an increase in the level of total loans. Simultaneously, and in particular for 1990-1994 an increase in the level of non-performing loans decreases the amount of generic provisions by 1.79%. Together, these effects present evidence of a substitution effect between generic and specific provisions for domestic banks. We also find strong evidence that these banks use both types of provisions to smooth the level of reported earnings. However, for the foreign-regulated, such practice is found for generic provisions only.
Table 4: Estimation Results of the SUR Model - Domestic Banks
Generic Provisions Coef. Std. Err. z
ΔNPL 0.0013 0.0052 0.25
ΔNPL*D90-94 -0.0179 0.0079 -2.26
ΔLoan 0.0037 0.0009 4.03
ΔNPL*D90-94 0.0071 0.0015 4.82
ΔdurNPL 0.0003 0.0004 0.88
REC 0.6237 0.0402 15.5
WO 0.0038 0.0116 0.33
CumProvt-1 0.0182 0.0270 0.67
EBT 0.0134 0.0040 3.37
CAPITAL -0.0005 0.0003 -1.44
ΔCOLL -0.0012 0.0011 -1.11
D95 -0.0001 0.0007 -0.15
cons 0.0018 0.0006 2.92
R2 0.8423
Specific Provisions Coef. Std. Err. z
ΔNPL 0.3895 0.0185 21.06
ΔLoan -0.0090 0.0018 -4.89
ΔdurNPL 0.0038 0.0019 1.97
REC 1.8473 0.0637 28.89
WO 0.2016 0.0503 4.01
CumProvt-1 -0.0500 0.0038 -13.15
EBT 0.0763 0.0193 3.95
CAPITAL -0.0056 0.0016 -3.49
ΔCOLL -0.0065 0.0051 -1.29
cons 0.0065 0.0015 4.36
Table 5: Estimation Results of the SUR Model - Foreign Banks
Generic Provisions Coef. Std. Err. Z
ΔNPL 0.0051 0.0121 0.42
ΔLoan 0.0045 0.0017 2.73
ΔdurNPL -0.0001 0.0004 -0.33
REC 0.1449 0.1025 1.41
WO -0.0583 0.0410 -1.42
CumProvt-1 0.0021 0.0430 0.05
EBT 0.0221 0.0105 2.10
CAPITAL -0.0068 0.0031 -2.17
ΔCOLL -0.0068 0.0046 -1.40
cons 0.0021 0.0008 2.61
R2 0.4412
Specific Provisions Coef Std. Err. z
ΔNPL 0.4161 0.0529 7.86
ΔLoan -0.0042 0.0061 -0.68
ΔdurNPL 0.0041 0.0017 2.36
REC 0.7850 0.5038 1.56
WO 0.3796 0.1670 2.27
CumProvt-1 0.3508 0.1092 3.21
EBT 0.0634 0.0415 1.53
CAPITAL -0.0133 0.0133 -1.00
ΔCOLL -0.0094 0.0177 -0.53
cons -0.0022 0.0039 -0.57
R2 0.6967
We also observe that the level of recoveries significantly explain the level of provisions for the domestic banks, while it is not relevant for the foreign-regulated ones. Finally, our results show a negative relation between capital and provisioning levels, which is in accordance with what is documented in Kim and Kross (1998) for the US. We find evidence of capital management for specific provision policy among domestic-regulated banks. However, the coefficient is negative, meaning that banks with lower capital have higher provisioning allowances, a fact difficult to explain under the Portuguese regulatory environment.
In summary, the change in the regulatory requirements determined modifications in the domestic-regulated banks provisioning policy. Prior to 1995, we observe a significant negative effect for the change in non-performing loans in the level of generic provisions and a moderate negative effect of the change in loans in the level of specific provisions. Both results suggest that the higher-provisioning regime of the 1990-1994 period may have induced domestic-regulated banks to take recourse to the substitution effect between generic and specific provisions documented above. This result does not hold for the 1995-2000 period. Interestingly, we don’t find evidence of a similar substitution effect across the sample of foreign banks which are generally subject to less demanding provisioning regulatory environment.
5. Conclusions
In this paper we studied the determinants of generic and specific provisions in Portuguese banking. We developed a structural model that accounts for the relationship between stocks and flows of provisions, the regulatory requirements for allowances and the determinants of discretionary provisioning for the two classes of provisions.
we associate with different home-country regulatory environments. In particular this separation, not common in the literature, unveils some discretionary behaviour that did not emerge when the two types of provisions were taken as a whole. Additionally, we present evidence suggesting that provisioning policy also differs among the two types of provisions.
We find, rather unsurprisingly, that specific provisions are mainly determined by the amount of non-performing loans, loan write-offs and recoveries. The latter seems particularly important and corresponds to adjustments in the stock of non-performing loans but also to discretionary behaviour. The parameters associated with write-offs and recoveries differ from what should be expected from our model describing the regulatory requirements for this type of provision, thus indicating discretionary behaviour in provisioning policies. This conclusion is reinforced by the evidence supporting the income-smoothing and capital management hypotheses for the two groups of banks.
We also find, as expected, that generic provisions are mainly explained by the amount of loans outstanding. For this type of provision income-smoothing is detected for both groups of banks while capital management practices are also found for the foreign-regulated ones. Additionally, we find that these foreign banks tend to incorporate in their behaviour the previous year’s stock of provision allowances, in what is sometimes called a dynamic provisioning policy.
References
[1] Ahmed A., C. Takeda and S. Thomas (1999) “Bank Loan Loss Provisions: A Reexamination of Capital Management, Earnings Management and Signaling Effects”, Journal of Accounting and Economics, 28, pp. 1-25
[2] Basel Committee on Banking Supervision (1999) “Sound Practices for Loan Accounting and Disclosure”, Task Force on Accounting Issues of the Basel Committee on Banking Supervision, Bank of International Settlements
[3] Beaver, William H. and Ellen E. Engel (1996), “Discretionary Behavior with Respect to Allowance for Loan Losses and the Behavior of Securities Prices”, Journal of Accounting and Economics 22, pp. 177-206.
[4] Borio, Claudio and Philip Lowe (2001), “To Provision or not to Provision”, BIS Quarterly Review, September 2001, pp.36-48.
[5] Bhat V. (1996).Banks and Income Smoothing: An Empirical Analysis., Applied Financial Economics, 6, pp 505-510.
[6] Hoggarth, Glenn. and Darren Pain (2002) “Bank Provisioning: the UK experience”, Financial Stability Review, Bank of England, June, pp. 116-127.
[7] Jackson, P. (1999) “Capital Requirements and Bank Behaviour: The Impact of the Basel Accord”, Basel Committee Working Paper, 1.
[8] Kanagaretnam, K., Gerald J. and Robert Mathieu (2001). “Managerial Incentives for Income Smoothing through Bank Loan Loss Provisions”, Social Science Research Network Working Paper.
[9] Kim and Kross (1998) “The impact of the 1989 change in bank capital standards on loan loss provisions and loan write-offs”, Journal of Accounting and Economics, 25, pp. 69-99.
[10] Lis, Santiago F., Jorge M. Pagés and Jesús Saurina (2000), “Credit Growth, Problem Loans and Credit Risk Provisioning in Spain”, Banco de Espana Working Paper n.o 18
[11] Lobo, Gerald J. and Dong-Hoon Yang (2001) “Bank Managers’ Heterogeneous Decisions on Discretionary Loan Loss Provisions”, Review of Quantitative Finance and Accounting, 16, pp. 223-250.
[12] Pinho, Paulo S. (1996), “An Empirical Analysis of the Determinants of Provisions for Loan Losses in Portuguese Banks”, Economia, pp. 56-65
[13] Wetmore J. and J. Brick (1994) “Loan-Loss Provisions of Commercial Banks and Adequate Disclosure: A Note”, Journal of Economics and Business, 46, pp. 299-305.