Diagnostic accuracy of anthropometric
indices in predicting excess body fat among
seven to ten-year-old children
Acurácia diagnóstica de índices antropométricos na predição do
excesso de gordura corporal em crianças de sete a dez anos
Edineia Aparecida Gomes RibeiroI,Danielle Biazzi LealI,II,Maria Alice Altenburg de AssisI,III
IPrograma de Pós-graduação em Educação Física, Universidade Federal de Santa Catarina – Florianópolis(SC), Brasil. IIFaculdade de Educação Física, Universidade do Estado de Santa Catarina – Florianópolis (SC), Brasil.
IIIDepartamento de Nutrição, Universidade Federal de Santa Catarina – Florianópolis (SC), Brasil.
Corresponding author: Maria Alice Altenburg de Assis. Universidade Federal de Santa Catarina, Departamento de Nutrição. Campus Universitário, Trindade, CEP: 88040-970, Florianópolis, SC, Brasil. E-mail: [email protected]
Conlict of interests: nothing to declare – Financial support: Santa Catarina Research Foundation (FAPESC, process number 062/2002).
AbstrAct:Purpose: To evaluate the accuracy of the body mass index (BMI), waist circumference (WC) and waist-to-height ratio (WHtR) in detecting excess body fat among schoolchildren in Florianópolis, Santa Catarina. Methods: Cross-sectional study with 2,772 schoolchildren aged seven to ten years. Receiver Operating Characteristic (ROC) curves were used to compare the diagnostic accuracy of the BMI, the WC and the WHtR in identifying children with excess body fat (deined as values that were equal to or higher than the 90th percentile
of the standardized residuals obtained from the sum of the four skinfolds thickness). Likelihood ratio estimates were used to select, for each anthropometric index, the cut-of points that presented the highest association with excess body fat. Results: The BMI, WC and WHtR performed well in detecting excess body fat, indicated by areas under the ROC curve (AUC) close to 1.0, with slightly higher AUC for the BMI in comparison to the WC and the WHtR concerning both sexes. Highly sensitive and speciic cut-of points were derived for the three anthropometric indices. Sensitivity ranged from 85.7 to 92.9% for the BMI, from 78.6 to 89.7% for the WC, and from 78.6 to 89.2% for the WHtR. Speciicity ranged from 83.2 to 91.4%, from 75.0 to 90.7%, and from 77.4 to 88.3% for the BMI, the WC and the WHtR, respectively. Conclusion: BMI, WC and WHtR can be used as diagnostic tests to identify excess body fat in children from seven to ten years of age.
Keywords: Child. Adiposity. Body Mass Index. Waist circumference. Abdominal obesity. Test validity.
INTRODUCTION
Adequate diagnoses of weight excess in children and adolescents and early intervention are important aspects in reducing the risk of diseases related to obesity in adulthood. Since obesity is linked to adiposity as well as to risks to health1, the precision of anthropometric
adiposity indices must be evaluated based on their capacity to detect excessive body fat or harmful efects to an individual’s health. Although the adverse efects of weight excess on health are considered as resulting from excessive body fat, due to the easiness to conduct this measurement and the simplicity to obtain its components, simple and reproducible techniques — such as the body mass index (BMI) and circumference indices — have been extensively utilized as the proxy for adiposity. The most adequate methods to measure body fat, such as dual-energy X-ray absorptiometry (DEXA) and hydrostatic weighing, are very complex and expensive, in addition to being generally limited to small-scale studies2. For
this reason, in some population studies, body mass has been measured by skinfold thickness and used to validate the capability of simpler anthropometric indices (for instance, BMI and waist circumference [WC]) to diagnose body adiposity.
Systems of classification of the nutritional status of children and adolescents have been recommended by the International Obesity Task Force (IOTF)3 and by the World Health Organization4,
based on the BMI for each age range. National systems are also noteworthy, such as the one devised
resumO:Objetivo: Avaliar a acurácia do índice de massa corporal (IMC), circunferência da cintura (CC) e razão cintura-estatura (RCEst) no diagnóstico do excesso de gordura corporal em escolares de Florianópolis, Santa Catarina. Métodos: Estudo transversal com 2.772 escolares de sete a dez anos. Curvas ROC (Receiver Operating Characteristic) foram utilizadas para comparar a acurácia diagnóstica do IMC, CC e RCEst na identiicação de crianças com excesso de gordura corporal (deinido como valores iguais ou superiores ao percentil 90 do resíduo padronizado do somatório de quatro dobras cutâneas). A estimativa da razão de verossimilhança foi utilizada para selecionar, em cada índice antropométrico, o ponto de corte de maior associação com o excesso de gordura corporal.
Resultados: O IMC, a CC e a RCEst obtiveram bom desempenho na detecção do excesso de gordura corporal, indicado por áreas sob a curva (ASC) ROC próximas a 1,0, com uma ASC um pouco maior para o IMC do que para a CC e RCEst em ambos os sexos. Para os três índices antropométricos, pontos de corte altamente sensíveis e especíicos foram derivados. A sensibilidade variou de 85,7 a 92,9% para o IMC, de 78,6 a 89,7% para a CC e de 78,6 a 89,2% para a RCEst. A especiicidade variou de 83,2 a 91,4%, de 75,0 a 90,7% e de 77,4 a 88,3% para o IMC, CC e RCEst, respectivamente. Conclusão: O IMC, a CC e a RCEst podem ser usados como teste diagnóstico para identiicar o excesso de gordura corporal em crianças de sete a dez anos.
DiAGnostic AccuRAcy of AnthRopometRic inDices in pReDictinG
excess body fat among seven to ten-year-old children
for the Brazilian population5. One of the limitations of these BMI-based systems is the fact that this
index is an indirect measurement of adiposity that expresses the sum of all body weight components (lean body mass, bones, adipose tissue), without distinction between lean and fat mass6. Furthermore,
the BMI varies according to age, sex, body composition and sexual maturity stages7.
Owing to the limitations of the BMI, the use of WC and waist-to-height ratio (WHtR) has been suggested to evaluate adiposity. In studies with children and adolescents, authors have observed a signiicant association between cardiovascular risk factors and WC8,9. The latter has
been defended as a more precise indicator of visceral adipose tissue and of health risks related to obesity in comparison to the BMI10. However, because there are no speciic critical values for the
Brazilian population or internationally accepted values to classify abdominal adiposity in children and adolescents, the use of WC and its recommendation in public health have been limited.
WHtR incorporates WC as a measurement of abdominal adiposity and adjusts it to the individual’s size by dividing it by his/her height11. In studies carried out with children, WHtR
has been indicated as a better risk predictor than BMI or WC for health outcomes8,12. In spite of
the large number of studies published on the prevalence of excess weight among children and adolescents, there are still controversies about the best indicator of excess body fat to be used. In the present study, our purpose is to analyze the diagnostic accuracy of the BMI, WC and WHtR in tracking excess body fat determined by skinfold thickness in seven to ten-year-old children. In addition, we identiied the cut-of points of the three anthropometric indices that presented a more marked association with body fat excess.
METHODS
Sample
This is a cross-sectional population-based study conducted from September to November, 2002. We used data containing the complete information of a probabilistic sample of seven to ten-year-old students, enrolled in elementary schools in the city of Florianópolis, Santa Catarina. Details pertaining to the sample are available in other publications13,14.
In summary, a representative sample of students enrolled in the irst to fourth grades of elementary schools in the city in question was selected from a sample stratiied by clusters. The information included anthropometric data (body mass, height, skinfolds and arm, waist and hip circumference) and familial socioeconomic data. The present study only addresses measurements of the children’s body mass, height, WC, and four skinfolds (triceps, subscapular, suprailiac and medial calf ).
this study, which was approved by the Ethics Committee of Universidade Federal de Santa Catarina (report number 037/02).
anthropometric meaSurementS
The administrative department of each school provided information about the children’s age and sex. The BMI, WC, WHtR and the sum of the four skinfolds thickness (SFT) were selected to assess the participants’ nutritional status. The anthropometric measurements were taken in the schools selected by two Physical Education teachers who were trained by an experienced anthropometrist so as to ensure technique standardization. The anthropometric measurements were conducted with the children barefoot and wearing light clothes, using standardized techniques recommended by Lohman et al.15. Their body mass was measured by means of a
portable digital scale with capacity for up to 180 kg (MARTE®, model PP), and the height was
taken with a measuring tape attached to a wall without a baseboard. The BMI was calculated as body mass (in kg) divided by squared height (in meters). WC (cm) was measured at the middle point between the last rib and the upper edge of the iliac crest (natural waist) with a non-elastic tape. WHtR was determined by the ratio between WC (cm) and height (cm).
The skinfolds were measured in four locations of the individuals’ bodies: triceps, subscapular, suprailiac and medial calf using a skinfold compass (CESCORF®, Scientiic Sports Equipment,
Porto Alegre, Rio Grande do Sul, Brazil) on the right side of the body. The measurements were taken twice and a third time when the skinfolds difered in more than 1mm. The average of the measurements in each location or of the two most approximate readings was used in the analysis.
Due to the importance of age in body fat variation, SFT values were modeled as a polynomial function of age (age in completed years, age squared and age cubed) in linear regression models weighted by the inverse of the variance. Using the model with the highest Pearson’s coeicient (R2), we estimated the standardized residuals (variation of the skinfolds,
regardless of the linear efect of age) for each sex. Values that were higher than ± 4 standard deviations of the standardized residuals were excluded (73 boys, 91 girls), resulting in a inal sample of 2722 children (51,6% boys). The non-conventional value of ± 4 standard deviations was chosen to preserve the sample’s heterogeneity as much as possible. The values from the sum of skinfolds (standardized residuals) that were equal to or higher than the 90th percentile
were adopted as the reference measurement to classify excess body fat. The absolute values of the BMI, WC and WHtR were standardized according to the individuals’ sex and age, and converted into Z scores so as to be utilized in the analyses as diagnostic tests.
StatiStical analySiS
DiAGnostic AccuRAcy of AnthRopometRic inDices in pReDictinG
excess body fat among seven to ten-year-old children
the diferences of the areas under the curve (AUC) Receiver Operating Characteristic (ROC) among the anthropometric indices, we observed the superposition of conidence intervals of 95% (95%CI).
The analysis of the ROC curve was conducted to evaluate the overall performance of the BMI, WC and WHtR in detecting excess body fat. The AUC was used as a global measurement of accuracy of the BMI, WC and WHtR in screening excess body fat. AUCs may vary between 0 and 1; values higher than 0.5 indicate that the selected tool is better than random classiication, and 1 implies a perfect performance.
In order to determine the BMI, WC and WHtR values that were more closely associated with excess body fat, referred to as optimal cut-off points from this point on, we calculated positive [sensitivity/(1-specificity)] and negative likelihood ratio [(1-sensitivity)/specificity] of these anthropometric indices for each age and sex. Likelihood ratios (LRs) shows how many times it is more (or less) probable that a test result will be found in sick people compared to individuals who do not present the same illness. In the context of the present study, LRs indicate how many times the results of the BMI, WC and WHtR are more likely to be found in individuals with excess body fat in relation to those without it.
Positive likelihood ratio (+LR) higher than 10 and negative likelihood ratio (-LR) lower than 0.01 have yielded diagnoses with convincing evidence, whereas values above 5.0 and below 0.2 indicate moderate diagnosis evidence(17,18). In the present study, the selection of
optimal cut-of points was carried out in search of an average value for the BMI, WC and WHtR among participants who showed +LR between 5 and 10, and – LR between 0.1 and 0.2 — according to age and sex — in other words, cut-of points that would potentially yield moderate diagnoses of excess body fat.
The probability of identifying excess body fat in children diagnosed as being or not being excess weight (according to optimal BMI cut-of points) and as having or not having excessive abdominal adiposity (according to optimal WC and WHtR cut-of points) was calculated through the equation18 Post-test odds = Pre-test odds x Likelihood ratio (+LR or -LR), in
which Pre-test odds = Prevalence/1-Prevalence.
To calculate the Pre-test odds, we used the prevalence of excess body fat based on the sample’s SFT 90th percentile (standardized residuals), according to sex and age. Finally, the values of the Post-test odds were converted into probabilities: Post-test probability = Post-test odds/1 + Post-test results.
The diagnostic accuracy of the anthropometric indices in identifying excess body fat was determined by the ROC AUC, and the diagnostic accuracy of the optimal cut-of points of these indices was determined by sensitivity, speciicity, +LR, -LR, positive post-test probability (PPP) and negative post-test probability (NPP).
RESULTS
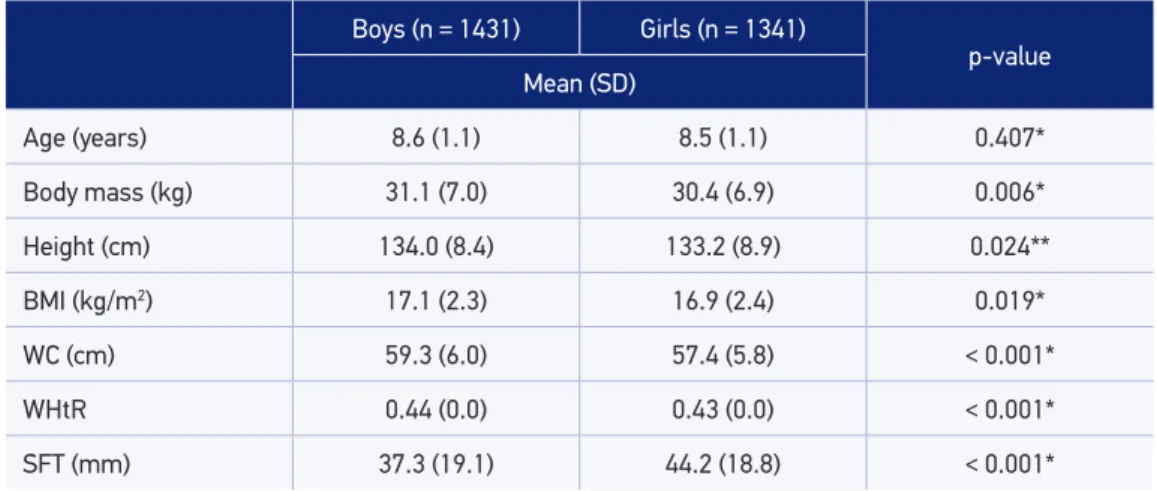
The sample’s anthropometric characteristics are displayed on Table 1. Compared to the girls, the boys were signiicantly taller, heavier, and presented higher averages of BMI, WC and WHtR. On average, the girls presented higher statistically signiicant SFT values than the boys.
Figure 1 shows the performances of the ROC curves concerning the BMI, WC and WHtR of the boys (a) and girls (b). All anthropometric indices obtained good performances in identifying excess body fat, as indicated by AUC values that are equal to or higher than 0.90. Although the 95%CI did not show statistically signiicant diferences among the indices in regards to the AUC, the BMI performed better in identifying children of both sexes who had excess body fat.
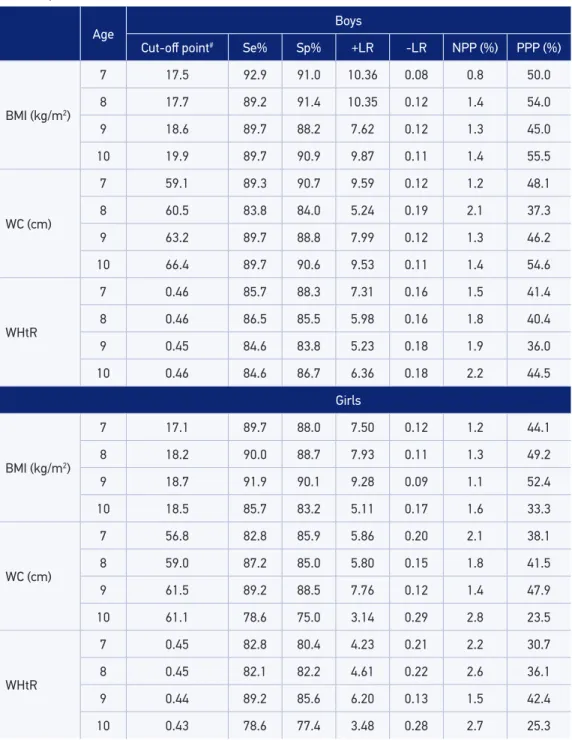
The optimal cut-of points of the BMI, WC and WHtR and their respective +LR and –LR values, as well as sensitivity, speciicity and post-test probability of excess body fat are presented on Table 2. All cut-of points chosen through analyzing the LR showed a balance between diagnosis sensitivity and speciicity. However, the optimal cut-of points of the BMI presented better indices of diagnostic accuracy in identifying excess body fat than the WC and the WHtR. For instance, the data displayed on Table 2 show that a seven-year-old boy with excess body fat is 10.36 times more likely to be classiied as being excess weight by the optimal cut-of points established for the BMI than a boy of the same age without excess body fat. On the other hand, a seven-year-old boy without excess body fat is only 0.08 times more likely to be classiied as being excess weight in comparison to a boy of the same age with excess body fat.
Although we adopted +LR values between 5 and 10, and -LR values between 0.1 and 0.2 when choosing the optimal cut-of points, this combination was not possible for the WHtR in
Table 1. Anthropometric characteristics of the children according to sex. Florianópolis, 2002.
Boys (n = 1431) Girls (n = 1341)
p-value Mean (SD)
Age (years) 8.6 (1.1) 8.5 (1.1) 0.407*
Body mass (kg) 31.1 (7.0) 30.4 (6.9) 0.006*
Height (cm) 134.0 (8.4) 133.2 (8.9) 0.024**
BMI (kg/m2) 17.1 (2.3) 16.9 (2.4) 0.019*
WC (cm) 59.3 (6.0) 57.4 (5.8) < 0.001*
WHtR 0.44 (0.0) 0.43 (0.0) < 0.001*
SFT (mm) 37.3 (19.1) 44.2 (18.8) < 0.001*
*Student’s t-test for equal variances; **Student’s t-test for diferent variances.
diaGnosTiC aCCURaCY oF anTHRopomeTRiC indiCes in pRediCTinG eXCess BodY FaT amonG seven To Ten-YeaR-old CHildRen
the girls’ case. Although the +LR and the -LR of the WHtR cut-of points chosen girls were more modest — 3.48 and 0.28 respectively — they were sui ciently strong to suggest that this cut-of point can be useful in identifying a child with excess body fat.
Overall, the post-test probability of a child classii ed as not being excess weight or without abdominal adiposity presenting excess body fat — as per the optimal BMI, WC and WHtR cut-of points — dropped from 10% (pre-test probability) to 2.2% at the most among the boys, and to 2.8% among the 10-year-old girls. When the test result was positive (a child classii ed as being excess weight or having abdominal adiposity according to optimal BMI, WC and WHtR cut-of points), the probability of a child presenting excess body fat rose to over 36.0% among the boys and to 23.5% among the 10-year-old girls (Table 2).
DISCUSSION
In this study, we compared the diagnostic accuracy of the BMI, WC and WHtR in identifying children with excess body fat (expressed through the sum of each individual’s skinfolds) in a sample of seven to ten-year-old students in the city of Florianópolis. Furthermore, we Figure 1. Receiver Operating Characteristic curves for body mass index, waist circumference and waist-to-height ratio in boys (a) and girls (b) and their corresponding area under the curve.
1.0
1 - Speciicity
0.8
0.6
0.4
0.2
0.0
Sensitivity
BMI WC
WHtR
AUC (95%CI) BMI 0.96 (0.94 – 0.97) WC 0.94 (0.92 – 0.96)
WHtR 0.92 (0.90 – 0.94)
1.0 0.8 0.6 0.4 0.2 0.0
1.0
1 - Speciicity
0.8
0.6
0.4
0.2
0.0
Sensitivity
BMI WC
WHtR
AUC (95%CI) BMI 0.95 (0.94 – 0.96) WC 0.92 (0.90 – 0.94)
WHtR 0.90 (0.87 – 0.92)
1.0 0.8 0.6 0.4 0.2 0.0
A B
Age
Boys
Cut-of point# Se% Sp% +LR -LR NPP (%) PPP (%)
BMI (kg/m2)
7 17.5 92.9 91.0 10.36 0.08 0.8 50.0
8 17.7 89.2 91.4 10.35 0.12 1.4 54.0
9 18.6 89.7 88.2 7.62 0.12 1.3 45.0
10 19.9 89.7 90.9 9.87 0.11 1.4 55.5
WC (cm)
7 59.1 89.3 90.7 9.59 0.12 1.2 48.1
8 60.5 83.8 84.0 5.24 0.19 2.1 37.3
9 63.2 89.7 88.8 7.99 0.12 1.3 46.2
10 66.4 89.7 90.6 9.53 0.11 1.4 54.6
WHtR
7 0.46 85.7 88.3 7.31 0.16 1.5 41.4
8 0.46 86.5 85.5 5.98 0.16 1.8 40.4
9 0.45 84.6 83.8 5.23 0.18 1.9 36.0
10 0.46 84.6 86.7 6.36 0.18 2.2 44.5
Girls
BMI (kg/m2)
7 17.1 89.7 88.0 7.50 0.12 1.2 44.1
8 18.2 90.0 88.7 7.93 0.11 1.3 49.2
9 18.7 91.9 90.1 9.28 0.09 1.1 52.4
10 18.5 85.7 83.2 5.11 0.17 1.6 33.3
WC (cm)
7 56.8 82.8 85.9 5.86 0.20 2.1 38.1
8 59.0 87.2 85.0 5.80 0.15 1.8 41.5
9 61.5 89.2 88.5 7.76 0.12 1.4 47.9
10 61.1 78.6 75.0 3.14 0.29 2.8 23.5
WHtR
7 0.45 82.8 80.4 4.23 0.21 2.2 30.7
8 0.45 82.1 82.2 4.61 0.22 2.6 36.1
9 0.44 89.2 85.6 6.20 0.13 1.5 42.4
10 0.43 78.6 77.4 3.48 0.28 2.7 25.3
Table 2. Cut-of points for body mass index, waist circumference and waist-to-height ratio that presented a more marked association with excess body fat, according to sex and age. Florianópolis, 2002.
Se: sensitivity; Sp: speciicity; +LR: positive likelihood ratio; -LR: negative likelihood ratio; NPP: negative post-test probability; PPP: positive post-test probability; BMI: body mass index; WC: waist circumference; WHtR: Waist-to-height ratio.
DiAGnostic AccuRAcy of AnthRopometRic inDices in pReDictinG
excess body fat among seven to ten-year-old children
determined the cut-of points of the indices which presented a more marked association with excess body fat. The analytical procedures employed enabled us to establish estimates of the probability that the children classiied as being excess weight or not, or as having abdominal adiposity or not, would present excess body fat.
The variation of AUC values (0.90 – 0.96) found in this study indicated that the three anthropometric indices in question achieved good performances in diagnosing excess body fat in children.
In other studies, some authors have suggested that central adiposity measurements are the best tools to identify children and adolescents with cardiovascular risk factors8,19,20. In a
study conducted with French children (6.8 – 11.8 years of age), WC was more consistent in discriminating obesity (determined by measuring skinfold thickness) than the BMI or WHtR21.
However, other authors have reported minimal diferences in the capability of the BMI, WC and WHtR to identify children and adolescents with cardiometabolic risk markers22,23.
The diagnostic accuracy of the BMI, WC and of the waist-to-hip ratio (WHR) in screening obesity was evaluated in 17-year-old Swedish teenagers using plethysmography as a reference measurement. The results showed that the BMI and the WC had better diagnostic performances in screening obesity among the teenagers than the WHR24.
The association between BMI, WC and body composition indices (total and truncal fat and lean mass) was evaluated in black prepubescent children in South Africa. The results showed that the BMI presented a statistically higher signiicant correlation to body composition than WC, and that this association was signiicantly more marked in relation to fat mass than lean mass, thus suggesting that the BMI is a better instrument to screen body fat than WC25. The authors explained this result through the fact that the centralization of body
fat occurs after puberty, and for this reason it was not expected that WC would relect fat centralization prior to the beginning of puberty.
When selecting the best anthropometric index as a tool to triage excess body fat, other authors have also utilized ROC curve analyses, including when determining the cut-of points more closely associated with this outcome21,24,26,27. In these studies, the choice of
the same diagnostic accuracy, diferently than what occurs when one opts for analyzing sensitivity and speciicity maximization for each sex and age.
In the present study, the optimal cut-of points were selected based, irstly, on the chance that a child who was classiied as overweight or as having excessive abdominal adiposity would also present excess body fat; in other words, true positive cases, as tests with high +LR values provide strong evidence for a diagnosis when positive. We also took into consideration a potential low frequency of false negative cases (in the case of the BMI’s cut-of points, this refers to the children classiied as not being overweight, but who had excess body fat nonetheless), as tests with low -LR values are the best to exclude the possibility of illness. In other studies, diferent cut-of points can be chosen, depending on whether minimizing the number of false positive cases in relation to false negatives is deemed more important than the opposite scenario.
In this study, the BMI’s optimal cut-of points for classifying excess weight in children from seven to ten years of age presented lower values than the international recommendation3 for both
sexes and lower values than the Brazilian proposal5 in the case of the boys. This result may indicate
that estimates of overweight prevalence based on the onset of illnesses in adults (exactly like the critical values proposed by Cole et al.3, and Conde e Monteiro5) tend to be more conservative
than the outcomes based on anthropometric indices that point out body fat values of children within a self-same sample.
Children-focused WC reference values are scarce, and this hinders comparisons to the cut-of points determined in this study. In England, McCarthy et al.28 identiied WC cut-of points among
seven to ten-year-old boys and girls that are similar to the ones found in this study. However, the same WC cut-of points indicated in the present study were approximately 4.2 cm smaller for the boys and 6.3 cm smaller for the girls, all between seven and ten years of age, than the average cut-of values suggested in a study carried out with New Zealander children26. Compared to the
study conducted with French children ranging between 6.8 and 11.8 years of age21, the optimal
WC cut-of points to identify excess body fat in the present study were, on average, 5.2 and 9.9 cm smaller in boys and girls, respectively. Among the reasons for the diferences in cut-of values of the anthropometric indices in question found in other studies are the diversity of methods chosen to measure body fat (for instance, skinfolds, bioimpedance, plethysmography, and DEXA); the methods selected to express excess body fat (for instance, predictive equations of body fat percentage, such as those devised by Lohman29 and Slaughter et al.30, as well as percentiles of
skinfold sums); and also how anthropometric data are treated. Regarding this latter reason, we highlight that, in this study, the SFT values were analyzed so as to yield the values of the residuals (body fat values independent of the efect of the children’s age). We can also mention issues related to ethnicity and puberty stages, as well as diferences in the prevalence of excess weight and abdominal adiposity among the populations studied, and the fact that these research studies were conducted at diferent moments.
DiAGnostic AccuRAcy of AnthRopometRic inDices in pReDictinG
excess body fat among seven to ten-year-old children
for body fat due to the fact that this is a population-based study. Skinfold measuring has been used in several population-based studies to estimate the individuals’ body fat27,31,32. The use of the 90th
percentile based on a sample of absolute measurements of the skinfolds (standardized residuals) as the cut-of point for excess body fat was arbitrary in the present study. However, several authors have used prediction equations to calculate body fat percentage (BF%), indicating ixed percentages (for instance, BF > 25% for boys and BF > 30% for girls) to deine excess body fat in children21,33.
This proposal, however, is questionable because predictive equations are susceptible to errors, as they are speciic to the population in which they were developed34,35. Furthermore, the quantity
of body fat can vary according to age and sex36.
Our data indicate that the diagnostic accuracy of the BMI, the WC and the WHtR was similar, although the BMI is more consistent in identifying children with excess body fat in relation to individuals without this condition. Our results also showed that optimal BMI, WC and WHtR cut-of points can also be used to efectively predict excess body fat, as expressed through skinfold measurement, in seven to ten-year-old children in Florianópolis. These cut-of points must be compared to health biological markers in future studies.
REFERENCES
1. WHO. Obesity: preventing and managing the global epidemic. Report of a WHO consultation. World Health Organ Tech Rep Ser 2000; 894: i-xii,1-253.
2. Freedman DS, Khan LK, Serdula MK, Dietz WH, Srinivasan SR, Berenson GS. Inter-relationships among childhood BMI, childhood height, and adult obesity: the Bogalusa Heart Study. Int J Obes Relat Metab Disord 2004; 28(1): 10-6.
3. Cole TJ, Bellizzi MC, Flegal KM, Dietz WH. Establishing a standard deinition for child overweight and obesity worldwide: international survey. BMJ 2000; 320(7244): 1240-3.
4. de Onis M, Onyango AW, Borghi E, Siyam A, Nishida C, Siekmann J. Development of a WHO growth reference for school-aged children and adolescents. Bull World Health Organ 2007; 85(9): 660-7.
5. Conde WL, Monteiro CA. Body mass index cutof points for evaluation of nutritional status in Brazilian children and adolescents. J Pediatr 2006; 82(4): 266-72.
6. Reilly JJ, Dorosty AR, Emmett PM. Identiication of the obese child: adequacy of the body mass index for clinical practice and epidemiology. Int J Obes Relat Metab Disord 2000; 24(12): 1623-7.
7. Malina RM, Katzmarzyk PT. Validity of the body mass index as an indicator of the risk and presence of overweight in adolescents. Am J Clin Nutr 1999; 70(1): 131S-6S.
8. Savva SC, Tornaritis M, Savva ME, Kourides Y, Panagi A, Silikiotou N, et al. Waist circumference and waist-to-height ratio are better predictors of cardiovascular disease risk factors in children than body mass index. Int J Obes Relat Metab Disord 2000; 24(11): 1453-8.
9. Mafeis C, Pietrobelli A, Grezzani A, Provera S, Tatò L. Waist circumference and cardiovascular risk factors in prepubertal children. Obes Res 2001; 9(3): 179-87.
10. Janssen I, Katzmarzyk PT, Ross R. Waist circumference and not body mass index explains obesity-related health risk. Am J Clin Nutr 2004; 79(3): 379-84.
11. Hsieh SD, Yoshinaga H, Muto T. Waist-to-height ratio, a simple and practical index for assessing central fat distribution and metabolic risk in Japanese men and women. Int J Obes Relat Metab Disord 2003; 27(5): 610-6.
13. de Assis MA, Rolland-Cachera MF, Grosseman S, de Vasconcelos FA, Luna ME, Calvo MC, et al. Obesity, overweight and thinness in schoolchildren of the city of Florianopolis, Southern Brazil. Eur J Clin Nutr 2005; 59(9): 1015-21.
14. de Assis MA, Rolland-Cachera MF, de Vasconcelos FA, Bellisle F, Conde W, Calvo MC, et al. Central adiposity in Brazilian schoolchildren aged 7-10 years. Br J Nutr 2007; 97(4): 799-805.
15. Lohman TG, Roche AF, Martorell R. Anthropometric standardization reference manual. Champaign IL United States: Human Kinetics; 1988.
16. Altman DG, Bland JM. Diagnostic tests 3: receiver operating characteristic plots. BMJ 1994; 309(6948): 188.
17. Deeks JJ. Systematic reviews in health care: Systematic reviews of evaluations of diagnostic and screening tests. BMJ 2001; 323(7305): 157-62.
18. Deeks JJ, Altman DG. Diagnostic tests 4: likelihood ratios. BMJ 2004; 329(7458): 168-9.
19. McCarthy HD, Ashwell M. A study of central fatness using waist-to-height ratios in UK children and adolescents over two decades supports the simple message-’keep your waist circumference to less than half your height’. Int J Obes (Lond) 2006; 30(6): 988-92.
20. Campagnolo PD, Hofman DJ, Vitolo MR. Waist-to-height ratio as a screening tool for children with risk factors for cardiovascular disease. Ann Hum Biol 2011; 38(3): 265-70.
21. Hubert H, Guinhouya CB, Allard L, Durocher A. Comparison of the diagnostic quality of body mass index, waist circumference and waist-to-height ratio in screening skinfold-determined obesity among children. J Sci Med Sport 2009; 12(4): 449-51.
22. Adegboye AR, Andersen LB, Froberg K, Sardinha LB, Heitmann BL. Linking deinition of childhood and adolescent obesity to current health outcomes. Int J Pediatr Obes 2010; 5(2): 130-42.
23. Freedman DS, Kahn HS, Mei Z, Grummer-Strawn LM, Dietz WH, Srinivasan SR, et al. Relation of body mass index and waist-to-height ratio to cardiovascular disease risk factors in children and adolescents: the Bogalusa Heart Study. Am J Clin Nutr 2007; 86(1): 33-40.
24. Neovius M, Linné Y, Rossner S. BMI, waist-circumference and waist-hip-ratio as diagnostic tests for fatness in adolescents. Int J Obes (Lond) 2005; 29(2): 163-9.
25. Cameron N, Jones LL, Griiths PL, Norris SA, Pettifor JM. How well do waist circumference and body mass index relect body composition in pre-pubertal children? Eur J Clin Nutr 2009; 63(9): 1065-70.
26. Taylor RW, Jones IE, Williams SM, Goulding A. Evaluation of waist circumference, waist-to-hip ratio, and the conicity index as screening tools for high trunk fat mass, as measured by dual-energy X-ray absorptiometry, in children aged 3-19 y. Am J Clin Nutr 2000; 72(2): 490-5.
27. Glässer N, Zellner K, Kromeyer-Hauschild K. Validity of body mass index and waist circumference to detect excess fat mass in children aged 7-14 years. Eur J Clin Nutr 2011; 65(2): 151-9.
28. McCarthy HD, Jarrett KV, Crawley HF. The development of waist circumference percentiles in British children aged 5.0-16.9 y. Eur J Clin Nutr 2001; 55(10): 902-7.
29. Lohman TG. Applicability of body composition techniques and constants for children and youths. Exerc Sport Sci Rev 1986; 14: 325-57.
30. Slaughter MH, Lohman TG, Boileau RA, Horswill CA, Stillman RJ, Van Loan MD, et al. Skinfold equations for estimation of body fatness in children and youth. Hum Biol 1988; 60(5): 709-23.
31. Mei Z, Grummer-Strawn LM, Wang J, Thornton JC, Freedman DS, Pierson RN Jr, et al. Do skinfold measurements provide additional information to body mass index in the assessment of body fatness among children and adolescents? Pediatrics 2007; 119(6): e1306-13.
32. Deurenberg-Yap M, Niti M, Foo LL, Ng SA, Loke KY. Diagnostic accuracy of anthropometric indices for obesity screening among Asian adolescents. Ann Acad Med Singapore 2009; 38(1): 3-6.
33. Fernandes RA, Rosa CSC, da Silva CB, Bueno DR, de Oliveira AR, Júnior IFF. Accuracy of diferent body mass index cutofs to predict excessive body fat and abdominal obesity in adolescents. Rev Assoc Med Bras 2007; 53(6): 515-9.
34. Reilly JJ, Wilson J, Durnin JV. Determination of body composition from skinfold thickness: a validation study. Arch Dis Child 1995; 73(4): 305-10.
35. Roche AF, Sievogel RM, Chumlea WC, Webb P. Grading body fatness from limited anthropometric data. Am J Clin Nutr 1981; 34(12): 2831-8.
36. Taylor RW, Jones IE, Williams SM, Goulding A. Body fat percentages measured by dualenergy X-ray absorptiometry corresponding to recently recommended body mass index cutofs for overweight and obesity in children and adolescents aged 3-18 y. Am J Clin Nutr 2002; 76(6): 1416-21.
Received on: 07/26/2011
Final version presented on: 01/13/2012