Willegaignon J et al. / Dose calibrator linearity test: Tc versus F
Radiol Bras. 2015 Jan/Fev;48(1):26–32 26
Original Article
Dose calibrator linearity test:
99m
Tc versus
18
F radioisotopes
*
Teste de linearidade em medidor de atividade: utilização do radioisótopo 99m
Tc versus 18F
Willegaignon J, Sapienza MT, Coura-Filho GB, Garcez AT, Alves CEGR, Cardona MAR, Gutterres RF, Buchpiguel CA. Dose calibrator linearity test: 99mTc
versus 18F radioisotopes. Radiol Bras. 2015 Jan/Fev;48(1):26–32.
Abstract
R e s u m o
Objective: The present study was aimed at evaluating the viability of replacing 18F with 99mTc in dose calibrator linearity testing.
Materials and Methods: The test was performed with sources of 99mTc (62 GBq) and 18F (12 GBq) whose activities were measured up to values lower than 1 MBq. Ratios and deviations between experimental and theoretical 99mTc and 18F sources activities were calculated and subsequently compared.
Results: Mean deviations between experimental and theoretical 99mTc and 18F sources activities were 0.56 (± 1.79)% and 0.92 (± 1.19)%, respectively. The mean ratio between activities indicated by the device for the 99mTc source as measured with the equipment pre-calibrated to measure 99mTc and 18F was 3.42 (± 0.06), and for the 18F source this ratio was 3.39 (± 0.05), values considered constant over the measurement time.
Conclusion: The results of the linearity test using 99mTc were compatible with those obtained with the 18F source, indicating the viability of utilizing both radioisotopes in dose calibrator linearity testing. Such information in association with the high potential of radiation exposure and costs involved in 18F acquisition suggest 99mTc as the element of choice to perform dose calibrator linearity tests in centers that use 18F, without any detriment to the procedure as well as to the quality of the nuclear medicine service.
Keywords: Nuclear medicine; Dose calibrator; Linearity test; Nuclear instrumentation.
Objetivo: Avaliar a viabilidade de substituir o radioisótopo 18F pelo 99mTc no teste de linearidade em medidores de atividade.
Materiais e Métodos: O teste foi realizado empregando-se fontes de 99mTc (62 GBq) e 18F (12 GBq), cujas atividades foram mensura-das até valores abaixo de 1 MBq. As razões e desvios entre as atividades experimentais e teóricas foram calculados e comparados.
Resultados: Os desvios médios entre as atividades experimentais e teóricas para o 99mTc e 18F foram, respectivamente, 0,56 (± 1,79)% e 0,92 (± 1,19)%. A razão média entre as atividades indicadas pelo equipamento para a fonte de 99mTc quando mensurada no equi-pamento pré-ajustado para medir o 99mTc e 18F foi 3,42 (± 0,06), e para o 18F este valor foi 3,39 (± 0,05), razões consideradas constantes ao longo de todo o período de medida.
Conclusão: Os resultados do teste utilizando o 99mTc são compatíveis com os adquiridos com o 18F, implicando na possibilidade de utilização de ambos os radioisótopos na realização do teste de linearidade. Esta informação, aliada ao elevado potencial de exposição e custos de aquisição do 18F, sugere que o 99mTc seja empregado na realização do teste de linearidade para clínicas que utilizam 18F, sem prejuízo para o procedimento e garantia da qualidade de um serviço de medicina nuclear.
Unitermos: Medicina nuclear; Medidor de atividade; Teste de linearidade; Instrumentação nuclear.
* Study developed at the Service of Nuclear Medicine of Instituto do Câncer do Estado de São Paulo Octavio Frias de Oliveira (Icesp), São Paulo, SP, Brazil.
1. PhD, Head Physicist at the Service of Nuclear Medicine of Instituto do Câncer do Estado de São Paulo Octavio Frias de Oliveira (Icesp), São Paulo, SP, Brazil.
2. Private Docent, Professor, Department of Radiology and Oncology, Faculdade de Medicina da Universidade de São Paulo (FMUSP), São Paulo, SP, Brazil.
3. MD, Physician Assistant at the Service of Nuclear Medicine of Instituto do Câncer do Estado de São Paulo Octavio Frias de Oliveira (Icesp), São Paulo, SP, Brazil.
4. Physicist at the Service of Nuclear Medicine of Instituto do Câncer do Estado de São Paulo Octavio Frias de Oliveira (Icesp), São Paulo, SP, Brazil.
5. Master, Technologist, Comissão Nacional de Energia Nuclear (CNEN), Rio de Janeiro, RJ, Brazil.
6. PhD, Technologist, Comissão Nacional de Energia Nuclear (CNEN), Rio de Ja-neiro, RJ, Brazil.
7. PhD, Department Head, Comissão Nacional de Energia Nuclear (CNEN), Rio de Janeiro, RJ, Brazil.
8. Private Docent, Full Professor, Department of Radiology and Oncology, Facul-dade de Medicina da UniversiFacul-dade de São Paulo (FMUSP), São Paulo, SP, Brazil.
INTRODUCTION
Dose calibrator is an indispensable equipment in the field of nuclear medicine, and is widely utilized in the measure-ment of radioisotopes quantities to be administered to pa-tients both in diagnostic and therapeutic procedures. For evaluation and proper maintenance, such an equipment must be routinely submitted to performance tests, particularly the linearity test(1). Such a test is aimed at evaluating whether the equipment maintains its capability of measuring the ra-dioisotopes activities in different magnitudes, as the quanti-José Willegaignon1, Marcelo Tatit Sapienza2, George Barberio Coura-Filho3, Alexandre Teles Garcez4,
Carlos Eduardo Gonzalez Ribeiro Alves5, Marissa Anabel Rivera Cardona6, Ricardo Fraga Gutterres7,
Carlos Alberto Buchpiguel8
Mailing Address: PhD. José Willegaignon. Avenida Doutor Arnaldo, 251, 4º Sub-solo (Medicina Nuclear), Cerqueira César. São Paulo, SP, Brazil, 01246-000. E-mail: [email protected].
Willegaignon J et al. / Dose calibrator linearity test: Tc versus F
ties utilized in diagnostic and therapeutic procedures may differ by orders of magnitude.
Several studies in the literature indicate the relevance of the linearity test and the technical procedures for its imple-mentation(1–4). Such a test is aimed at evaluating the linear response of the equipment produced by different activities of a given radioisotope, from a source with an activity close to the minimum resolution of the measurement system (MBq) to a high activity source (GBq). In practice, gener-ally one starts with a high activity source, which will decrease according to the radioisotope physical decay. Although the linearity test may be performed by utilizing different radio-isotopes, technetium-99m (99m
Tc) has been the element of choice due to its short physical half-life (6 hours), wide avail-ability, low cost and for being the element with higher rep-resentativeness at nuclear medicine clinics. On the other hand, the increasing number of clinics dedicated to positron emission tomography, relying mainly on fluoride-18 (18
F), has led to questions on the possibility of the utilization of
99m
Tc in linearity tests at such clinics, with a view on the high acquisition cost of 18
F.
Based on the above mentioned factors, the main objec-tive of the present study is evaluating the use of 99m
Tc and
18
F radioisotopes in linearity tests, comparing results and indicating the radioisotope of lowest operational cost for nuclear medicine clinics.
MATERIALS AND METHODS
The linearity test was performed utilizing 99m
Tc and 18
F sources in a CRC-25R dose calibrator, serial number 252090 (Capintec Inc., USA) of the Nuclear Medicine Service of Instituto do Câncer do Estado de São Paulo Octavio Frias de Oliveira (Icesp). Such an equipment is based on a pres-surized ionization chamber, with suitable characteristics for utilization in the field of nuclear medicine. Previously to linearity tests, precision, accuracy, source geometry tests and daily controls were performed in the dose calibrator, assur-ing the good quality of the equipment before startassur-ing the study.
The initial activity of the 99m
Tc source (62 GBq) was obtained by means of 99
Mo/99m
Tc generator elution process, number 350IP0039, acquired under purchasing procedure from Instituto de Pesquisas Energéticas e Nucleares (Ipen). The 18
F source (initial activity of 12 GBq), lot 131213-0101, was acquired by donation from Ciclotron of Instituto de Radiologia do Hospital das Clínicas da Faculdade de Medi-cina da Universidade de São Paulo. Both sources were in the liquid physical state, with respective volumes of 6.0 mL and 2.5 mL, in glass vials.
The 99m
Tc source was measured along five days while the 18
F source was measured along two days, starting from the initial activities of 62 GBq and 12 GBq, respectively, ob-taining 13 measurement spots for the 99m
Tc source and 10 spots for the 18
F source. The activity considered for each measurement spot corresponded to the arithmetic mean of
five measurements. The 99m
Tc activity as well as that of 18
F were measured until the activities reached values compat-ible with the lower resolution of the measurement system, indicated by the manufacturer (~ 1 MBq) and in accordance with the minimum activity to be utilized in the test and indi-cated by different recommendations(4–7).
The method adopted to evaluate dose calibrator response linearity in relation to the variation of the sources activities was the decay method, which consists of measuring the ac-tivity of a given source along time, allowing for the plotting of the “activity versus time” curve and the comparison of the experimental activity values with the expected theoretical values for the source at the different measurement times. The calculation of the theoretical activities took into consider-ation the physical half-life of both 99m
Tc (6 hours) and 18
F (1.83 hours)(6). The acceptable limits for deviation between the theoretical and experimental values were ± 5% and ± 10% in accordance with recommendations from International Atomic Energy Agency (IAEA) and standards of Comissão Nacional de Energia Nuclear (CNEN)(3,4,8).
Both the 99m
Tc and the 18
F sources were measured with the equipment being pre-adjusted for the measurement of
99m
Tc sources (99m
Tc “window”) and subsequently for 18
F sources (18
F “window”), thus allowing for the comparison of detector response for the same radioactive source when measured at different radioisotope windows.
The acquisition costs of the 99m
Tc and 18
F sources nec-essary for the linearity tests were also estimated.
In the present study, as necessary, some data are pre-sented as mean value ± 1 standard deviation.
RESULTS
Successive measurements of the 99m
Tc and 18
F sources have experimentally demonstrated the variation of their ac-tivities over time as result of the radioactive decay process. All the experimental measurements and the ratios between such measurements are presented on Table1, and the trend lines for the obtained values can be observed on Figures 1, 3, 5 and 6. The deviation value presented on the table cor-responds to the deviation between the experimental activity value acquired by means of the dose calibrator and that esti-mated for the source by means of calculation for the same time span.
Because of the good precision of the equipment, the stan-dard deviation presented in each measurement series corre-sponded to approximately 1% of the mean value for that set of measurements.
It is important to emphasize that the experimental ac-tivities indicated on the table and figures represent the mean value of a series of five measurements, but the measurements standard deviation (approximately 1% of the mean value) was not indicated in order not to impair or confuse the visual analysis of the charts and table.
experi-Willegaignon J et al. / Dose calibrator linearity test: Tc versus F
mental and theoretical values of the 99m
Tc and 18
F activities as a function of time, as well as the lower and upper accept-able limits for the test in accordance with the IAEA recom-mendations and CNEN standards.
The mean deviation between the experimental and theo-retical activities for the 99m
Tc and 18
F sources were, respec-tively, 1.10 (± 2.57)% and 1.45 (± 2.02)% and the maxi-mum values observed were 7.47% for the 99m
Tc source and 6.24% for the 18
F source, both values located at the lower resolution limit of the measurement system (< 1 MBq). For
activity levels greater than the lower resolution limit of the system, the mean values of the deviations were 0.56 (± 1.79)% for the 99m
Tc source and 0.92 (± 1.19)% for the 18
F source, indicating an excellent quality of the system in the measure-ment of different activity quantities of a same radioisotope. The adjustment of an exponential function of the y = a + beλt and λ = 0.693/T1/2physical types, for the experimental data for the 99m
Tc and 18
F sources allowed for the calculation of the physical half-life for both elements, whose values were, respectively, 5.949 (± 0.002) hours and 1.816 (± 0.007) hour
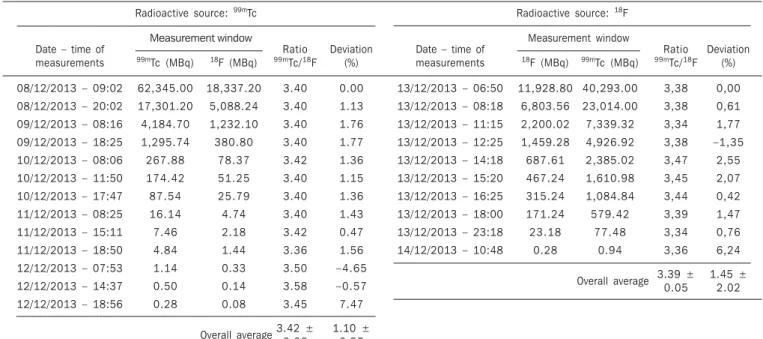
Table —Ratios and deviations between experimental and theoretical activities for the 99mTc and 18F sources at different times and measurement windows.
Radioactive source: 99mTc Radioactive source: 18F
Date – time of measurements
08/12/2013 – 09:02
08/12/2013 – 20:02
09/12/2013 – 08:16
09/12/2013 – 18:25
10/12/2013 – 08:06
10/12/2013 – 11:50
10/12/2013 – 17:47
11/12/2013 – 08:25
11/12/2013 – 15:11
11/12/2013 – 18:50
12/12/2013 – 07:53
12/12/2013 – 14:37
12/12/2013 – 18:56
Measurement window
99mTc (MBq)
62,345.00 17,301.20 4,184.70 1,295.74 267.88 174.42
8 7 . 5 4
1 6 . 1 4
7.46
4.84
1.14
0.50
0.28
18F (MBq)
18,337.20
5,088.24
1,232.10
380.80
7 8 . 3 7
5 1 . 2 5
2 5 . 7 9
4.74 2.18 1.44 0.33 0.14 0.08 Ratio
99mTc/18F
3.40 3.40 3.40 3.40 3.42 3.40 3.40 3.40 3.42 3.36 3.50 3.58 3.45 3.42 ± 0.06 Deviation (%) 0.00 1.13 1.76 1.77 1.36 1.15 1.36 1.43 0.47 1.56
– 4 . 6 5
– 0 . 5 7
7.47
1.10 ± 2.57
Date – time of measurements
13/12/2013 – 06:50
13/12/2013 – 08:18
13/12/2013 – 11:15
13/12/2013 – 12:25
13/12/2013 – 14:18
13/12/2013 – 15:20
13/12/2013 – 16:25
13/12/2013 – 18:00
13/12/2013 – 23:18
14/12/2013 – 10:48
18F (MBq)
11,928.80 6,803.56 2,200.02 1,459.28 687.61 467.24 315.24 171.24
2 3 . 1 8
0.28
99mTc (MBq)
40,293.00 23,014.00 7,339.32 4,926.92 2,385.02 1,610.98 1,084.84 579.42
7 7 . 4 8
0.94
Ratio
99mTc/18F
3,38 3,38 3,34 3,38 3,47 3,45 3,44 3,39 3,34 3,36 3.39 ± 0.05 Deviation (%) 0,00 0,61 1,77
– 1 , 3 5
2,55 2,07 0,42 1,47 0,76 6,24 1.45 ± 2.02 Measurement window Overall average Overall average
Figure 1.99mTc source activity decrease
as a function of time as measured in the
99mTc and 18F windows.
A c ti v it y ( M B q )
Radioactive source: 99mTc – Measurements windows: 99mTc and 18F
99mTc
1 8F
Willegaignon J et al. / Dose calibrator linearity test: Tc versus F
with a difference of less than 1% from values reported in the literature(6).
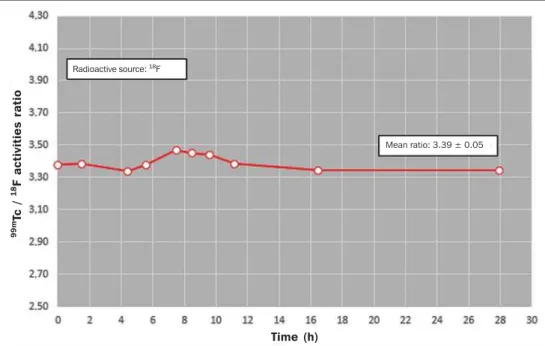
The mean ratio between the activities indicated by the equipment for the 99m
Tc source when measured at the re-spective 99m
Tc and 18
F windows was 3.42 (± 0.06) while for the 18
F source was 3.39 (± 0.05). Such ratios were con-sidered constant throughout the entire measurement period (Table 1) implying the possibility of utilization of both
ra-dioisotopes in the linearity test, independently from the win-dow utilized to measure the source, as the linearity test aims at evaluating the equipment response in the measurement of different activity quantities, whose response should be linear in the interval between the lower and upper limits of activity utilized at the nuclear medicine clinic on a daily basis(4).
As regards costs, the acquisition cost of a 99
Mo/99m
Tc generator with 6.75 GBq (250 mCi) for the performance of
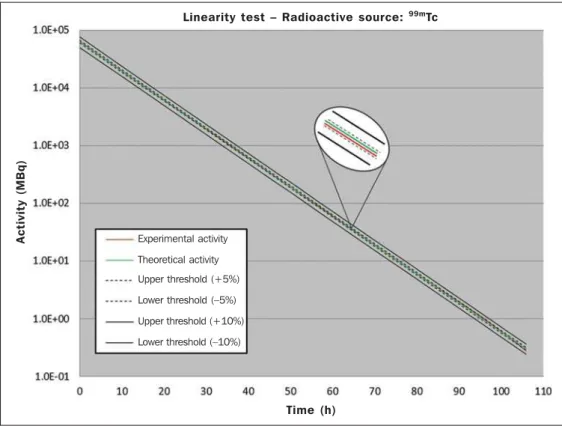
Figure 2. Characteristic chart of the lin-earity test performed with the 99mTc
source, indicating the upper and lower thresholds of acceptable deviations for
the purpose of this testing. Time (h)
Linearity test – Radioactive source: 99mTc
A
c
ti
v
it
y
(
M
B
q
)
Experimental activity
Theoretical activity
Upper threshold (+5%)
Lower threshold (–5%)
Upper threshold (+10%)
Lower threshold (–10%)
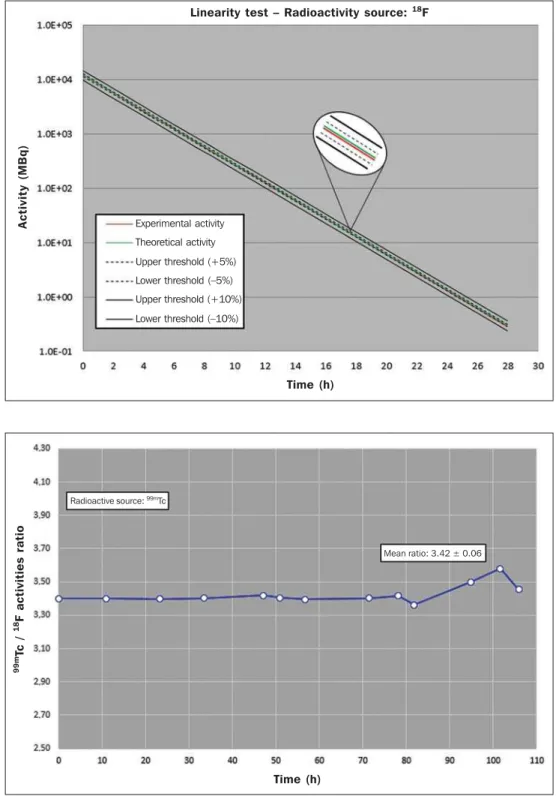
Figure 3.18F source activity decrease
as a function of time as measured in the
18F and 99mTc windows.
Radioactive source: 18F – Measurements windows: 18F and 99mTc
A
c
ti
v
it
y
(
M
B
q
)
Time (h)
1 8F
Willegaignon J et al. / Dose calibrator linearity test: Tc versus F
the linearity test is about R$ 1,300.00, while a 18
FDG source with 6.75 GBq (250 mCi) amounts to approximately R$ 3,500.00, according to a 2014 inquiry to Ipen, an organ of CNEN and main radioisotopes supplier in the Brazilian market.
DISCUSSION
The electric current generated at an ionization cham-ber-based dose calibrator, which is proportional to the ac-tivity, is related both to the quantity of radioactive atoms existing at a given sample and to the photons energy released
during the disintegration process. The same electric current per activity unit (pA/MBq – picoampere per MBq) may be obtained from different radioisotopes, a fact that hinders the identification of the radioisotope by the dose calibrator dur-ing the measurement process. Thus, in order to obtain a reliable reading from the dose calibrator it is necessary to enter correction factors for the electric current proportional to the radioisotope to be measured, and that is automatically obtained by means of the radioisotope selector that exists in the equipment. Generally, the correction factors between a given radioisotope and another are constant, taking as a
ref-Figure 4. Characteristic chart of the linear-ity test performed with the 18F source,
indi-cating the upper and lower thresholds of acceptable deviations for the purpose of this testing.
Linearity test – Radioactivity source: 18F
A
c
ti
v
it
y
(
M
B
q
)
Time (h) Experimental activity
Theoretical activity
Upper threshold (+5%)
Lower threshold (–5%)
Upper threshold (+10%)
Lower threshold (–10%)
Figure 5. Ratio between activity values in-dicated by the dose calibrator for a 99mTc
source as measured in the 99mTc and 18F
windows.
Time (h) Radioactive source: 99m
Tc
Mean ratio: 3.42 ± 0.06
9
9
mTc
/
1
8F
a
c
ti
v
it
ie
s
ra
ti
Willegaignon J et al. / Dose calibrator linearity test: Tc versus F
erence the radioisotopes utilized by the manufacturer in the initial calibration of the equipment, such as the 60
Co and
137
Cs(2) radioisotopes.
Usually, the linearity test provides good results within acceptable parameters, provided the characteristics of the measurement system, such as good precision, accuracy and daily constancy testing are properly maintained. In the present study, the tests were carried out with 99m
Tc and 18
F sources and in both cases the excellent quality of the equipment was independently demonstrated by measuring different activity quantities from radioisotopes with quite distinctive energies, namely 141 keV (99m
Tc) and 0.511 MeV (18
F)(6) (Figures 2 and 4).
The practically constant ratio between the activities in-dicated by the equipment for a same source measured at dif-ferent windows (Table 1; Figures 5 and 6) allows for the demonstration that the utilization of a single radioisotope, for example, 99m
Tc, could be enough for the performance of the linearity test, independently from the utilization of 18
F, either exclusively or not, by the nuclear medicine clinic. Conceptually, the response from a dose calibrator is consid-ered to be linear whenever the measured response/estimated response ratio or deviation remains constant along time, a fact that was experimentally demonstrated in the present study (Table 1)(5).
Additionally, the linearity test evaluates the ionization chamber’s saturation characteristics, as well as the electrom-eter linearity in the electric current measurement. Therefore, the linearity test is not directly linked to the utilized radio-isotope, but rather to the amount of electrical loads gener-ated during the measurement process. Thus, the linearity test could be performed with different radioisotopes provided the electric current interval, proportional to the activity interval to be tested are within the limits applied at the nuclear medi-cine clinic. Such information is very important and useful
for those clinics operating exclusively with positron emit-ters, as is the case of 18
F.
The AAPM Report No. 181(5) has indicated that the el-ements of choice for performance of linearity tests have been
99m
Tc and 18
F, considering that routine tests with all avail-able radioisotopes are not practicavail-able. There is also evidence that there is a lack of consensus on the activities to be uti-lized in the test, a situation where some entities recommend the performance of tests with activities within the interval where the dose calibrator will be utilized, while others such as IAEA recommend the test to be initiated with the maxi-mum activity administered to the patients in the clinic rou-tine, although all of the entities are in agreement that the minimum activity to be tested should approach the resolu-tion values of the measurement system (~ 1 MBq)(5). How-ever, one should consider the fact that not every measured activity will be administered to patients, such as, for example, the activities that will be stored as liquid radioactive waste and, in this particular case, the correct measurement of the activity is a very important factor impacting the storage time span of such waste.
The difference in costs for the performance of the lin-earity test either by utilizing 99m
Tc or the 18
F radioisotopes is very significant, reaching a 40% difference between the two radioisotopes.
A viable option for further reduction in costs would be the supply of de 99m
Tc activities by the radioisotope purvey-ors with the single and exclusive purpose of being utilized for linearity testing. In this context, an inquiry to Ipen for the supply of a 13.5 GBq (500 mCi) 99m
Tc activity resulted in a cost lower than that of a generator, or even free of any cost, depending on favorable logistics, thus sharply impact-ing the cost of the linearity test. It is also important to em-phasize that the utilization of 99m
Tc sources instead of 18
F sources implies a reduction in the potential occupational and
Figure 6. Ratio between activity values in-dicated by the dose calibrator for a 18F source
as measured in the 99mTc and 18F windows.
9
9
mTc
/
1
8F
a
c
ti
v
it
ie
s
ra
ti
o
Time (h) Radioactive source: 18
F
Willegaignon J et al. / Dose calibrator linearity test: Tc versus F
environmental exposure, as a 18
F source presents a dose po-tential 10 times higher than that of a 99m
Tc source with the same activity, namely, 135.1 µGy/GBq.m2
.h and 14.1 µGy/ GBq.m2
.h, respectively(9).
The present study demonstrated the possibility of opti-mizing dose calibrators linearity testing, drawing the atten-tion of investigators and regulatory agents towards a careful evaluation of the present data, as the dissemination of such information might translate into cost reduction for both pri-vate and public health services, without impairing the con-tinuous development of the quality of services rendered to society.
CONCLUSION
The physical characteristics of the dose calibrator uti-lized in the present study allow for the indication that the results obtained in the linearity tests with 99m
Tc can be vali-dated for the utilization of 18
F. Such a result extrapolation, presumably extensible to other apparatuses of similar con-figuration and in satisfactory conditions of utilization, in association with the high exposure potential and acquisition cost of 18
F, suggest that 99m
Tc could be utilized for linearity tests in clinics that utilize 18
F, without impairing the proce-dure as well as the assurance of the nuclear medicine service quality.
REFERENCES
1. Zanzonico P. Routine quality control of clinical nuclear medicine in-strumentation: a brief review. J Nucl Med. 2008;49:1114–31. 2. Prekeges J. Gas-filled detectors. In: Prekeges J, editor. Nuclear
medi-cine instrumentation. Burlington, MA: Jones & Bartlett Learning; 2011. p. 3–16.
3. International Atomic Energy Agency. Quality control of nuclear medicine instruments 1991. IAEA-TECDOC-206. Vienna: Inter-national Atomic Energy Agency; 1991.
4. International Atomic Energy Agency. Quality assurance for radioac-tivity measurement in nuclear medicine. Technical Reports Series No. 454. Vienna: International Atomic Energy Agency; 2006. 5. American Association of Physicists in Medicine. The selection, use,
calibration, and quality assurance of radionuclide calibrators used in nuclear medicine. AAPM Report No. 181. College Park, MD: Ameri-can Association of Physicists in Medicine; 2012.
6. Gadd R, Baker M, Nijram KS, et al. Protocol for establishing and maintaining the calibration of medical radionuclide calibrators and their quality control. Measurement Good Practice Guide No. 93. Middlesex, UK: National Physical Laboratory; 2006.
7. Sokole EB, P»aschínska A, Britten A, et al. Routine quality control recommendations for nuclear medicine instrumentation. Eur J Nucl Med Mol Imaging. 2010;37:662–71.
8. Brasil. Ministério da Ciência, Tecnologia e Inovação. Comissão Nacional de Energia Nuclear. Requisitos de segurança e proteção radiológica para serviços de medicina nuclear. CNEN NN 3.05. Comissão Nacional de Energia Nuclear; 2013.