360
THE INFLUENCE OF COMPOSITIONS ON LIQUEFIED PETROLEUM GAS
RESIDUE IN STORAGE
1
Zainal Zakaria& 2Azeman Mustafa
Department of Gas Engineering, Faculty of Petroleum and Renewable Energy Engineering, Universiti Teknologi Malaysia, 81310 UTM Johor Bahru, Johor, Malaysia
1
Tel: +60197515410 Faks: +6075581463 , 2Tel: +60127676761 Faks: +6075581463 Email: 1zainalz@petroleum.utm.my, 2azeman@petroleum.utm.my
ABSTRACT
Liquefied Petroleum Gas (LPG) has been regarded as a cleaner fuel because it has less impact on air quality. Residue problem was still unsolved since at the early stage of LPG usage in Malaysia, therefore, it was considered as one of the national interest projects. The objective of this study is to obtain detailed understanding of LPG characteristics in cylinder during the continuous exhaustion process via modification of the existing composition design. The propane content of minimum of 60% must be considered in the planning of the composition. The distributions of heat in cylinder showed that the sensible heat used for evaporation process is taken mainly at the internal wall. With that, the dominant heat derived for the evaporation process is through the axial direction than the radial direction. Finally, the study indicates that with proper selection of operating parameters the LPG residue in a cylinder could be reduced to less than 10%.
Keywords: LPG, evaporation, cylinder, storage, residue, composition, wetted area, exhaustion
1. INTRODUCTION
Liquefied petroleum gas or commercially known as LPG is a group of hydrocarbons derived from crude petroleum processes or natural gas which are gases at normal temperatures and atmospheric pressures but which become liquid with either a moderate drop in temperature or pressure, or both. With that characteristic, sometimes LPG is known
as a „hydrocarbon borderline product‟[1]. LPG has received increasing attention since it was recognized as a
reasonable energy resource and commonly used for many applications[2,3]. LPG supply for industrial and commercial use is available to the consumer in cylinders of larger capacity than the regular domestic household cylinders or in bulk tanks of even larger capacities. Commercial cylinders are generally used for restaurants and bakeries where the LPG consumption and gas delivery rate are high that the vaporization rate of the regular household cylinders cannot support. Commercial cylinders may be linked together to support higher capacities. It is manifold, closely linked to the economics of energy generation, and offers a great reduction in pollutant emissions[4] which is 100 times lower than gasoline[5]. Because of these reasons, LPG can be utilized in many sectors such as domestic, commercial and industrial sectors. LPG can be transported and stored in liquid form under moderate pressures and at normal temperatures. When released at atmospheric pressure at relatively low temperature it vaporizes and can be handled as a gas[6]. But this operation cycle included a problem related to the loss due to the residual amount of gas left at exhaustion. This problem has been considered as one of the main drawbacks in LPG cylinders that create unsatisfactory conditions. This problem occurs when the vapor is consumed through the natural evaporation process at high exhaustion rate[7]. In this process, the temperature of the liquid and the pressure inside the cylinder drop rapidly and may reach a point when the cylinder pressure is insufficient to supply the gas at the required exhaustion rate[8]. The required exhaustion pressure is the minimum inlet pressure for a regulator and normally considers being at 5 psi for commercial sector[9]. At this point the exhaustion rate may approach zero and create residue in the cylinder. It is reported that more than 10 percent of residue or 12.6 kg is found in the 50 kg water capacity cylinder[9] which is consist of propane 2.17% and butane 97.82% by weight respectively. Recently, even though there are a number of researchers investigating the residue problem, a complete solution is yet to be found.
361
show some potential in improvement of the evaporation process. Nevertheless, the methods lack applicability and practicability to be adopted, and hence are not possible to be commercialized[12].
Therefore, the researcher suggested that it should be better if the overall concept of mass and heat transfer to the liquefied petroleum gas cylinder under unsteady state condition is carried out in detail. This is because the major factor affecting the residue is the amount of sensible heat required during the evaporation process. By understanding the concept of heat and mass transfer under unsteady state condition, it will lead to the development of the rig verification model[3]. The data gathered from validated experimental rig will be able to determine the correct composition to achieve minimum residue amount. Hence, it will lead to the development of a composition limitation of liquefied petroleum gas operation.
2. Materials and Methods
Materials used in this study are the mixing of the components of propane and butane with the composition of 4060. This study involved the fabrication and installation of simple apparatus as shown in Figure 1. The rig basically was referred to the study method done for a small size of cylinder[10,11]. However, few modifications were made, such as the number and positions of the thermocouples, control of surrounding temperature and flow meter arrangements as well as the additional on line gas chromatography. However, in order to complete this study, the equipments or apparatus involved considered only the testing cylinder, the number and position of the thermocouples, data logger, computer and flow meter. Experiment was conducted by fixing parameters of composition, filling weight and initial flow rate and variation of surrounding temperature range from 10oC to 35oC. Such data of temperature, pressure and weight has been taken for every 5 mins interval for 1 hr and every 30 mins after the period of 1 hr until the cylinder pressure reach to zero gauge.
Figure 1 Schematic diagram of the study rig [3]
3. RESULTS AND DISCUSSIONS
3.1 Temperature Distribution Profile
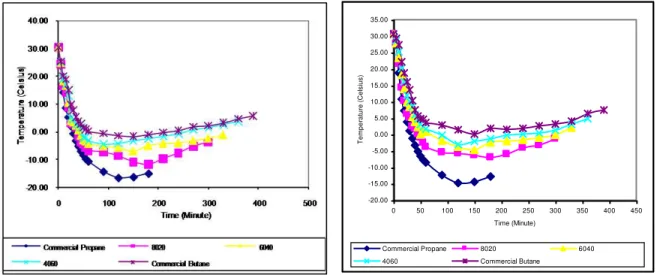
In the designing of LPG composition, the factor of how fast or slow the boiling or dew point was reached was considered at the bottom thermocouple. Figures 2-3 are examples of temperature readings at the bottom thermocouple for the various LPG compositions at flow rate of 48 l/mins and the surrounding temperature of 30oC. Three important characteristics can be observed from these figures.
Firstly, for the first 60 mins; the rate of temperature drop seemed to be proportionate to the initial composition of propane. Higher propane mixture caused much faster in temperature drop. Commercial propane had the lowest temperature of liquid left in cylinder, and the temperature increased with decrease in propane content, while commercial butane had the highest temperature. The differences became greater when the evaporation further
Data logger
Computer
Thermal start/Oven
Thermocouple
Glass window Testing Cylinder
Gas Charging
Gas Discharging On-line GC
Balance
Solenoid valve Ball valve
Ball valve Flow meter
362
continued. However, the temperature difference became smaller when temperature sensors were exposed to the vapor phase.
-20.00 -15.00 -10.00 -5.00 0.00 5.00 10.00 15.00 20.00 25.00 30.00 35.00
0 50 100 150 200 250 300 350 400 450
Time (Minute)
T
e
m
p
e
ra
tu
re
(
C
e
ls
iu
s
)
Commercial Propane 8020 6040
4060 Commercial Butane
Figure 2 Temperatures Reading at Center of the Figure 3 Temperatures Reading at Internal Various Compositions at Initial Flow Rate of Wall of the Various Compositions at Initial 48 l/mins and Surrounding Temperature of Flow Rate of 48 l/mins and
30oC Surrounding Temperature of 30oC
Figure 4 Temperatures Reading at External Wall Figure 5 Relationship between Temperature of the Various Compositions at Initial Flow Rate and Composition at Initial Flow Rate of 48 of 48 l/mins and Surrounding Temperature l/mins and Surrounding Temperature of 30oC
of 30oC
Secondly, at the period of 60 mins till 180 mins, temperature remained constant or very slowly decreased or increased, in particular at higher initial butane mixture. This is because butane has a higher boiling point and more heat was retained by butane molecules before vaporization occurred. The fastest rate of the temperature increase was commercial propane followed by compositions with progressively lesser propane content. The turning time to the vapor phase for composition of commercial propane to commercial butane was 180 mins, 190 mins, 210 mins, 300 mins and 330 mins. Thus, it can be said that at that time, propane content in composition of 8020 was still large compared to compositions of 6040 and composition of 4060. Even though propane content in composition of 8020 was not the same to in composition of 6040 but the level of temperature indicated quite close. Furthermore, propane content in composition of 4060 was almost the same to that in commercial butane whereby both compositions took a longer time to increase their temperatures. For both of the situations probably it has the same physical characteristics. If the above statement is true, propane in 60% probably can be assumed as a right minimum amount for LPG and it will be confirmed later in a related sub-chapter. This is because more propane in composition of 6040 was emitted before the liquid reached the position of the bottom thermocouple whereas at the below composition the propane was trapped together with butane in the cylinder due to the excessive reduction of temperature of liquid left
-18.00 -16.00 -14.00 -12.00 -10.00 -8.00 -6.00 -4.00 -2.00 0.00
0 20 40 60 80 100 120
Propane Composition (Percentage)
Te
m
p
e
ra
tu
re
(
C
e
ls
iu
s)
90 Minute 120 Minute 150 Minute 180 Minute
363
in the cylinder. Therefore, further productions encountered problems because supporting forces needed from propane had decreased since propane has less heat content compared to butane.
Thirdly, the curve indirectly illustrates how large or small the vapor pressure possessed by a particular composition at that condition. Therefore, propane content of 60% would be able to help increase the vapor pressure of LPG in cylinders at that condition since it had almost quite close with the 80% of propane contents toward the end as well as able to maintain pressure level above 7 psi (0.5 bar). However, compared to commercial propane the difference was too obvious. Additional evidence on the suggested composition was based on a minimum turning point on the relationship between liquid temperature and composition as shown in Figure 5. Based on the literature, the composition of 6040 would provide the highest flame stability when used for domestic burner, reduction in pollution and increased energy efficiency. The propane content of 60% had also proven that the right parameter design of LPG is used in Thailand.
3.1.1 Axial Direction
Figure 6 shows variation in temperature profiles with centre line z/L for various LPG mixture compositions after 10 mins of discharging period. Based on Figure 6, there were a few characteristics that can be observed. Firstly, the trend of the heat distribution among all compositions is quite similar, which is the lowest temperature occurred at the middle part of the cylinder. It means that, at the beginning of the process of evaporation or exhaustion the latent heat of evaporation was derived mainly from liquid molecules nearer the liquid surface region since the temperature sensors at the upper and the lowest part showed a small reduction of temperature. For example, at the upper part and the lowest part of the composition of the commercial propane, the temperature was 23oC and 20oC respectively whereas at the axial position (Z/L) 0.4 the temperature was 15oC. However, as the exhaustion continues, the liquid level dropped and heat was derived from the remaining liquid in the cylinder
-10 -5 0 5 10 15 20 25
0 0.2 0.4 0.6 0.8 1 1.2
Axial Position, z/L
Te
m
pe
rat
ur
e
(C
el
si
us
)
100C3 8020 6040 4060 100C4
Figure 6 Dimensionless Axial Profile of Figure 7 Dimensionless Axial Profile of Temperature at 10 mins at Centre of Various Temperature at 120 mins at Center of Various Compositions at Initial Flow rate of 48 Compositions at Initial Flow Rate of 48 l/mins, Surrounding Temperature of 30oC l/mins, Surrounding Temperature of and Weight of 6 kg 30oC and Weight of 6 kg
Secondly, the lowest temperature drop among all compositions was occurring to the composition of commercial butane and the highest was commercial propane and the order of drop was commercial butane, 4060, 6040, 8020 and commercial propane. It means that, the higher the propane content the more heat derived from the liquid molecules for the evaporation process. Therefore, the tendency for butane molecules to leave behind in the liquid phase is high since the boiling point for butane is far above the boiling point of propane, which is –0.5oC and –42oC respectively. Thirdly, the gradient of the temperature drop will vary accordingly from commercial propane to commercial butane. However, the gradient of the temperature drop of the composition of commercial butane, 4060 and 6040 is almost the same compared to the composition of commercial propane and 8020. This is shown from the minimum percentage of propane component in LPG is 60% in order to protect the maximum drop of temperature in the cylinder. Therefore, the minimum amount of propane component of 60% should be considered in LPG.
Figure 7 shows variation in temperature profiles after 120 minutes of discharging period. In comparison to Figure 6, the temperature profiles in Figure 7 show that the lowest temperature region was shifted towards the bottom region of the cylinder. This seems to suggest that as the LPG vapor was continuously exhausted, the LPG liquid level
Liquid Phase
364
steadily decreased and the required latent heat of evaporation was further extracted from liquid molecules available in the bottom part of the cylinder. However, the trend of temperature drop changed towards the end of the discharging processes.
There were also two interesting features exhibited in Figure 7. The pattern of temperature profiles seems to be significantly related to the LPG composition. A detailed analysis of all lines in the figure shows that the temperature profile of composition of 4060 closely followed to that of the commercial butane, whereas the temperature profiles of composition of 6040 and that of composition of 8020 were very much similar to that of commercial propane. Thus, the experimental results seem to suggest that if commercial propane was used as a reference composition in order to minimize the problem of residue, then the minimum amount of propane in LPG mixture should be 60%. A closed observation on the temperature profile around the bottom part of the cylinder, i.e. z/L ≤ 0.2, shows that both temperature curves of composition of 8020 and commercial propane seemed to overlap each other. This indicates that after 120 mins of discharging process, there was no or very little butane component left behind in the cylinder. Therefore, the LPG mixture of 80% propane was found to be sufficient enough to overcome the residue problem due to inactive butane molecules.
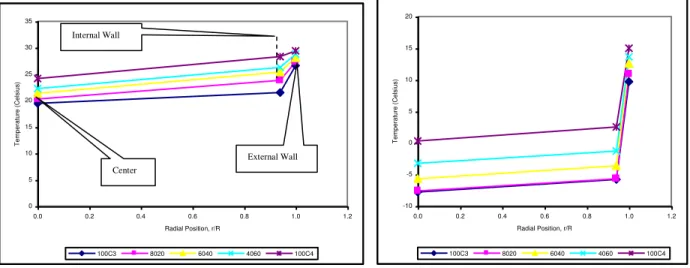
3.1.2 Radial Direction
Figure 8 shows variation in temperature profiles for various LPG mixture compositions after 10 minutes of discharging period.Based on Figure 8, there were a few characteristics that can be observed. Firstly, the reduction of temperature among the compositions varies in the gradient drop from commercial butane to commercial propane at location between the external wall and the internal wall. However, the gradient became smaller towards the centre of the cylinder. It means that, the distribution of heat from the surroundings to the internal cylinder was not equal with the heat used for the evaporation process.
0 5 10 15 20 25 30 35
0.0 0.2 0.4 0.6 0.8 1.0 1.2
Radial Position, r/R
T
emperat
ure
(C
elsi
us)
100C3 8020 6040 4060 100C4
-10 -5 0 5 10 15 20
0.0 0.2 0.4 0.6 0.8 1.0 1.2
Radial Position, r/R
Temperat
ure
(C
elsi
us)
100C3 8020 6040 4060 100C4
Figure 8 Dimensionless Radial Profile of Figure 9 Dimensionless Radial Profile of Temperature at Level 6 at 10 mins of Various Temperature at Level 6 at 120 mins of Compositions at Initial Flow Rate of 48 Various Compositions at Initial Flow Rate l/mins, Surrounding Temperature of 30oC of 48 l/mins, Surrounding Temperature
and Weight of 6 kg of 30oC and Weight of 6 kg
Secondly, at the beginning of the discharging process, the overall temperature drop in the whole system was not too high. It means that, at the early stage of discharging process the distribution of heat from the cylinder wall to the centre was distributed in a good manner and with this type of pattern profile it can be said that at the early stage of the evaporation process the sensible heat used was taken from both sources, which were the surrounding and liquid molecules as highlighted in the literature.
Thirdly, the pattern of temperature drop between the composition of 4060 and 6040 was the same from the surroundings to the centre of the cylinder but the composition of 8020 will tend to be like commercial propane towards the centre of the cylinder. However, the temperature difference among all compositions will get closer at the centre of the cylinder. It means that, the sensible heat used for evaporation process was taken mainly at the internal wall so that the heat cannot be distributed into the centre of the cylinder. This is due to the vapor film covering the surface of the internal wall and heat will be reduced since heat was transferred poorly across the low conductivity vapor film. This reason was proven through observation done during the experiment stage since a lot of bubbles were detached from the internal wall.
External Wall Internal Wall
365
The usage of sensible heat at the internal wall can be clearly explained when the discharge was further proceeded as shown in Figure 9. Based on Figure 9, there were a few characteristics that can be observed. Firstly, the reduction of temperature from external wall to the internal wall was very high compared to temperature drop from the internal wall to centre of the cylinder. This proves that the heat derived as a sensible heat for the evaporation process was not enough from the surroundings. Secondly, the pattern of temperature reductions for all the compositions were almost the same, which was very high from the external wall to the internal wall and became stagnant towards the centre of the cylinder. As previously explained, this is due to the fact that, the sensible heat used for evaporation process was taken mainly from the internal wall so that the heat cannot be distributed much into the centre of the cylinder. It means that, the distribution of heat from the surrounding to the internal cylinder was not equal with the heat used for the evaporation process. Therefore, the liquid temperatures kept decreasing towards the end of the discharging process.
Figure 9 also reveals that both temperature lines of composition of 8020 and commercial propane overlapped each other. This again indicates that after 120 mins of discharging process, there was no or very little butane component left behind in the cylinder of composition of 8020. Thus, it further supports the proposed LPG mixture of 80% propane to minimize the residue problem due to inactive butane molecules. However, the temperature level of composition of 4060 had more tendencies to behave like commercial butane compared to composition of 6040 that had more tendencies to behave like commercial propane. As previous explained, it can be suggested that the minimum amount of propane component in LPG mixture should be 60% since commercial propane was used as a reference composition.
3.2 Pressure Distribution Profile
Figure 10 shows the profile of pressure fall of various compositions at a flow rate of 48 l/mins and at surrounding temperature of 30oC. When propane content increased, the rate of pressure fall was slow even at low temperatures. This was because propane had high vapor pressure or propane molecules still possessed high kinetic energy acquired from butane molecules to escape into the vapor phase and thus gave rise to pressure. It should be noted that the initial pressure of every mixture component was not equal due to at that particular temperature every mixture has different vapor pressure level. Based on Figure 10, three important characteristics can be observed. Firstly, commercial propane had the highest degree of resistance to pressure fall followed with a less degree by compositions with increasingly less propane content. The fastest rate of fall was shown by commercial butane.
Figure 10 Cylinder Pressures of Various Compositions at Initial Flow Rate of 48 l/mins and Surrounding Temperature of 30oC
366
regulator is above 7 psi. It means that there was nothing possible to discharge of gas from cylinder. Based on the percentage of drop, it indicated that the minimum amount of propane in LPG was at 60% since it was quite close with the percentage of pressure drop of 80% propane and possible to maintain above 7 psi (0.5 bar). This condition occurred, probably, when equal content of propane molecules was present in compositions of 8020 and 6040, and in commercial butane and composition of 4060.
Thirdly, for the period at the end of the experiment, the pressure fall and pressure level for compositions 4060 and
commercial butane were almost similar. According to Raoult‟s law, this condition occurred when the content of
propane or butane molecules was almost equal. However, the fast period to empty the cylinder was the higher propane content and followed by the lesser propane content. This is because, the higher propane content posed a higher vapor pressure used for transferring phase and the higher butane content will later exist in a two phase state. Therefore, if the above statement is proven by gas chromatography analysis then the choice of more than 60% content of propane molecules in LPG is recommended. At that composition, based on the literature, propane molecules will be able to assist in increasing the kinetic energy or pressure and minimize time of transferring phase of butane molecules that coexist in the cylinder because the characteristics of both in fall of pressure were almost similar. However this is only true if the flow rate was not too high since at the higher flow rate the characteristics of fall in temperature and pressure in LPG cylinder for the whole composition were quite similar.
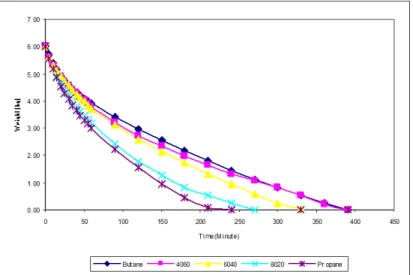
3.3 Discharging Mass
The remaining weight was assumed as a weight of liquid since the weight of vapor was too small and almost negligible which was less than one percent through out the experiment. Figure 11 illustrated the remaining weight of the various compositions at initial flow rate of 48 l/mins and the surrounding temperature of 30oC. The characteristics that can be observed based on Figure 5.42 are as follows.
Figure 11 Weight Remaining Profile of Various Compositions at Initial Flow Rate of 48 l/mins and Surrounding Temperature of 30oC
Firstly, all compositions showed similar pattern of production which was huge at the early stage and decreased at the later stage. The composition with the largest number of propane molecules showed the highest production, followed by compositions with other percentages of propane and commercial butane with the lowest production. However, at the early stage the rate of discharging mass was quite close. It is shown that, both molecules of propane and butane were equally important in the contribution of energy.
Secondly, the production rate of composition of 4060 and commercial butane was almost similar at the third quarter of the experiment period. It means that the instantaneous residue of composition of 4060 was slightly similar with commercial butane. In other words, heat energy for both compositions at the later stage was slightly similar then there was not benefit of introducing propane except at second quarter period.
367
Fourthly, both compositions of 8020 and commercial propane had similar production rate except from second quarter to the end of the experiment period. It clearly shows that from the second quarter to the end the production rate, it was influenced by the existence of butane molecules albeit a smaller quantity. So that, this characteristic depended on the total propane molecules still available in the cylinder as explained in the previous section that is the role of propane molecules on pressure, density as well as two phase state[13]. This is because pressure is the main function in the process of mass production[14]. Based on the above characteristics, once again this is an indication that 60% or more of propane content should be considered in the planning of compositional design since with that percentage it did not show such sudden decrease in production rate till the end of the production.
4. CONCLUSION
The compositions of propane of 60% or more must be considered in the planning of the design of liquefied petroleum gas composition for use in Malaysia to achieve reasonable residue amount. The temperature drop holds the key to cylinder performance. During discharging phase, one of the parameter that influence the temperature drop is gas composition. One of the useful methods to analyze heat distribution in a cylinder is based on the dimensionless analysis, which is on the basis of axial and radial flow directions since it will provide a clear picture on the cylinder thermal behavior. The dominant heat derived for the evaporation process is through axial direction compared to radial direction at the regions adjacent to the surface of internal wall. It means that the major source of heat contributed into the evaporation process is liquid molecules. Therefore, the correct composition shall be considered to enhance the evaporation performance.
5. REFERENCES
[1] Leary, F (1980) “Liquefied Petroleum Gas : Gasfitting” 1st Ed. Victoria : Wike and Company Limited
[2] Dokupil, M., Spitta, C., Mathiak, J., Beckhaus, P. and Heinzel, A. (2006). Compact Propane Fuel Processor for Auxiliary Power Unit Application. Journal of Power Sources. Vol.157:906-913.
[3] Zainal Zakaria and Azeman Mustafa. (2009). Gas Reticulation Optimisation for Domestic Sector in Malaysia. International Journal of Oil, Gas and Coal Technology. Vol. 3. No.2: 170-181
[4] Chen, Z. Konno, M. and Goto, S. (2001). Study on Homogenous Premixed Charge CI Engine Fueled with LPG. Japan of Society of Automotive Engineers. Vol. 22: 265 – 270.
[5] Karamangil, M.I. (2006). Development of the Auto Gas and LPG Powered Vehicle Sector in Turkey: A Statistical Case Study of the Sector for Bursa. Energy Policy. Article in Press.1-10.
[6] Purkayastha, B. and Bansal, P.K. (1998). An Experimental Study on HC290 and a Commercial Liquefied Petroleum Gas Mix as Suitable Replacements for HFC22. International Journal of Refrigeration. Vol. 21: 3 – 17.
[7] Nor Maizura Yusoff (1994). Kesan Silinder Terhadap Pengaruh Peruwapan GPC Dalam Silinder Domestik. Tesis Sarjana Muda (in Malay). Universiti Teknologi Malaysia:.
[8] Ditali, S., Colombi, M, Moreschini, G. and Senni, S. (2000). Consequence Analysis in LPG Installation using an Intergrated Computer Package. Journal of Hazardous Materials. Vol. 71; 159 – 177.
[9] Che Badrul Hisham (1994) “Pengukuran Secara Kualitatif Baki Gas Petroleum Cecair” Tesis Sarjana
Muda, Universiti Teknologi Malaysia
[10] Dick, M.N., and Tims, M.H. (1970). The Prediction of Vapour Off Take Rates from LPG Cylinders.
Journal of Institute of Fuel. Vol. 12: 407 – 412.
[11] Zainal Zakaria and Azeman Mustafa. (2010). The Effect of Surrounding
Temperature on Liquefied Petroleum Gas Behaviour during Exhaustion Process. International Journal of Oil, Gas and Coal Technology. Vol. 3. No.2: 170-181.
[12] Muhammad Noorul Anam Mohd Norudin. (2002). A Study on the Effect of Insertion System on the Evaporation of LPG from Commercial Storage Cylinder. Masters Thesis Universiti Teknologi Malaysia [13] Chumber, P. (2002). Vessels Outflow Sensitivity to Composition. Journal of Loss Prevention in the
Process Industries. Vol. 15: 205 – 212.
![Figure 1 Schematic diagram of the study rig [3]](https://thumb-eu.123doks.com/thumbv2/123dok_br/18282970.345785/2.918.189.705.472.827/figure-schematic-diagram-study-rig.webp)