Hemodynamic Changes of the Middle
Hepatic Vein in Patients with Pulmonary
Hypertension Using Echocardiography
Dan Dan Sun1,2☯, Chuan Ju Hou3☯, Li Jun Yuan2, Yun You Duan2*, Ying Hou2, Fang Ping Zhou4*
1Department of Stomatology and Medical Imaging, Jilin Medical College, Jilin, Jilin Province, China, 2Department of Ultrasound Diagnosis, Tangdu Hospital of the Fourth Military Medical University, Xi’an, Shaanxi Province, China,3Department of Congenital Heart Disease Internal, General Hospital of Shenyang Military Area Command, Shenyang, Liaoning Province, China,4Department of Ultrasound Diagnosis, Affiliated Hospital of Jilin Medical College, Jilin, Jilin Province, China
☯These authors contributed equally to this work.
*[email protected](FPZ);[email protected](YYD)
Abstract
The aim of this study was to analyze the changes of the middle hepatic vein (MHV) spectra in patients with pulmonary hypertension (PH) caused by congenital heart disease (CHD) and determine the proper parameters of MHV to predict PH. Eighty patients with CHD were included, whose pulmonary artery pressure was measured via right heart catheterization, and the MHV spectra were detected via echocardiography. The peak value of velocity (V) and velocity time integral (VTI) of the waves, including S wave, D wave and A wave, were measured at the end of inspiration. The values of the MHV parameters that were predictive of PH were evaluated and their cut-off points were determined. Compared with the control group, V of S wave (S), VTI of S wave (SVTI), V of D wave (D), VTI of D wave (DVTI) de-creased and V of A wave (A), VTI of A wave (AVTI), A/S, AVTI/SVTI, A/(S+D), AVTI/ (SVTI +DVTI) increased in the PH group. These differences were statistically significant (P<0.05).
A correlation analysis determined that the ratios of A/S, A/(S+D), AVTI/(SVTI+DVTI) were positively correlated with pulmonary artery mean pressure (r=0.529,0.575,0.438,P<0.001).
An ROC curve analysis determined that the diagnostic effect of A/(S+D) was superior to the other two parameters. On the ROC curve, when the ratio of A/(S+D) was 0.30, the sensitivity was 85.37% and specificity was 75.00% for predicting PH. The spectral parameters of MHV, including the ratios of A/S, A/(S+D) and AVTI/(SVTI+DVTI), increased with increasing pulmonary pressure in CHD patients. When the ratio of A/(S+D) was 0.30 in MHV spectra, it had sufficient sensitivity and specificity for diagnosing PH, and this method could be used as a new non-invasive complementary echocardiographic parameter for predicting PH. a11111
OPEN ACCESS
Citation:Sun DD, Hou CJ, Yuan LJ, Duan YY, Hou Y, Zhou FP (2015) Hemodynamic Changes of the Middle Hepatic Vein in Patients with Pulmonary Hypertension Using Echocardiography. PLoS ONE 10(3): e0121408. doi:10.1371/journal.pone.0121408
Academic Editor:Yunchao Su, Georgia Regents University, UNITED STATES
Received:November 23, 2014
Accepted:February 1, 2015
Published:March 30, 2015
Copyright:© 2015 Sun et al. This is an open access article distributed under the terms of theCreative Commons Attribution License, which permits unrestricted use, distribution, and reproduction in any medium, provided the original author and source are credited.
Data Availability Statement:All relevant data are within the paper.
Introduction
The estimated prevalence of congenital heart disease (CHD) is approximately 6–10 per 1,000 live births [1]. CHD-associated pulmonary hypertension (PH) is a frequent complication of CHD, particularly in patients with left-to-right shunts [2]. Because it is an important indepen-dent risk factor for CHD, early diagnosis of PH is essential to iindepen-dentify patients at high risk to treat and modify the etiologic substrate [3]. PH is defined as a mean pulmonary artery pressure (MPAP)25 mmHg by right heart catheterization (RHC) at rest [4]. Due to its invasive char-acter, RHC cannot be used as a routine screening method. Echocardiography is a widely avail-able and accepted noninvasive diagnostic method to evaluate pulmonary artery pressure (PAP). Systolic pulmonary arterial pressure (SPAP) is detected using the tricuspid regurgita-tion (TR) velocity and modified Bernoulli equaregurgita-tion. Transthoracic echocardiography measure-ment depends on a good TR signal, which is not present in all patients [3,5]. Currently, by taking the other echocardiographic performances of PH together and using multi-parameter comprehensive assessment methods can improve the accuracy of PH diagnosis [6].
In patients with PH, the right atrial (RA) pressure is maintained at a high level during breathing and cardiac cycles because the blood flow to the right ventricle is limited. Then, the blood flows of the large veins that are connected to the RA are affected. An examination of the inferior vena cava (IVC) diameter and its change with respiration is the most commonly used technique to estimate RA pressure [7]. However, the detection of the IVC spectra using Dopp-ler echocardiography is influenced by the large angle degree between the ultrasound beam and IVC blood flow [8]. The flow velocity and waveform morphology of middle hepatic vein (MHV) is closely related to RA pressure and it has a smaller angle than the IVC. We hypothe-sized that the hemodynamic changes of the MHV may be used to predict PAP. The aim of this study was to determine the characteristic change in the Doppler MHV flow velocity pattern in patients with CHD who underwent a clinically driven RHC.
Methods
Ethics Statement
This study complied with the Declaration of Helsinki. All participants provided written in-formed consent and the Ethics Committee of the Fourth Military Medical University and Gen-eral Hospital of Shenyang Military Area Command approved the conduct of this study.
Subjects
80 consecutive patients (mean age: 37.3±14.7 years, 31 (38.75%) male gender, BMI 21.65±2.85 kg/m2) with CHD undergoing RHC and echocardiography between January 2012 and June 2013 were included in this study. The subjects included 35 cases of atrium septal defect (ASD), 22 cases of ventricular septal defect (VSD), 18 cases of patent ductus arteriosus (PDA) and 5 cases of VSD combined with PDA. All the included patients had no history or clinical symp-toms of liver disease and had normal liver function as determined via serology analysis. Pa-tients with arrhythmias, pericardial effusion (moderate and severe) were excluded from the study.
Right Heart Catheterization
RHC was performed in the cardiac catheter laboratory under radiographic guidance (GE, Innova 3100) immediately after echocardiography. RHC was performed by placing a triple-lumen, a polygraph recorder (Philips, made in Poland) and a right cardiac catheter (Cordis, Johnson company) through the femoral vein to measure the pressure of the RA, right ventricle Competing Interests:The authors have declared
and pulmonary artery. Then SPAP, MPAP and diastolic pulmonary artery pressure (DPAP) were recorded.
Echocardiography
The subjects were studied using a Phillips iE33 ultrasound device equipped with an S5-1 trans-ducer operating at 2.5–3.5 MHz or a GE Vivid E9 ultrasound device equipped with an M5S transducer operating at 2.0–4.5 MHz. An electrocardiogram was recorded simultaneously in all subjects.
In all patients who had fasted for 8 hours, a gray-scale B-mode evaluation of the liver was first performed, followed by color and spectral Doppler evaluation, using the intercostal or sub-costal approaches. The Doppler gate was placed in non-forced end inspiration so that it would sample the MHV 2–4 cm from the orifice of the IVC [9]. The Doppler parameters were opti-mized by following the principles and techniques described in reviews by Scheinfeld et al [9] and Kruskal et al [10]. The angle of the ultrasound beam to MHV blood flow was less than 60°. The maximal flow velocity (V) and the velocity time integral (VTI) of ventricular systolic (S, SVTI), ventricular diastolic (D, DVTI) and atrial reversal (A, AVTI) waves were measured. All measurements were performed and averaged on five cardiac cycles to obtain the final results.
Statistical analysis
Statistical analysis was performed using SPSS version 16.0 (IBM SPSS Statistics, USA). Contin-uous data are expressed as the mean ± standard deviation (SD). The independent samples
t-test was used to compare variables between the PH group and control group. Correlations
were examined via Pearson bivariate correlations. The comparison of the parameters and the selection of the cut-off point for PH diagnosis were tested using a receiver operator characteris-tic curve (ROC curve). A value ofP<0.05 was regarded as statistically significant andP<0.01 was considered extremely statistically significant.
Results
Demographics and RHC characteristics of the study population
A total of 80 patients were enrolled in the study. 28 cases were in the control group, and the others were in the PH group based on the diagnostic criteria (MPAP25 mmHg). Between the patients of the two groups, there were no significant differences in demographics, such as age, sex, heart rate or body mass index (BMI) (Table 1). The RHC data determined that the SPAP, MPAP and diastolic pulmonary artery pressure (DPAP)were statistically significantly higher than the control group (P<0.001,Table 1).
MHV waveform morphology
Table 1. Demographics and RHC Characteristics of the Study Population.
Control group PH group t P
n 28 52
Sex(M/F) 12/16 19/33
Age(year) 37.50±15.49 37.20±14.37 0.085 0.933
Heart rate(bmp) 75.50±10.04 82.59±12.33 -1.589 0.142
BMI(kg/m2) 21.27±2.66 21.09±3.44 0.240 0.811
MPAP(mmHg) 19.26±3.01 59.53±25.48 -8.535 <0.001
SPAP(mmHg) 32.58±6.38 91.60±35.86 -8.762 <0.001
DPAP(mmHg) 10.52±2.76 42.54±22.66 -7.557 <0.001
Notes: All values are expressed as the mean±SD. RHC, right heart catheterization; PH, pulmonary hypertension; n, number; BMI, body mass index; MPAP, mean pulmonary artery pressure; SPAP, systolic pulmonary arterial pressure; DPAP, diastolic pulmonary artery pressure.
doi:10.1371/journal.pone.0121408.t001
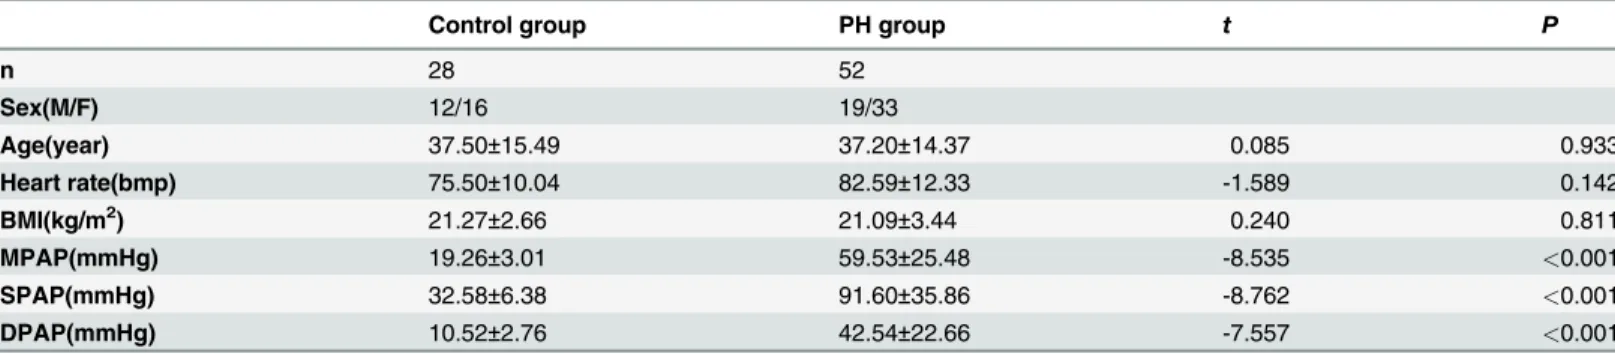
Fig 1. Tri-phasic Doppler flow spectra of the middle hepatic vein (MHV) in the control group.Doppler spectra of MHV obtained from a patient with atrial septal defect with the mean pulmonary artery pressure (MPAP) of 13 mmHg. The tri-phasic waveform includes ventricular systolic (S wave), ventricular diastolic (D wave) and atrial reversal (A wave) waves.
Spectral parameters of MHV
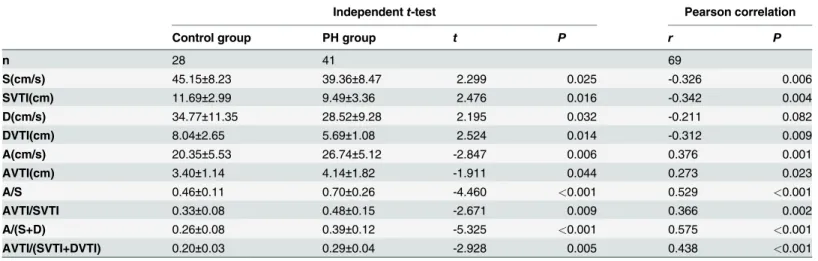
Compared with controls, the PH group had a higher value of A, AVTI, A/S, AVTI/SVTI, A/(S +D) and AVTI/(SVTI+DVTI) (P<0.05). The PH group also had a lower value of S, SVTI, D, DVTI compared with the control group (P<0.05) (Table 2,Fig. 1,Fig. 2).
There were correlations between MPAP and A/S (r= 0.529,P<0.001), A/(S+D) (r= 0.575, P<0.001) and AVTI/(SVTI+DVTI) (r= 0.438,P<0.001) (Table 2,Fig. 5). In the PH group,
there were weak correlations between MPAP and A/S, A/(S+D) and AVTI/(SVTI+DVTI) (r= 0.366,P= 0.010;r= 0.397,P= 0.010;r= 0.377,P= 0.015).
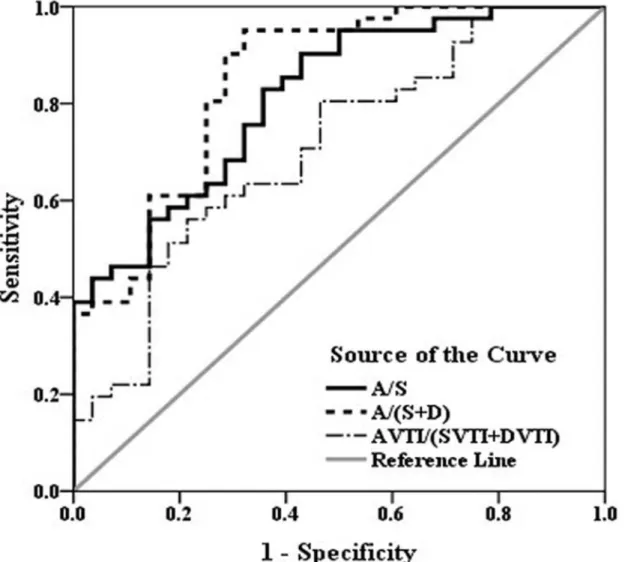
The ROC curve determined that the ratio of A/(S+D) had the largest area under curve (AUC) (A/(S+D) 0.84 vs. A/S 0.81 vs. AVTI/(SVTI+DVTI) 0.70). A cut-off value of A/(S+D) = 0.30 had a sensitivity and specificity of 85.37% and 75.00%, respectively, for the prediction of elevated MPAP (Fig. 6).
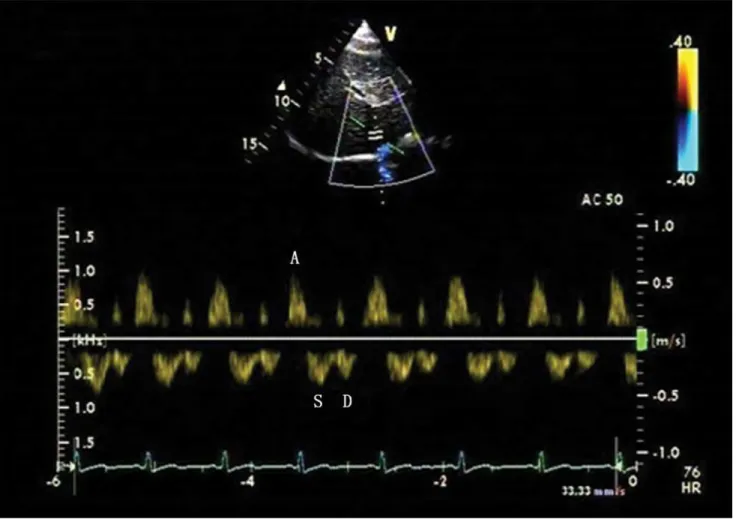
Fig 2. Four-phasic Doppler flow spectra of the MHV in the pulmonary hypertension (PH) group.Doppler spectra of MHV obtained from a patient with ventricular septal defect with the MPAP of 80 mmHg. The four-phasic waveform includes S wave, D wave, A wave and ventricular reversal (V wave) waves. Compared with the control group, the spectra had a higher value of the peak flow velocity and the velocity time integral (VTI) of A wave, and a lower value of peak flow velocity and VTI of S wave and D wave.
Discussion
Our results demonstrated that the hemodynamic changes of the MHV were characteristic in CHD patients with PH and that the observation of MHV spectral indicators could provide a reference for PH diagnosis.
MHV waveform morphology
The morphology and flow velocity of the MHV is related to RA pressure, IVC pressure, the flexi-bility of the liver parenchyma and pressure changes in the abdominal and thoracic cavity caused by breathing. When the impact of liver disease and breathing had been excluded, the RA pressure directly affected IVC pressure; therefore, it played a decisive role on changing the MHV spectra.
The Doppler flow spectra of MHV is primarily composed of two distinct forward systolic and diastolic waves (S wave and D wave) during ventricular systole and early diastole, and two small reverse flow during late ventricular systole and atrial systole (V wave and A wave). It is described as four-phasic waveform. However, the V wave is transitional, which may be ante-grade, retroante-grade, or neutral [9]. Healthy individuals almost always have normal tri-phasic liver vein Doppler curves [11], i.e., two antegrade waves and one retrograde wave (S wave, D wave and A wave). Therefore, we analyzed the spectral parameters of these three waves.
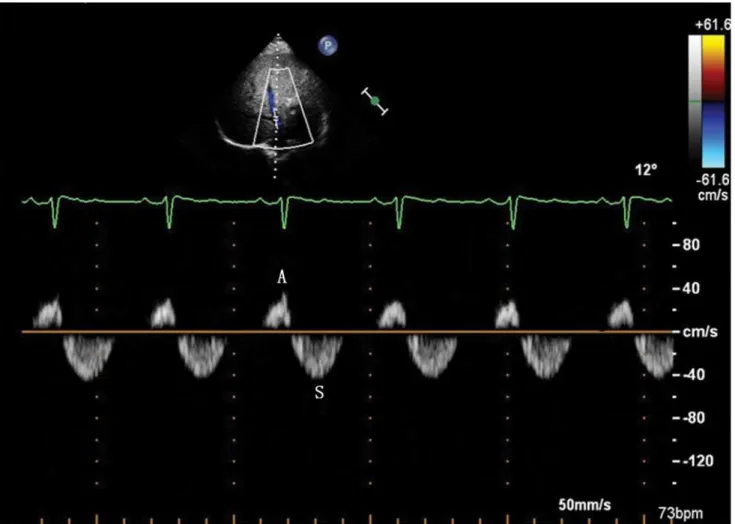
Fig 3. Bi-phasic Doppler flow spectra of the MHV in the PH group.Doppler spectra of MHV obtained from a patient with patent ductus arteriosus with the MPAP of 96 mmHg. The bi-phasic waveform of MHV includes S wave and A wave.
The ultrasound showed a bi-phasic waveform in 9 patients with PH. In 11 out of total 52 pa-tients with PH, the D wave was not available. The prolongation of the right heart isovolumic re-laxation time (IVRT) in PH patients led to a delay in tricuspid valve opening, which delayed the onset of diastole in the right heart. The Doppler spectra of hepatic veins revealed a blunted or absent diastolic velocity (D wave). The absence of the D wave strongly suggested the pres-ence of significant PH, specifically when other echocardiographic PH findings were absent or uninformative [12].
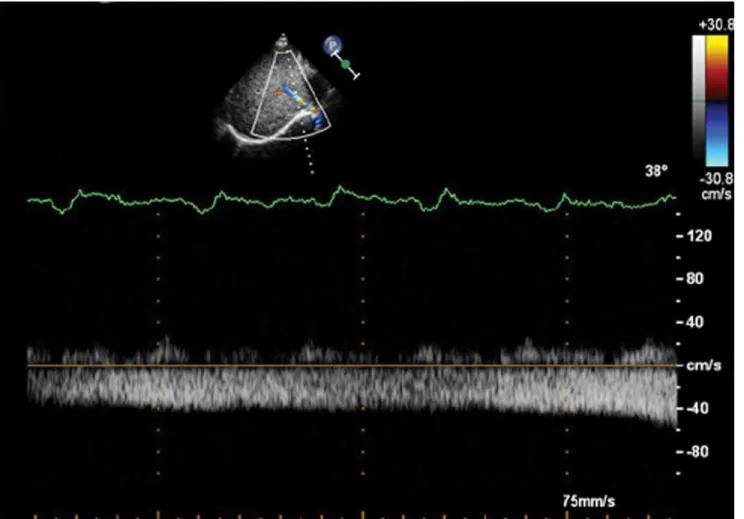
In the PH group, two patients had mono-phasic Doppler waveform without a retrograde flow phase in the MHV. There were no patients with cirrhosis as determined via serology anal-ysis and ultrasound check in all the subjects. The mono-phasic waveform reflected an increased stiffness of the liver parenchyma around the liver veins [13], and a decreased compliance of he-patic veins. They might be caused by the elevation of RA pressure and the congestion of the hepatic venous.
Spectral parameters of MHV
Along with the increasing of RA pressure, the flow reversed to vena cava in right atrial systole. In the spectra waveform of MHV, it showed as a reverse A wave. In the PH group, the RA pres-sure had a further elevation, which leading to a trend of increasing of the reverse flow. The
Fig 4. Mono-phasic Doppler flow spectra of the MHV in the PH group.Doppler spectra of MHV obtained from a patient with atrial septal defect with the MPAP of 33 mmHg. The waveform of MHV is flat and mono-phasic.
velocity (V) and volume (VTI) of A wave increased along with the increasing of RA pressure. The spectral data of tri-phasic waves demonstrated that A and AVTI increased in the PH group and these differences were statistically significant in the severe group. Zhang-An et al [14] reported a similar trend in 21 secondary PH patients caused by dilated cardiomyopathy,
Table 2. Changes of MHV Spectral Parameters in the PH group.
Independentt-test Pearson correlation
Control group PH group t P r P
n 28 41 69
S(cm/s) 45.15±8.23 39.36±8.47 2.299 0.025 -0.326 0.006
SVTI(cm) 11.69±2.99 9.49±3.36 2.476 0.016 -0.342 0.004
D(cm/s) 34.77±11.35 28.52±9.28 2.195 0.032 -0.211 0.082
DVTI(cm) 8.04±2.65 5.69±1.08 2.524 0.014 -0.312 0.009
A(cm/s) 20.35±5.53 26.74±5.12 -2.847 0.006 0.376 0.001
AVTI(cm) 3.40±1.14 4.14±1.82 -1.911 0.044 0.273 0.023
A/S 0.46±0.11 0.70±0.26 -4.460 <0.001 0.529 <0.001
AVTI/SVTI 0.33±0.08 0.48±0.15 -2.671 0.009 0.366 0.002
A/(S+D) 0.26±0.08 0.39±0.12 -5.325 <0.001 0.575 <0.001
AVTI/(SVTI+DVTI) 0.20±0.03 0.29±0.04 -2.928 0.005 0.438 <0.001
Notes: All values were expressed as the mean±standard deviation. MHV, middle hepatic vein; S, systolic peakflow velocity; D, diastolic peakflow velocity; A, atrial reverse peakflow velocity; SVTI, systolicflow velocity time integral; DVTI, diastolicflow velocity time integral; AVTI, atrial reverseflow velocity time integral.
doi:10.1371/journal.pone.0121408.t002
Fig 5. Correlation of the MHV A/(S+D) ratio with invasive MPAP.There was a significant correlation between MPAP and A/(S+D) (r= 0.575,P<0.001).
(S, systolic peak flow velocity; D, diastolic peak flow velocity; A, atrial reverse peak flow velocity).
valve disease, coronary artery disease and other diseases. They suggested that the most obvious change in the hepatic venous flow in patients with PH was noted in the A wave. Because pa-tients with PH usually had higher RV end diastolic pressure, the RA must contract with greater force to drive blood into the RV. This resulted in increased RA pressure, leading to an augmen-tation of the retrograde blood flow into the great veins. In addition, we speculated that the long-term pressure overload led to RV hypertrophy, which may reduce RV relaxation during early diastolic, which limits rapid RA filling. The RA then expanded during late diastolic due to increased capacity. The compensatory contraction of RA myocardial fibers increased due to the Frank-Starling effect, which increased venous reflux velocity and made the A wave higher.
In ventricular systole and early diastole, the increased PAP and RV pressure hindered the venous returning to RA (S wave and D wave), resulting in the decreases of blood flow in veloci-ty (V) and volume (VTI). Our results also demonstrated the reduction of venous velociveloci-ty
Fig 6. ROC curve of A/S, A/(S+D) and AVTI/(SVTI+DVTI) for predicting PH (MPAP25 mmHg).The diagnostic effect of the A/(S+D) radio is superior to the other three parameters. On the ROC curve of A/(S+D), the point that has the biggest Youden index is determined to be the cut-off point (0.30 with a sensitivity of 85.37% and specificity of 75.00%). (SVTI, systolic flow velocity time integral; DVTI, diastolic flow velocity time integral; AVTI, atrial reverse flow velocity time integral).
towards the heart. The velocity and VTI of the S wave and D wave decreased in the PH group and these differences were statistically significant in the severe group. In a study by Zhang LZ et al [15] in 28 CHD patients with PH, they reported S, D, SVTI, DVTI significantly decreased in the PH group. The increase of RAMP enabled the decrease of RA compliance, which de-creased venous velocity. We hypothesize that this phenomenon may be the most important reason for the reduction of S.
Due to the changes of the A wave, S wave and D wave, the ratios of A/S, A/(S+D) and AVTI/(SVTI+DVTI) would be even more sensitive indicators to evaluate PH. The spectral data of the tri-phasic waves demonstrated that all three ratios were correlated with MPAP. Zhang LZ [15] reported that evaluating PH with (A+V)/(S+D) or (AVTI+VVTI)/(SVTI +DVTI) resulted in better sensitivity and specificity (r= 0.706, 0.651,P<0.01). Zhang-An et al [14] also noted that AVTI/(SVTI+DVTI) was higher in the PH group. Our study expanded the sample size to evaluate the diagnostic effect of Doppler parameter changes in the MHV in PH and determined the cut-off point for diagnosis. When the ratio of A/(S+D) was equal to 0.30, it had a sensitivity and specificity of 85.37% and 75.00%, respectively, for the prediction of elevat-ed MPAP.
The influence of TR
TR is a common complication in patients with PH. There were 9 patients (11.25%) without TR, and one of them was from the control group. Er F et al [3] found that about 6% of patients did not have analyzable TR in their clinical trial with 241 consecutive patients from the cardiol-ogy department. It would have a more important clinical value to evaluate the PH of patients who don’t have accompanied with TR.
However, TR can also influence the hemodynamic parameters of the returning venous. Dur-ing systole the RA pressure suddenly increases, which is caused by TR flowDur-ing into the RA. This process could decrease the flow of the S wave, as well as interrupt or even reverse the S wave [10]. There were 8 cases in the PH group whose S wave was smaller than the D wave; these cases were all associated with a moderate or severe degree of TR. However, the retrograde of the S wave was not observed in our study. The decreasing of RV relaxation at early diastolic caused limited RA emptying, thus decreasing the speed of venous return, which resulted in the reduction of D wave. Furthermore, the extending of isovolumic relaxation due to TR would lead to increased RA pressure and volume at the early rapid emptying phase. This process would affect the venous return and decrease the D wave. However, the reduction effect of TR was more obvious in the S wave than the D wave.
Operating precautions
obesity and other reasons, the images acquired through the intercostal window would be supe-rior. Additionally, the spectra would not affected by the pressure of the probe.
Limitations
First, the Doppler and RHC studies were not simultaneous, although the delay between the two examinations was always less than one day and there was no change in the clinical condition or treatment between the two studies. Second, all subjects included in this research were CHD pa-tients with left to right shunts. It is necessary to examine larger samples and different diseases in future research to verify our results.
Conclusions
We concluded that MHV hemodynamic changes could be a useful method for evaluating PH. This method could counteract the weakness of the currently used diagnostic methods and im-prove the accuracy of assessing PAP when combined with other methods.
Author Contributions
Conceived and designed the experiments: YYD FPZ DDS. Performed the experiments: DDS CJH LJY YYD YH FPZ. Analyzed the data: DDS YH. Contributed reagents/materials/analysis tools: DDS YYD. Wrote the paper: DDS LJY.
References
1. Diller GP, Gatzoulis MA. Pulmonary vascular disease in adults with congenital heart disease. Circula-tion. 2007; 115:1039–1050. PMID:17325254
2. Jiang X, Jing ZC. Epidemiology of pulmonary arterial hypertension. Curr Hypertens Rep. 2013; 15:638–649. doi:10.1007/s11906-013-0397-5PMID:24114080
3. Er F, Ederer S, Nia AM, Caglayan E, Dahlem KM, Semmo N, et al. Accuracy of Doppler-echocardio-graphic mean pulmonary artery pressure for diagnosis of pulmonary hypertension. PloS One. 2010; 5: e15670. doi:10.1371/journal.pone.0015670PMID:21179417
4. GalièN, Hoeper MM, Humbert M, Torbicki A, Vachiery JL, Barbera JA, et al. Guidelines for the diagno-sis and treatment of pulmonary hypertension: the task force for the diagnodiagno-sis and treatment of pulmo-nary hypertension of the European Society of Cardiology (ESC) and the European Respiratory Society (ERS), endorsed by the International Society of Heart and Lung Transplantation (ISHLT). Eur Heart J. 2009; 30: 2493–2537. doi:10.1093/eurheartj/ehp297PMID:19713419
5. Zimbarra Cabrita I, Ruı´sanchez C, Grapsa J, Dawson D, North B, Pinto FJ, et al. Validation of the
iso-volumetric relaxation time for the estimation of pulmonary systolic arterial blood pressure in chronic pul-monary hypertension. Eur Heart J Cardiovasc Imaging. 2013; 14: 51–55. doi:10.1093/ehjci/jes093 PMID:22588209
6. McGoon MD, Kane GC. Pulmonary hypertension: diagnosis and management. Mayo Clin Proc. 2009; 84:191–207. doi:10.1016/S0025-6196(11)60828-8PMID:19181654
7. Brennan JM, Blair JE, Goonewardena S, Ronan A, Shah D, Vasaiwala S, et al. Reappraisal of the use of inferior vena cava for estimating right atrial pressure. J Am Soc Echocardiogr. 2007; 20:857–861. PMID:17617312
8. Laaban JP, Diebold B, Lafay M, Rochemaure J, Peronneau P. Detection of pulmonary hypertension by Doppler echocardiography of the inferior vena cava in chronic airflow obstruction. Thorax. 1989; 44:396–401. PMID:2763238
9. Teichgräber UK, Gebel M, Benter T, Manns MP. Duplex ultrasound characterization of hepatic vein blood flow in healthy probands. Ultraschall Med. 1997; 18:267–271. PMID:9491494
10. Scheinfeld MH, Bilali A, Koenigsberg M. Understanding the spectral Doppler waveform of the hepatic veins in health and disease. Radiographics. 2009; 29: 2081–2098. doi:10.1148/rg.297095715PMID: 19926763
12. Fadel BM, Husain A, Alassoussi N, Dahdouh Z, Mohty D. Spectral Doppler of the hepatic veins in pul-monary hypertension. Echocardiography. 2015; 32: 170–173. doi:10.1111/echo.12710PMID: 25091801
13. Bolondi L, Li Bassi S, Gaiani S, Zironi G, Benzi G, Santi V, et al. Liver cirrhosis: changes of Doppler waveform of hepatic veins. Radiology. 1991; 178:513–516. PMID:1987617
14. Zhang An, Himura Y, Kumada T, Hayashida W, Ishikawa N, Noda M, et al. The characteristics of hepat-ic venous flow velocity pattern in patients with pulmonary hypertension by pulsed Doppler echocardiog-raphy. Jpn Circ J. 1992; 56:317–324. PMID:1578603
15. Zhang LZ, Zhang AH, Qiu PC, Zhao XL, Feng CL. Evaluation of pulmonary hypertension by the changes of hepatic vein flow Doppler spectrum. Chin J Ultrasonogr. 1995; 4:15–18.