based on fuzzy systems
M. Haberler-Weber
Institute for Geodesy and Geophysics, Vienna University of Technology, Austria
Received: 18 July 2005 – Revised: 20 September 2005 – Accepted: 20 September 2005 – Published: 6 October 2005
Part of Special Issue “Documentation and monitoring of landslides and debris flows for mathematical modelling and design of mitigation measures”
Abstract. To place high precision geotechnical sensors ex-actly at the boundaries between blocks with different direc-tions and rates of movement in a sliding area, it is important to detect these boundaries in a preceding step. An automated algorithm for the block detection based on fuzzy systems is presented. Combining objective geodetic indicators with fuzzy systems gives a powerful tool for the assessment of geodetic landslide monitoring data. The example of a land-sliding area shows the applicability of the algorithm.
1 Introduction
Deformation measurements on landslides are a very impor-tant task in nowadays engineering geodesy. The classical idea is that the landslide has to be represented by discrete measuring points in such a way that the deformations of the sliding area can be reconstructed by the measured displace-ments of those points (Fig. 1, Pelzer, 1985). The measure-ments (tacheometric, GPS, . . . ) are done in at least two epochs, where the time interval between the epochs is de-pendent on the deformation rate.
In case some of the observed points are located in the sta-ble area (serving as reference points), absolute displacements can be determined; otherwise only relative movements can be calculated.
In the classical geodetic deformation analysis, the geodetic measurements of at least two epochs are used to assess the displacements of the object points with statistical methods. So it can be stated, which points have statistically significant displacements. Most of the time, these displacement vectors and their graphical representation are the final results of the geodetic investigations, see Fig. 2 for an example (Pelzer, 1985).
Correspondence to:M. Haberler-Weber (michaela.haberler-weber@tuwien.ac.at)
But for many applications, a deeper insight is necessary. One task is to find various blocks with similar pattern of movement based on a set of displacement vectors of dis-crete points given by the deformation analysis. This has been done up to now with different strategies, like further statisti-cal analysis (Welsch, 1983) or pattern recognition techniques (Lehmk¨uhler, 1993). But up to now it was not possible to au-tomate this process.
Motivation for this work is the project OASYS, a multidis-ciplinary project for an integrated Optimization of landslide Alert SYStems. Landslide risk analysis and in the following a landslide alert system are of interest for scientists of many disciplines today. Therefore, the aim of OASYS is to collect as much information as possible from different disciplines (e.g. geodesy, geology, hydrology, remote sensing, . . . ), so that the information can be used within a knowledge based system to assess the further development of the sliding area and to define the landslide risk. At the end a clear decision should be possible to inform the affected inhabitants whether an evacuation is necessary.
The concept of OASYS is based on three different steps. In a first step large scale monitoring (e.g. by satellite tech-niques) has to be performed to find the landslide prone areas. Geodetic deformation measurements are carried out to get information on the block movement and on the boundaries between stable and unstable areas (see Fig. 3).
In a second step, in the areas found, high precision geotechnical measurement systems are installed. This multi-sensor system is logging data continously and can therefore feed a real-time alert system. The third step consists of the risk assessment and handling of the alert system. This final analysis for the risk assessment is supported by knowledge based systems, using multidisciplinary data from the preced-ing steps (see Fig. 4).
Fig. 1.Object points representing the object under investigation are connected by geodetic measurements, taken from Pelzer, 1985.
Fig. 2. Graphical representation of the displacement vectors for each object point as the result of the geodetic deformation analysis, taken from Pelzer, 1985.
Fig. 3.Geodetic measurements connecting the object points shown here are used to find the critical areas of the landslide prone area.
directions have to be found, so that in the following step the geotechnical sensors mentioned above can be installed across these boundaries to get high precision monitoring data of the critical areas as an input for the knowledge based system for the risk assessment.
In the last few years, modern techniques like fuzzy sys-tems, neural networks and knowledge based systems started to be used also in geodesy (see e.g. Heine, 1999; Miima, 2002; Wieser, 2002). One advantage of these methods is that they can reproduce the human way of thinking, so that problem solving is done in a rather intuitive way. Some
un-Fig. 4.Geotechnical monitoring is serving as the basis for the real-time alert system.
solved problems in geodesy are now further investigated, us-ing these new techniques. Here a modern method for the automated detection of consistent block deformation based on fuzzy techniques is presented.
2 Fuzzy systems
With a fuzzy system the decision process of a human expert can be modelled. By defining input and output variables and rules connecting them the human way of thinking can be re-produced. Mathematical basics of the fuzzy theory cannot be given here, for further information see e.g. Kruse et al., 1995.
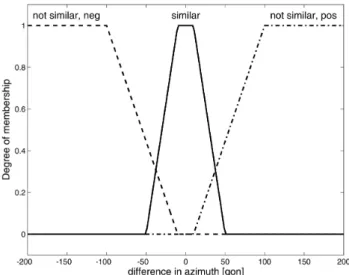
Fig. 5. Modelling of the input variable “similarity of direction” in the fuzzy systems by 3 linguistic terms.
If direction is not
similar (positive) then block quality is very low The number of rules in each fuzzy system depends of course on the number and the modelling of the input and out-put parameters. Each rule results in a fuzzy set; within the step of aggregation all these sets are combined (e.g. by the method of the maximum-operator), then the defuzzification is done with the help of e.g. the center of gravity-method to get one sharp output value as a result.
3 Block detection algorithm
At the end of the classical deformation analysis, a set of dis-placement vectors for the observed points on the landslide area is given. The task is to find groups of points with a simi-lar pattern of movement so that the boundaries between these blocks can be identified.
Two different types of parameters are used here to do the block separation. First, geodetic influence factors are deter-mined (cf. Sect. 3.1), second, the human way of assessing a graph of displacement vectors is copied by finding dis-placement vectors with similar direction and length, which are called “visual” influence factors here (cf. Sect. 3.2). 3.1 Geodetic influence factors
The idea is to use an over-determined affine coordinate trans-formation to assess the movement of the observed points be-tween two subsequent epochs of measurements. This means that the coordinates x=(x, y)T of the points of epoch n are mapped onto the coordinatesx′= x′, y′T of the same points of epochn+1 (for details see e.g. Becker and B¨urger, 1975).
x′=F ·x+t (1)
wherex=(x, y)T ... coordinates of epoch n x′
= x′, y′T
... coordinates of epochn+1 (after deformation) t= tx, ty
T
... translational parameters F = ∂x′ ∂x ∂x′ ∂y ∂y′ ∂x ∂y′ ∂y !
... matrix of deformation
A group of points moving in the same direction (assuming that they are lying on one common block) is characterized by a small range of the residuals between the original and the transformed coordinates and a small standard deviation of
imal strain components exx, eyy (rate of change of length
per unit length in direction of x-axis respectively y-axis),exy
(=eyx, rate of shear strain) and the derived rotation angleω
(see e.g. Haberler, 2005).
A direct method of an over-determined computation of these strain parameters can follow this scheme:
uxi =x ′
i−xi =exx·xi+exy·yi +ω·yi+tx
uyi =y ′
i−yi =exy·xi+eyy·yi−ω·xi +ty (2)
resp.
u=H·p (3)
where H = x y 0x 0 y
y−x
1 0 0 1
i
p= exxexyeyyω txtyT
Since the strain parameters are dependent on the coordinate system it is better to transform them into the principal strain axes system, represented by the strain ellipse (Tissot indica-trix). The elements of the strain ellipse (the semi-axes e1,
e2and the orientationθof the maximum strain rate), which fully describe the state of deformation, are calculated from the strain parameters analogous to the geodetic point error ellipse (for further explanations see e.g. Welsch et al., 2000):
e1= 12(exx+eyy+e)
e2= 12(exx+eyy−e)
tan 2θ= 2exy
exx−eyy
(4)
withe2=(exx−eyy)2+4e2xy.
These indicators used as input parameters in the fuzzy system can be determined by the results of the sequence of affine transformations, using a minimum of four points (cf. Sect. 3.3). The following basic example (Fig. 6) shows the different values of the strain ellipse parameterse1,e2, and the standard deviation of unit weights0in two cases: in the left figure four points with almost identical displacement vectors are analysed, in the figure to the right the results for three points with equal and one point with a very different dis-placement vector are shown. Note the different scales of the strain ellipse parameters. It shows that these parameters can be used as indicators for a block separation.
3.2 Visual influence factors
Fig. 6.Indicators (s0ande1,e2)for two different cases. Displace-ments (italic, in mm), strain ellipse parameterse1ande2(bold, in ppm).
of displacement vectors. The similarity of the length and the direction of the vectors is assessed on the one hand, and the property of neighbourhood on the other hand. This ability is imitated in the block detection algorithm.
The direction of the displacement vectors is used as a first important input variable. According to human thinking it seems to be clear that only vectors showing similar direc-tions can belong to one common block. The length of the displacement vectors is used as another intuitive input pa-rameter. Since the analysis is done in 2-D, the inclination of the slope has to be taken into account for this parame-ter. Like before, two or more vectors are said to be similar if the lengths of the displacement vectors are similar. The combination of the direction and the length of the vectors gives a clear distinction which points show the same pattern of movement. In addition, the property of “neighbourhood” is determined from a Delaunay triangulation.
The example shows the modelling of the variable “similar-ity of direction” (Fig. 5). If the directions of several vectors under investigation are within a range of approximately 20 gon, they are assessed as “similar” by the fuzzy system. The greater the difference in azimuth gets, the smaller the prop-erty of “similarity”.
3.3 General algorithm
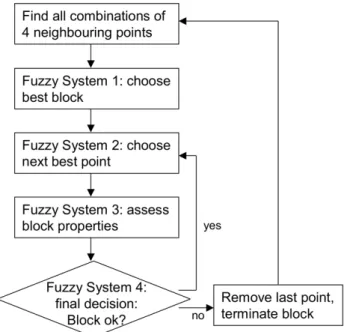
The block detection algorithm starts with finding all possible blocks consisting of four neighbouring points (see Fig. 7). A minimum of four points per block is necessary due to the over-determined calculation of the strain analysis. For all these combinations of 4 neighbouring points, the affine trans-formations are calculated and assessed by the first fuzzy sys-tem using the input parameters shown above (strain ellipse parameters, length and direction of the displacement vectors etc.). The first fuzzy system chooses the “best” set according to the input parameters and in an iterative process the best fitting neighbouring points are determined by a sequence of affine transformations (using 5, 6, 7, . . . points in these trans-formations). This iterative process is done until one of the
Fig. 7.General scheme of the block detection algorithm.
following fuzzy systems determines that the block is com-plete, i.e. that no neighbouring points with a similar pattern of movement exist. Then the algorithm starts again finding four neighbouring points out of the remaining points.
The algorithm uses four different fuzzy systems, depend-ing on the task and on the available parameters (Fig. 7):
1. In the first step of the algorithm a multitude of 4-point-combinations is formed. The first fuzzy system assesses the block quality of the various possibilities using the parameters standard deviation of unit weights0, the axes of the strain ellipsee1ande2, the direction and length of the four displacement vectors; the optimal combination is chosen as the starting block.
2. Based on this starting block, in an iterative process the next “best” point is chosen to join the block. The algo-rithm tries to find all neighbouring points to the starting block. From all possibilities the second fuzzy system has to choose the optimal one by again assessing the parameterss0, e1, e2, direction and length of the dis-placement vectors.
3. The second fuzzy system only chooses the optimal com-bination out of the several possibilities, as mentioned before. The third fuzzy system now determines in each step of iteration, if the “optimal” solution found in step 2 is still a valid block. This is done by assessing not only the parameters mentioned above, but further adding pa-rameters like the rates of change of the papa-rameterss0,
4. The last fuzzy system gives the last decision if the block has to be terminated. A clear yes/no-decision must be made. Here again not only the output value of the third fuzzy system, but also the change of these output values are used for the calculation of the final decision value.
4 Example
The example given here is based on an existing monitoring network near Varna, Bulgaria (see Pelzer and Milev, 1984). Since the monitoring network was showing no significant movement, the original displacement vectors were slightly modified for the demonstration of the algorithm. A graphical representation of the displacement vectors used is given in Fig. 8.
Looking at this Fig. 8, two blocks can intuitively be dis-tinguished. The first (northern) one consists of stable points on a plateau with small displacements (up to 3 mm between two measurements). The other points are lying on the unsta-ble part of the area, with movements of approximately 1 cm between two epochs of measurement.
Starting the algorithm, the best-fitting 4-point-combination is presented, as calculated from the strain analysis: 2 – 10 – 13 – 15, with an output value of 0.84 of the first fuzzy system. The output value – within a range of (0,1) – can be interpreted as the “quality” of this block: the higher the output value, the “better” the combination. These four points show a very similar pattern of the direction of the vectors; the small differences in length are causing acceptable small strain parameters.
In the next steps, the following neighbouring points are added iteratively to the block using fuzzy system 2: 9 – 8 – 7 – 19 – 16 – 17.
After the last correct point belonging to block 1 (point number 17), the algorithm determines that out of the remain-ing neighbourremain-ing points, point number 14 would be the best choice. Fuzzy system 3 assesses this situation, finding an indicator of 0.74 that this point should not be added to the block. The output of Fuzzy system 3 can be interpreted as an indicator for the termination of the grouping algorithm: the higher the output value (again within the interval [0,1]), the higher the necessity to stop the block under investigation. Fuzzy system 4 now confirms this decision by the assessment of the changes of the outputs of system 3 within the iterative processing, since this output, which has in all preceding steps been approx. 0.50, has suddenly changed to 0.74 (Table 1). So the block is terminated.
Fig. 8.Graphical representation of the displacement vectors of the example given. The length of the vectors (in mm) is given in italic at the end point of the vectors. The grey curve is showing the boundary between the stable and the unstable areas.
Out of the remaining points, the algorithm starts again finding the best 4-point-combination. So, the second block is built up in the following sequence of points: 20 – 22 – 25 – 26 – 21 – 4 – 5 – 11 – 12 – 14 – 23 – 1 – 3.
Here the algorithm stops because there are no more points available. The algorithm succeeded in extracting the two blocks with different pattern of movement out of the given displacement vectors.
5 Conclusions
This algorithm is a further development of the classical geodetic deformation analysis. It is still a pure geometrical analysis, since both, the strain analysis and the visual assess-ment, are geometrical. No physical parameters of e.g. ground mechanics are considered. An extension of the fuzzy sys-tems taking into account physical and geological parameters is possible.
Acknowledgements. This work was partially supported by the European Commission, Research DG, Environment Programme, Global Change and Natural Disasters.
Edited by: M. Arattano
References
Becker, E. and B¨urger, W.: Kontinuumsmechanik, Teubner Verlag, Stuttgart, 1975.
Haberler, M.: Einsatz von Fuzzy Methoden zur Detektion kon-sistenter Punktbewegungen, Geowissenschaftliche Mitteilun-gen, Schriftenreihe der Studienrichtung Vermessungswesen und Geoinformation der Technischen Universit¨at Wien, Heft Nr. 73, 2005.
Heine, K.: Beschreibung von Deformationsprozessen durch Volterra- und Fuzzy-Modelle sowie Neuronale Netze, Deutsche Geod¨atische Kommission, Reihe C, Heft Nr. 516, Verlag der Bayerischen Akademie der Wissenschaften, M¨unchen, 1999. Kruse, R., Gebhardt, J., and Klawonn, F.: Fuzzy Systeme, Teubner
Verlag, Stuttgart, 1995.
Lehmk¨uhler, H.: Die geod¨atische Deformationsanalyse als Muster-erkennungsaufgabe, Ver¨offentlichung des Geod¨atischen Instituts der Rheinisch-Westf¨alischen Technischen Hochschule Aachen, Nr. 49, 1993.
Miima, J.-B.: Artificial Neural Networks and Fuzzy Logic Techniques for the Reconstruction of Structural Deformations, Geod¨atische Schriftenreihe der Technischen Universit¨at Braun-schweig, Nr. 18, 2002.
Pelzer, H. and Milev, G. (Eds.): Untersuchungen zur geod¨atischen Bestimmung von Rutschungserscheinungen und vertikalen Krustenbewegungen, Wissenschaftliche Arbeiten der Fachrich-tung Vermessungswesen der Universit¨at Hannover, Nr. 133, 1984.
Pelzer, H. (Ed.): Geod¨atische Netze in Landes- und Ingenieurver-messung II, Wittwer Verlag, Stuttgart, 1985.
Welsch, W. (Ed.): Deformationsanalysen ’83, Schriftenreihe Wis-senschaftlicher Studiengang Vermessungswesen Hochschule der Bundeswehr M¨unchen, Heft Nr. 9, 1983.
Welsch, W., Heuneke, O. and Kuhlmann, H.: Auswertung geod¨atischer Uberwachungs-messungen,¨ Wichmann Verlag, Heidelberg, 2000.