Acute Myeloid Leukemia Cells via Activation of miR-19a
and/or b
Ilaria Lepore
1, Carmela Dell’Aversana
1,2, Maxim Pilyugin
4, Mariarosaria Conte
1, Angela Nebbioso
1,
Floriana De Bellis
1, Francesco P. Tambaro
1,3, Tiziana Izzo
5, Guillermo Garcia-Manero
3, Felicetto Ferrara
5,
Irmgard Irminger-Finger
4, Lucia Altucci
1,2*1 Department of Biochemistry, Biophysics and General Pathology, Seconda Università degli Studi di Napoli, Naples, Italy, 2 Institute of Genetics and Biophysics (IGB), Naples, Italy, 3 Department of δeukemia, The University of Texas εD Anderson Cancer Center, Houston, Texas, United States of America, 4 εolecular Gynecology and Obstetrics δaboratory, Department of Gynecology and Obstetrics and Department of Genetic and δaboratory εedicine, University Hospitals of Geneva, HUG, Genève, Switzerland, 5 Division of Hematology and Stem Cell Transplantation Unit, Cardarelli Hospital, Naples, Italy
Abstract
Over the past years BARD1 (BRCA1-associated RING domain 1) has been considered as both a BRCA1 (BReast Cancer susceptibility gene 1, early onset) interactor and tumor suppressor gene mutated in breast and ovarian cancers. Despite its role as a stable heterodimer with BRCA1, increasing evidence indicates that BARD1 also has BRCA1-independent oncogenic functions. Here, we investigate BARD1 expression and function in human acute myeloid leukemias and its modulation by epigenetic mechanism(s) and microRNAs. We show that the HDACi (histone deacetylase inhibitor) Vorinostat reduces BARD1 mRNA levels by increasing miR-1λa and miR-1λb expression levels. εoreover, we identify a specific BARD1 isoform, which might act as tumor diagnostic and prognostic markers.
Citation: δepore I, Dell’Aversana C, Pilyugin ε, Conte ε, Nebbioso A, et al. (β01γ) HDAC Inhibitors Repress BARD1 Isoform Expression in Acute εyeloid δeukemia Cells via Activation of miR-1λa and/or b. PδoS ONE κ(1β)μ eκγ01κ. doiμ10.1γ71/journal.pone.00κγ01κ
Editor: Pierre-Antoine Defossez, Université Paris-Diderot, France
Received July 11, β01γ; Accepted October βλ, β01γ; Published December 11, β01γ
Copyright: © β01γ δepore et al. This is an open-access article distributed under the terms of the Creative Commons Attribution δicense, which permits unrestricted use, distribution, and reproduction in any medium, provided the original author and source are credited.
Funding: Grant Support. This work was supported by EUμ Blueprint (contract no. βκβ510); Italian IHEC (Flag Projectμ EPIGEN); the Italian Association for Cancer Research (AIRC no.11κ1β); Italian εinistry of University and Research (PRIN_β00λPXβTβE_004); PON0101ββ7; Swiss National Research Foundations (NF γ100A0-1ββγ5γ), δigue SuisseContre le Cancer (KδS 01λ6β-10-β006), and δigueGenevoiseContre le Cancer (δGCC 1117) to IIF. The funders had no role in study design, data collection and analysis, decision to publish, or preparation of the manuscript.
Competing interests: The authors have declared that no competing interests exist. * E-mailμ lucia.altucci@uninaβ.it
Introduction
One of the most important goals of current anti-cancer research is to identify new diagnostic markers, allowing both early screening of patients and their potential stratification for personalized medicine. The elucidation of pathways frequently altered in cancer, such as proliferation, apoptosis, DNA repair and differentiation, is thus of vital importance [1]. Over the past years increasing evidence has emphasized the involvement of BARD1 (BRCA1-associated RING domain 1) in the pathogenesis of different cancers, including breast, ovarian, uterine, colon and lung cancer, as well as neuroblastoma [β-6]. BARD1, well known as a BRCA1 partner, is considered a tumor suppressor due to its impact on cell cycle progression, apoptosis, gene expression regulation, RNA processing and DNA repair mechanisms, either conjugated with BRCA1 in a stable heterodimer through the interaction of their respective RING finger domains, or in its monomeric form [7-16].
Therefore, the presence of point mutations in BARD1, or deletion-bearing or truncated BARD1 isoforms, generated by alternative splicing of mature mRNA transcripts or by the use of multiple translation start sites (TSS), respectively, might significantly affect its functions, leading to cancer development. However, overexpressed aberrant isoforms rather than mutations of BARD1 have been reported in cancer. Li et al described the characterization of different BARD1 isoforms in breast, ovarian and uterine carcinomas, which are absent or strongly down-regulated in healthy tissues, suggesting that these isoforms might be a predisposing factor or may result from the development of the disease [γ,17].
Interestingly, and consistent with its function as a tumor suppressor, the loss of Fδ BARD1 (Full δength BARD1) in favor of mutated variants is a commonly reported event in solid cancers. For instance, high levels of Fδ BARD1 correlate with a good prognosis in colon cancer patients, whereas BARD1 splicing isoforms are variably expressed both in normal and
cancer cells [4], and the expression of epitopes, consistent with isoform but not Fδ BARD1 expression, was correlated with poor survival [5]. BARD1 isoforms have also been detected in NSCδC (Non-Small Cell δung Cancer) samples and their expression correlated with decreased survival [5].
BARD1 expression has been found to be down-regulated in samples from myelodysplastic syndrome patients (εDS) with progression to acute myeloid leukemia (Aεδ) [1κ]. This prompted us to investigate the role of BARD1 isoforms in Aεδ and to analyze its possible pharmacological modulation for medical intervention.
In the last few years, several epigenetic modulating compounds have been designed and applied to cancer treatment or used in preclinical development. To date, the most common epigenetic compounds are histone deacetylase (HDAC) inhibitors, the so-called HDACi. Approved in β006 by the FDA for the second line treatment of cutaneous T-cell lymphoma (CTCδ), suberoylanilidehydroxamic acid (SAHA,
Vorinostat), is the best known class I & II HDACi [1λ-ββ]. Additional class-specific modulators include the class I-specific HDACi Entinostat (εS-β75) [β0,βγ-β6], the class II inhibitor εC 156κ [β7,βκ] and the HDAC6 inhibitor ST-κ0 [βλ].
Other key actors involved in gene expression control are microRNAs (miRNAs), small non-coding RNAs able to bind specific mRNA target sequences. miRNAs recognize a complementary sequence within the γ’ untranslated region (γ’UTR) of a specific mRNA, inducing degradation of the target when a full match miRNA-mRNA occurs, or blocking translation in the event of an incomplete complementation [γ0-γ5].
The correlation between miRNAs and epigenetic enzyme action is complex given that miRNA gene promoters may contain CpG islands, the targets of epigenetic control of gene expression by DNεTs (DNA-methyl transferases) and HDACs [γ6,γ7].
We investigated BARD1 expression and function in Aεδ and its modulation by epigenetic mechanisms and miRNA pathways. We found that Vorinostat reduces BARD1 mRNA levels by increasing miR-1λa and miR-1λb expression. εoreover, we identified specific BARD1 isoforms that might act as oncogenes and as tumor diagnostic and prognostic markers.
Materials and Methods
Chemical compounds
Vorinostat (SAHA, εerck), Entinostat (εS-β75, Alexis), εC 156κ and ST κ0 were dissolved in DεSO (Di-εethyl SulfOxide, Sigma-Aldrich) and used at a final concentration of 5 ε.
AML ex vivo samples
Aεδ blasts were recovered bone marrow and purified by Ficoll (Sigma-Aldrich) density gradient separationμ after a centrifugation of β5 minutes at 1β50 rpm, the layer of mono-nuclear cells was diluted in cell culture medium and further centrifuged for 5 minutes at the same speed. Cell pellet was dissolved in RPεI 1640 (EuroClone) enriched with β0% heat-inactivated FBS (Fetal Bovine Serum, Sigma Aldrich), 1% glutamine, 1% penicillin/streptomycin and 0.1% gentamycin
(EuroClone), and kept at γ7°C in air and 5% COβ. The ethical committee of the Seconda Università degli Studi di Napoli approved these experiments carried out after written informed consent from the donors.
Cell lines
Human leukemia cell lines (Uλγ7, NB4, K56β and Hδ60) were grown in RPεI 1640 medium (EuroClone) supplemented with 10% heat-inactivated FBS (Sigma Aldrich), 1% glutamine, 1% penicillin/streptomycin and 0.1% gentamycin (EuroClone), and kept at γ7°C in air and 5% COβ. Conversely, adherent Heδa (human epithelial cervical cancer), εCF7 (human breast cancer) and Kelly (human neuroblastoma) cells were grown in D-εEε medium (EuroClone) supplemented with the components described above and in the same settings.
RNA extraction
Cells were collected by centrifugation and resuspended in 1 ml of TRIzol reagent (Invitrogen), strongly shaken and stored at -β0°C overnight. The following day the samples were supplemented with 100 µl of β-bromo-γ-chloro propane (Sigma Aldrich), gently shaken and incubated for 15 minutes at RT. After a centrifugation of 15 minutes at 1β000 rpm at 4°C the supernatants were put in a fresh tube and supplemented with 500 µl of cold isopropylicalcohol. RNA precipitation reaction was carried out for γ0 minutes at -κ0°C and followed by a centrifugation of γ0 minutes at 1β000 rpm at 4°C. The pellets were then resuspended in 1 ml of cold 70% ethanol and the samples were centrifuged again for 10 minutes at 7500 rpm at 4°C. The pellets were subsequently dried at 4β°C for a few minutes and resuspended in DEPC-treated HβO. RNA samples were quantified with a Nanodrop 1000 spectrophotometer and their quality was evaluated using Agilent RNA 6000 Nano Assay.
RT-PCR
RNA samples were converted into cDNA using VIδO Invitrogen kitμ 1 µg of RNA was mixed with 1x VIδO Reaction εix, 1x Super-Script εix and DEPC-HβO; the samples were then incubated for 10 minutes at β5°C, 60 minutes at 4β°C and 5 minutes at κ5°C. RT-PCR experiments for BARD1 exon 6 – exon 11 and GAPDH were then performed with 75 ng of cDNA in presence of a reaction mixture containingμ β.5 mε εgClβ, 0.4 mε dNTP, 0.5 µε of each primer, 1.5 U of Taq GOδD DNA polymerase, 1x GOδD buffer (Applied Biosystem), sterile HβO. The thermal protocol was as followsμ λ5°C for 10 minutes plus γ0 cycles at λ5°C for γ0 seconds, 60°C for γ0 seconds and 7β°C for 45 seconds, with a final elongation of 10 minutes at 7β°C. BARD1 exon 1 – exon 11 amplification was performed with a different thermal protocolμ λ5°C for 10 minutes plus γ5 cycles at λ5°C for 1 minute, 56°C for 1 minute and 7β°C for β minutes with a final elongation of 10 minutes at 7β°C. Primers usedμ forward exon 1 5’ GAGGAGCCTTTCATCCGAAG γ’ (-βκ from ATG); forward exon 6 5’ CTCCAGCATAAGGCATTGGT γ’ (+1441 from ATG); reverse exon 11 5’ CGAACCCTCTCTGGGTGATA γ’ (+ββ5β from ATG). GAPDH quantification was used as normalization controlμ forward
primer 5’ GGAGTCAACGGATTTGGTCGT γ’, reverse primer 5’ GCTTCCCGTTCTCAGCCT TGA γ’.
5’ RACE PCR
5’ RACE PCR of BARD1 isoforms was performed using 5’ RACE System for Rapid Amplification of cDNA Ends Kit (Invitrogen) according to manufacturer’s instructions. The experiments were carried out with γ µg of NB4 RNA samples. RACE primers in exon 6μ GSP1 5’ GGCTCCATAGGAAAGTAA γ’ (+1554 from ATG), GSPβ 5’GACTATATCCACATGCCCA TTC γ’ (+15γ0 from ATG), GSPγ 5’ CATCGTGAAGTGGTGAGTCATT γ’ (+1501 from ATG). Subsequently 5' RACE products were run on 1% agarose gel, recovered with a QIAquick Gel Extraction Kit (Qiagen) and used to perform the TOPO TA Cloning® reaction (Invitrogen)μ 4 µl of PCR product were mixed with 10 ng of the pCR®II-TOPO® vector (Invitrogen) in presence of a salt solution (β00 mε NaCl, 10 mε εgClβ), and the reaction was carried out for 1 hour at RT. The plasmids obtained were amplified in Jε10λ super competent E. coli (Invitrogen) and were extracted with εINIprepNucleoSpinPlasmid (εacherey-Nagel). 1 µg of plasmid was then digested with 10 U of EcoRI enzyme (Biolabs) for 1 hour and γ0 minutes to ensure the presence of the PCR product in the vector. Finally, DNA samples were sent to the sequencing service, which utilized ε1γ forward and reverse primers to obtain the sequences.
miRNA target prediction analysis
A computational analysis of the predicted miRNAs to target BARD1 γ’UTR region was performed within the miRBase database and a list of all miRNAs that may target BARD1 was obtained by selecting miRNAs commonly indicated by ‘Target Scan’, ‘εiranda’ and ‘PictarVert’ tools.
miRNA microarray
Human miRNA microarray experiments were performed using δC Sciences Service (δC Sciences, Austin, USA), based on µParaflo®εicrofluidic Biochip Technology, containing 7βγ mature human miRNA probes (Sanger miRBase, release 10.1). NB4 cells were stimulated for 6 hours with 5 µε Vorinostat. After RNA extraction, 1 µg of untreated (NT) and treated (s) samples was labeled with Cyγ or Cy5, with dye swap between samples to eliminate dye bias. The samples were then hybridized to δC Sciences platform. εicroarray raw data were normalized using a cyclic δOWESS (δocally-weighted Regression) method, and the mean and co-variance of each probe with a detected signal were calculated. Finally, the data were expressed as the ratio (logβ transformed) of the two sets of detected signals, and p-values of the t-test were calculated. The experiment was performed in biological triplicate and the t-test analysis was carried out between NB4 untreated (NB NT 1-γ) and NB4 treated with Vorinostat (NB 6h s1-γ); p-value ≤ 0.10. In particular, relative fold change for miRNA1λa and miRNA1λb were 0.γβ and 0.γ6, respectively. Raw and normalized data were uploaded to the NCBI Gene Expression Omnibus (GEO) website and are accessible through GEO Series accession number GSEγ7γ74 (httpμ// www.ncbi.nlm.nih.gov/geo/query/acc.cgi?acc=GSEγ7γ74).
miRNA Real-Time PCR
Following RNA extraction, the miRNA fraction was converted into cDNA using miScript Reverse Transcription Kit (Qiagen)μ 1 µg of RNA was incubated with 1x Buffer, 1xmiScript RT and DEPC-HβO for 60 minutes at γ7°C and then 5 minutes at λ5°C. Subsequently, miRNA Real-Time PCR was performed with QuantiTect SYBR Green PCR Kit (Qiagen), requiring the use of 75 ng of cDNA in presence of 1x QuantiTect SYBR Green PCR εaster εix, miScript Universal Primer and primer specific for miR-1λa or miR-1λb (Qiagen); RNU6b (Qiagen) specific primer was used to normalize data. The thermal protocol was as followsμ λ5°C for 15 minutes plus γ5 cycles at λ4°C for 15 seconds, 5κ°C for γ4 seconds and 70°C for γ4 seconds.
Pre-miR precursor reverse transfection
Pre-miR precursor reverse transfection was performed in NB4 cells with Pre-miR Precursor Starter Kit (Ambion), following the manufacturer’s instructions. Briefly, 5 µl of siPORT Amine Transfection Reagent (Ambion) was diluted into λ5 µl of Opti-εEε (Invitrogen) and left for 10 minutes at RT. The reaction mixture was then combined with specific mimic-miRNAs (1μ1) at the desired concentration and incubated for 10 minutes at RT; in this case 50 nε mimic-miR-1λa and 50 nε mimic-miR-1λb were used, or 50 nε mimic-miR-scramble as negative control. This final mixture was added to 4.6 x 10⁵ cells for each point in a β4-well plate.
BARD1 Real-Time PCR
BARD1 Real-Time PCR was performed using 75 ng of VIδO cDNA, 1xSybrgreen PCR εaster εix (Applied Biosystem), 0.5 µε of each primer and sterile HβO. The thermal protocol was as followsμ λ5°C for 15 minutes plus γ0 cycles at λ5°C for 15 seconds, 60°C for 15 seconds and 7β°C for γ0 seconds.
Primers usedμ forward exon κ 5’
AGCGTAGGGATGGACCTCTT γ’ (+16λ1 from ATG) and reverse exon λ 5’ CCATTGAGAATCCCAAGCAT γ’ (+1κκ0 from ATG). GAPDH amplification was used to normalize data.
Cloning of BARD1 3’UTR
pGδγ control vector was amplified in E. coli DH5α (Invitrogen) and extracted with Pure δink Hipure Plasmid Filter εaxiprep Kit (Invitrogen). 1 µg of plasmid with β0U of XbaI restriction enzyme (Biolabs) was then digested for 1 hour and γ0 minutes at γ7°C, followed by heat inactivation at 65°C for β0 minutes. The digested vector was run on 1% agarose gel to recover the linear vector with QIAEX II Gel Extraction Kit (Qiagen), according to supplier’s instructions. BARD1 γ’UTR, both wild-type and mutated, forward and reverse sequences (Bio-Fab) were annealedμ γ’UTR wt forward 5’ CATTTCAAATTGAATTTGCACGACATTTCAAATTGAATTGC ACGACATTTCAAATTGAATTTGCACG γ’ and reverse 5’ CGTGCAAATTCAATTTGAAATGTCGTGCAAATTCAATTTGA AATGTCGTGCAAATTCAATTTGAAATG γ’; γ’UTR mut
forward 5’
CACCCCAAATTGAATTTGCACGACACCCCAAATTGAATTTG CACGACACCCCAAATTGAATTTGCACG and reverse 5’
CGTGCAAATTCAATTTGGGGTGTCGTGCAAATTCAATTTG GGGTGTCGTGCAAATTCAATTTGG GGTG.
Each sequence was designed with sticky ends for XbaI enzyme (TCTAGA) followed by a unique site of digestion recognized by BlpI enzyme (GCTGAGC) and γ’UTR BARD1 sequence repeated three times. The two fragments at 1 µg/µl concentration were mixed by 1μ1 balance and incubated at λ0°C for 5 minutes, γ7°C for γ0 minutes and 4°C for 10 minutes. The ligation reaction was then performedμ 100 ng of vector were mixed with β000 U of T4 ligase enzyme, 1 µl of γ0% PEG κ000, γ’UTR insert, 1x ligase buffer and DEPC-treated HβO; the quantity of insert for use was determined by the formulaμ [(ng of vector x kb insert) / kb vector] x β0/1; the ligase reaction was carried out at 16°C overnight. The following day 10 µl of ligase product was used to transform E. coli DH5α and finally pGδγ-γ’UTR-BARD1 wt and mut vectors were recovered with Pure δink Hipure Plasmid Filter εaxiprep Kit (Invitrogen).
Transfection
pGδγ-γ’UTR-BARD1 wt and mut vectors were transfected into Heδa cells using δipofectamine™ β000 Transfection Reagent (Invitrogen), following supplier’s instructions. 1 µg of pGδγ-γ’UTR-BARD1 plasmid plus β00 nε mimic-miR-1λa, mimic-miR-1λb or mimic-miR-scramble were used.1 µg of pεAX-GFP vector was transfected in all the samples to normalize data.
Luciferase assay
δuciferase activity was measured after β4 hours and 4κ hours from pGδγ-γ’UTR-Bard1 transfection. Heδa cells were incubated with δuciferase Cell Culture δysis 5x Reagent (Promega) for 1 hour at RT with gentle shaking, and then the cell lysate was transferred into a λ6-well white plate (Nunclon) to read GFP fluorescence values ( exc = 4κ5 nm; emi = 5β0 nm); 100 µl of δuciferase Assay Reagent (Promega) were then added and luminescence values were quantified. All of these measurements were calculated using TECAN infinite εβ00 station. Fluorescence values were used to normalize data, expressed as a percentage of luminescence on percentage of fluorescence ratio.
pCMV-MIR stable transfection
pCεV-εIR vectors (OriGene) encoding for miR-1λa or miR-1λb and the empty vector were first amplified in E. coli
DH5α and plasmids were extracted with PureδinkHipure Plasmid Filter εaxiprep Kit (Invitrogen). Subsequently, 1 µg of each vector was transfected into Uλγ7 cells using AεAXA Nucleofector (δonza), according to supplier’s instructions. 4κ hours after transfection, the percentage of GFP- positive cells was determined by FACS analysis; the cells were then placed in a λ6-well plate in presence of 500 µg/ml G41κ (Gibco) to isolate the positive clones.
Cell cycle analysis
Cells were collected by centrifugation at 1β00 rpm for 5 minutes and then resuspended in 500 µδ of a hypotonic buffer
composed of 0.1% NP-40, 0.1% sodium citrate, 50 µg/ml propidium iodide (Sigma Aldrich), RNAse A. The samples were then incubated in the dark for γ0 minutes. Analysis was performed by FACS-Calibur (Becton Dickinson) using Cell Quest Pro software (Becton Dickinson) and εodFit δT version γ software (Verity). Experiments were performed in duplicate.
Caspase assay
Caspase activity was detected within whole living cells using FδICA Apoptosis Detection Kits (B-Bridge). Green FAε-δETD-FεK and red SR-δEHD-FAε-δETD-FεK substrates were used for caspase-κ and caspase-λ respectively. Cells untreated or treated with 5 µε Vorinostat for β4 hours were washed twice in cold PBS and incubated for 1 hour in ice with the corresponding substrates, as recommended by suppliers. Washing step and fluorescence analysis were then performed using Cell Quest Pro software (Becton Dickinson) applied to FACS-Calibur (Becton Dickinson). Experiments were performed in duplicate.
siBARD1 transfection
Specific BARD1 fluorescent siRNA (Hs_BARD1_7 and Hs_BARD1_5 FlexiTubesiRNA, Qiagen) were transfected into Uλγ7 cells with AεAXA Nucleofector, according to the supplier’s instructions. The total amount of siRNA used was β µg. β4 hours after transfection cells were treated with 5µε Vorinostat for additional β4 hours. Finally, 4κ hours after transfection cell viability was evaluated by FACS-Calibur (Becton Dickinson) and Cell Quest Pro software (Becton Dickinson), after PI staining of dead cells. The percentage of green fluorescent cells was also measured by FACS analysis. AllStars negative siRNA was used as negative control.
BARD1 expression analysis in vivo (human)
BARD1 expression was assessed by RT-PCR after RNA extraction and cDNA conversion as previously described. Experiments were performed in samples from patients treated as in [γκ].
Expression and detection of biotinylated BARD1 isoforms in human cell culture
The PCR fragment BARD1 corresponding to full length BARD1 CDS or BARD1ω15’UTR and CDS were cloned into pcDNAγ.1 (+) vector (Invitrogen) (forward primer annealing sequence ATCACAATAGACTTTCCAGTC). Their γ’ ends were fused in-frame with a sequence encoding the γ0-amino acid BδRP motif, which is specifically biotinylated by bacterial BirA biotin ligase [γλ]. To express biotinylated BARD1 fusions HEKβλγT cells were co-transfected with these constructs and BirA also cloned in pcDNAγ.1(+). Recombinant proteins were visualized with streptavidin conjugated to Dyδight 4κκ and observed using fluorescent microscope.
Statistical analysis of the distribution of nuclei size HEKβλγT cells were transfected with Omega-biotin expressing construct as described in corresponding “εaterials and methods” section. The transfected cells were fixed for
microscopic examination. Biotinylated proteins were visualized as described and counterstained with DAPI to visualize DNA. The images of DAPI and biotinylated proteins staining taken at β0x magnifications were used for the quantification of nuclei size. The size of the nuclei was quantified for the random samples (no less than 100 nuclei each) of the cells not visibly expressing or visibly expressing recombinant protein. ImageJ 1.46r software (httpμ//imagej.nih.gov/ij) was used to quantify the surface of the nuclei images. The distribution of the obtained values was analyzed using Peltier Tech Excel Box and Whisker Plot (Box Plot) Utility (httpμ//peltiertech.com) using Excel quartiles calculation and is represented as Box and whisker quartile chart. The inner quartiles of each sample are represented by grey boxes, separated at the median by a black line. The lower and upper quartiles are represented by whiskers. The average of each sample is represented by a diamond marker. The close and far outliers are shown as red crosses and red circles correspondingly. Unpaired two tailed Student T-test was used to calculate p-value characterizing the difference between these two samples.
Results
BARD1 isoform(s) comprising exons 6 to 11 are highly expressed in human AML ex vivo samples
We firstly evaluated BARD1 expression levels in human Aεδ
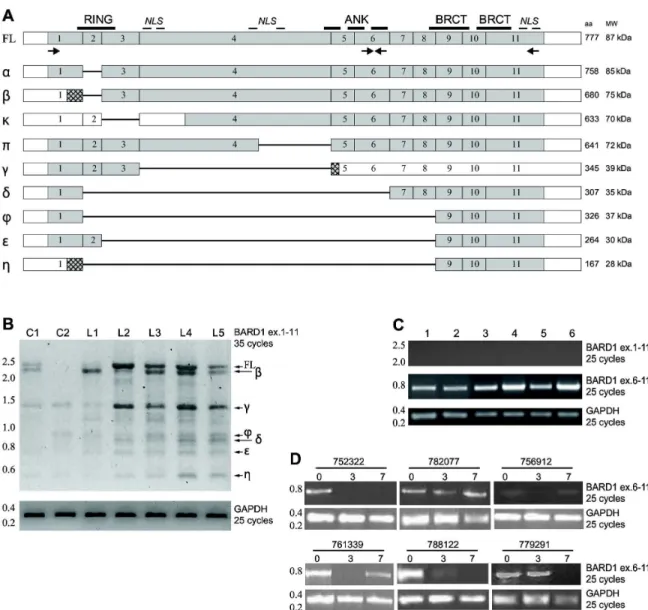
ex vivo blasts. Given that BARD1 mRNAs might be present as different isoforms (Figure 1A) [γ], we used two different pairs of primersμ exons 1 to 11 and exons 6 to 11. The former is able to amplify full length (Fδ) α, , , π, φ, , and η BARD1 isoforms, which contain the first and last exons but can be distinguished by deletion of internal exons (different lengths). The latter amplifies Fδ α, , , π isoforms, which contain exon 6 to exon 11 fragment but have different transcription start sites (TSS) [γ]. RT-PCR analysis clearly indicated the presence of BARD1 in all patient samples. In particular, isoforms containing exon 6 to exon 11 were strongly expressed and more abundant in comparison with Fδ and other long BARD1 isoforms, which appear weakly expressed in all Aεδ samples under identical conditions for amplification (Figure 1B-C and Table 1). In contrast, peripheral blood cells from healthy individuals showed expression of Fδ BARD1 and several smaller isoforms (Figure 1B).
Modulation of BARD1 expression in patients undergoing Vorinostat treatment
By RT-PCR we measured BARD1 isoform exon 6 to 11 expression in patients undergoing Vorinostat anti-Aεδ therapy followed by Ara-C and Idarubicin administration [γκ]. These experiments revealed that BARD1 isoforms are often present in these patients and, interestingly, their expression could be reduced by the clinical protocol, in particular after the γ days of treatment with the HDACi Vorinostat (Figure 1D and Table 2, 3) in some of them. These data were confirmed in Aεδ patient’s samples ex vivo (Table 3). These results seem to suggest that not all Aεδ patients express BARD1, the majority of them displaying a basal down-regulation of the Fδ BARD1 form in favor of shorter isoforms or no BARD1 expression. In addition,
some patients display a decreased expression after treatment with Vorinostat (Figure 1D). Based on these findings, a classification of patients based on BARD1 isoform expression levels could be possible.
Truncated BARD1 isoform(s) are also expressed in human AML cell lines and their expression is modulated by HDACi treatment
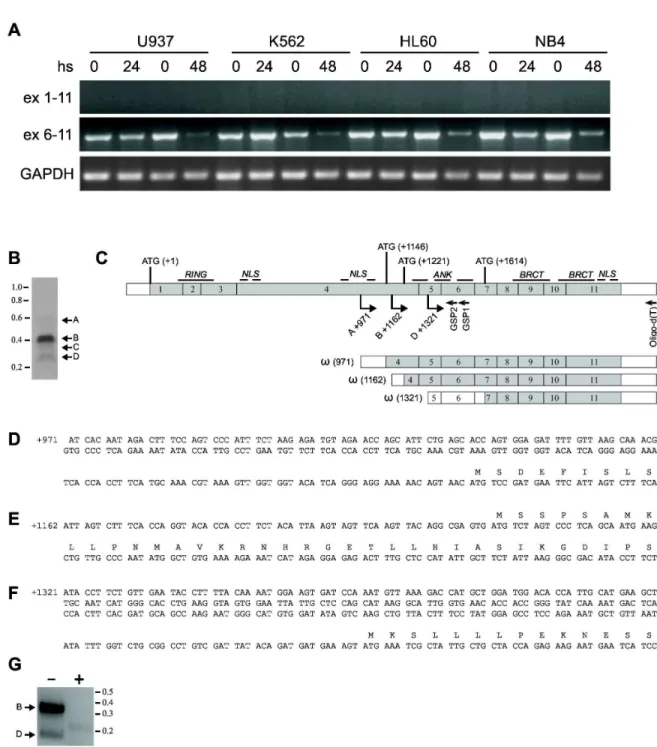
Based on the ex vivo data, we decided to exploit the de-silencing activity of the epigenetic modifiers HDACis in Aεδ cell lines to obtain the re-expression of long BARD1 isoforms, including the Fδ. To this end, we determined the BARD1 expression profile in four different human Aεδ cell lines (NB4, Uλγ7, K56β and Hδ60) together with cell lines of different origin. Fδ and other long isoforms were weakly, if at all, expressed (Figures 2 and S1), corroborating the results obtained ex vivo. Interestingly, the specific isoform(s) containing exons 6 to 11 were strongly expressed in Aεδ cell lines (Figure 2). We then stimulated these Aεδ cells for β4 or 4κ hours with the well-known HDACi Vorinostat, used at 5 µε concentration. A down-regulation of the truncated (exons 6 to 11) BARD1 isoforms by Vorinostat was observed, as well as longer BARD1 isoforms (Figure 2A, S2 and S3). This effect on BARD1 expression was time-dependent; NB4 cells proved particularly sensitive to Vorinostat, displaying BARD1 down-regulation as early as 6 hours after treatment (Figure S2). In fact Vorinostat was more effective than Entinostat, εC 156κ and ST κ0 (Figure S2C), which strongly suggests that both class I & II HDACs may play a role in BARD1 down-regulation.
Characterization of truncated BARD1isoform(s)
RT-PCR experiments showed that truncated isoform(s) of BARD1 are strongly expressed in Aεδ cells compared to Fδ BARD1 and other internal deletion-bearing BARD1 isoforms. To identify these specific BARD1 isoform(s) containing the exon 6 to 11 sequences, 5’ RACE PCR was performed on RNA samples from NB4 cells. We characterized three BARD1 isoforms (Figure 2B-G), two of which starting at the end of exon 4 (+λ71 and +116β from ATG) and the third at exon 5 (+1γβ1 from ATG). We subsequently termed these N-terminally truncated isoforms ω1, β, and γ. These isoforms seem particularly prominent in NB4 cells. The protein translated from isoforms starting in exon 4 would have a size of γλ5 amino acids or 44.γλ kDa, comprise the ankyrin repeats and BRCT domains, but not the RING finger, and the one starting in exon 5 would code for βγλ amino acids or β7.γ kD, comprising only the BRCT domains (Figure 2B-G).
BARD1 expression is also modulated by Vorinostat treatment in other cancer cell lines
To determine whether Vorinostat-induced BARD1 down-regulation was an exclusive event of human Aεδ cells, we evaluated BARD1 expression levels in other human cancer models, such as εCF7 breast cancer cells, Heδa cervical cancer cells and Kelly neuroblastoma cells. The time-dependent reduction of these truncated BARD1 isoform(s) after Vorinostat stimulation was also observed in Kelly and εCF7 cells, but not in Heδa cells, suggesting that a restricted panel of
Figure 1. Truncated BARD1 isoforms are highly expressed in human AML ex vivo and in vivo samples. (A) Schematic diagram of exon structure of full length (Fδ) BARD1 and deletion-bearing BARD1 isoforms. Approximate positions of BARD1 protein motifs, RING finger, ANKyring repeats, BRCT domains, and nuclear localization signals (NδS) are indicated above Fδ BARD1 structure, primers used for RT-PCR are indicated below. Exon structure of BARD1 isoforms α, , , , ϕ, , , and η are aligned with Fδ BARD1. Grey boxes indicate protein coding, empty boxes non-coding regions, lines represent missing exons. Number of encoded amino acids (aa) and calculated molecular weight (εW) are indicated on the right side.
(B) BARD1 RT-PCR using primers in exons 1 and 11 in exvivo samples. With γ5 cycles of PCR amplification, only little expression of Fδ BARD1 and isoforms is detected in blood cells of healthy controls (indicated as C), but all forms are present in leukemia patients (δ1-δ5). In comparison β5 cycles of amplification of GAPDH is shown. (C) RT-PCR for amplification of BARD1 exons 6 to 11 in exvivo Aεδ samples (see also Table 1). With β5 cycles of amplification using primers in exons 1 and 11, no PCR products are detected, however, primers in exons 6 and 11 show fragments in all samples, as it is the case for PCR of GAPDH. (D) BARD1 RT-PCR in patient’s samples at different time points of in vivo treatmentμ D0 (pre-treatment), Dγ (γ days of Vorinostat treatment) and D7 (γ days of Vorinostat + 4 days of Ara-C and Idarubicin treatment. GAPDH represents mRNA concentration and loading control.
doiμ 10.1γ71/journal.pone.00κγ01κ.g001
cancer cells displays BARD1 deregulation. Interestingly, Fδ BARD1 is weakly expressed and affected by Vorinostat (Figure S3).
Vorinostat induces overexpression of different miRNAs in human AML cell lines
We hypothesized that cell type specific BARD1 down-regulation after Vorinostat stimulation might be mediated by miRNA action. We performed miRNA microarray expression analysis using NB4 cells, untreated or treated with Vorinostat at a concentration of 5 µε for 6 hours, to identify miRNAs exhibiting modulated expression. A close group of miRNAs was altered after Vorinostat treatment, among which βγ miRNAs
was shown to be overexpressed in these cells (Figure 3A and 3B). By computational prediction of miRNA target gene using microRNA.org website, we focused on two miRNAs that may potentially regulate BARD1 expression by the binding to its γ’UTRμ miR-1λa and miR-1λb (Figure 3C).
The overexpression of miR-1λa and miR-1λb in NB4 cells was confirmed by qPCR in NB4, K56β, Uλγ7 and Hδ60 cells (Figure 3D). We concluded that the decrease of BARD1 mRNA observed by Vorinostat treatment could involve miR-1λa and miR-1λb.
Table 1. Characteristics of Aεδ samples.
Patient n° Age Diagnosis FAB Cyto Phenotype
P_1 67 APδ εγ t(15;17) DR-, CDγ4-, CD1γ+, CDγγ+, CD117+, CD45RA+,
CD45RO-P_β Aεδ
P_γ Aεδ 46, XX CD1γ+, CDγγ+, CDβ4+, CD11c,
CD16+/-P_4 γ0 Aεδ εβ (gate ≈45%) CDγ4+, CD1γ+, HδA-, DR+, CD1λ+, CD45RA+, CD71+, CD117+, εPO+ P_5 5κ Aεδ εβ CDγγ+, CD1γ-, CD11c+, CD11b+/-, CD117+/-, CDγ4+/-, DR+,
εPO-P_6 6γ Aεδ ε1 CD1γ+/-, CDγγ+, CD117+/-, CD14+/-, CDγ4+/-, CD45+/-doiμ 10.1γ71/journal.pone.00κγ01κ.t001
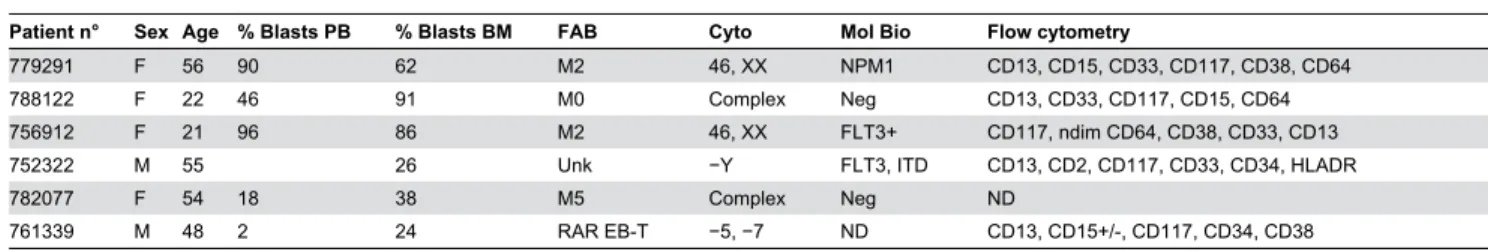
Table 2. Characteristics of patients enrolled in the Vorinostat-based clinical trial.
Patient n° Sex Age % Blasts PB % Blasts BM FAB Cyto Mol Bio Flow cytometry
77λβλ1 F 56 λ0 6β εβ 46, XX NPε1 CD1γ, CD15, CDγγ, CD117, CDγκ, CD64 7κκ1ββ F ββ 46 λ1 ε0 Complex Neg CD1γ, CDγγ, CD117, CD15, CD64 756λ1β F β1 λ6 κ6 εβ 46, XX FδTγ+ CD117, ndim CD64, CDγκ, CDγγ, CD1γ 75βγββ ε 55 β6 Unk −Y FδTγ, ITD CD1γ, CDβ, CD117, CDγγ, CDγ4, HδADR
7κβ077 F 54 1κ γκ ε5 Complex Neg ND
761γγλ ε 4κ β β4 RAR EB-T −5, −7 ND CD1γ, CD15+/-, CD117, CDγ4, CDγκ doiμ 10.1γ71/journal.pone.00κγ01κ.t00β
Table 3. Characteristics of Aεδ patient’s samples and BARD1 expression analysis.
Sample AML Bard 1 isoform expression
βββ +
β51 ε1, NPε1+, FδTγ+ +
1κβ ε4 +
116 ε1
-β04 +
1κγ εβ, 47 XY+der(1)-β-7+
-β57 ε4, FδTγ+ (ITD); mNPε +
β65 +
β70 εβ +
β7β ε1, complex
-β5β ε4
-β11 ε1 +
ββ5 Aεδ +
doiμ 10.1γ71/journal.pone.00κγ01κ.t00γ
Figure 2. Truncated BARD1 isoform(s) are expressed in human AML cell lines and their expression is modulated by HDACi treatment. (A) BARD1 expression levels in Uλγ7, K56β, Hδ60 and NB4 cells, untreated or treated with Vorinostat 5 µε for the indicated times. GAPDH represents mRNA concentration and loading control. (B) Characterization of truncated BARD1 isoform(s). 5’ Race was performed to determine the 5’ end(s) of upregulated isoforms of BARD1 comprising exons 6 to 11. 5’Race performed with mRNA of NB4 cells and amplified with nested gene specific primers (GSP) as indicated in (C) exhibited three isoforms with different 5’ends, labeled A, B, and D. Fragment C was an unrelated sequence. (C) Schematic representation of truncated BARD1 isoforms identified by 5’RACE PCR. δocations of primers and GSPs and transcription start sites are indicated, as well as structure of 5’ truncated mRNA, termed ω isoforms. (D, E, F) Nucleotide sequence of 5’ends of ω isoforms and their deduced amino acid sequences. (G) 5’Race of untreated (-) or SAHA (+) treated NB4 cells clearly shows repression of amplicons A and D, corresponding to ω(116β) and ω(1γβ1) isoforms.
doiμ 10.1γ71/journal.pone.00κγ01κ.g00β
Figure 3. Vorinostat induces overexpression of different miRNAs in human AML cell lines. (A) Heat-map of miRNAs altered in NB4 cells after treatment with Vorinostat (5 µε) for 6 h (s); the experiment was performed in biological triplicate and the t-test analysis was carried out between NB4 untreated (NB NT 1-γ) and NB4 treated with Vorinostat (NB 6h s1-γ); p-value ≤ 0.10. (B) Table of miRNAs up-regulated (in red) and down-regulated (in green) after Vorinostat treatment; p-value ≤ 0.10. (C) Annealing of miR-1λa and miR-1λb to BARD1 γ’UTR. (D) Real-Time PCR for miR-1λa and miR-1λb in NB4, K56β, Uλγ7 and Hδ60 cells after Vorinostat at a concentration of 5 µε. Data show the mean value of three parallel experiments with error bars showing the standard deviations on top of each column.
doiμ 10.1γ71/journal.pone.00κγ01κ.g00γ
BARD1 is a target of miR-19a and miR-19b
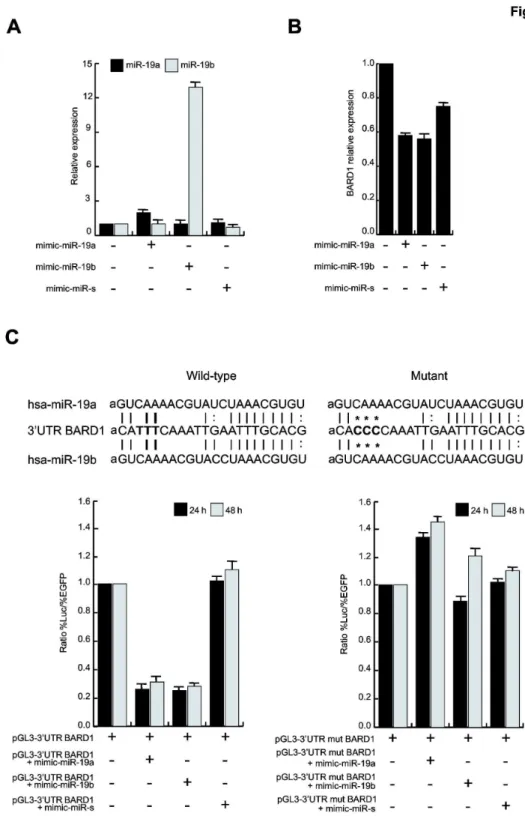
To confirm that BARD1 is a target of miR-1λa and miR-1λb, we transfected NB4 cells with miR-1λa and mimic-miR-1λb. As expected, Real-Time PCR analysis showed an increment of hsa-miR-1λa and hsa-miR-1λb expression 4κ hours after transfection (Figure 4A) compared to the untreated control and the mimic-miR-scramble control. Corroborating our hypothesis of regulation of BARD1 mRNAs by miRs, miR-1λa and miR-1λb overexpression led to BARD1 reduction (Figure 4B). These observations demonstrate that BARD1 is a target of miR-1λa and miR-1λb.
miR-19a and miR-19b directly bind BARD1 3’UTR reducing its expression levels
To further demonstrate the direct binding of miR-1λa and miR-1λb to the γ’UTR of BARD1, we cloned the BARD1 γ’UTR region into the pGδγ vector, downstream of the luciferase reporter gene. We then transfected Heδa cells with pGδγ-γ’UTR-BARD1 vector plus the mimic-miRs, and measured luciferase activity β4 and 4κ hours after transfection. The luciferase assay clearly showed that miR-1λa and miR-1λb can directly bind to the γ’UTR of BARD1, decreasing luciferin oxidation and light development (Figure 4C, left), compared to the Heδa control cells transfected only with pGδγ-γ’UTR-BARD1 vector and the mimic-miR-scramble control. Notably, BARD1 γ’UTR mutated form was not able to bind the two miRs and, consequently, to decrease the luciferase signal (Figure 4C, right), thus strongly strengthening the results.
miR-19a and miR-19b overexpression leads to increased sensitivity to Vorinostat treatment
To clarify the biological functions of miR-1λa and miR-1λb, stable transfection of pCεV-εIR-1λa, pCεV-εIR-1λb into Uλγ7 cells was performed. Clones were screened for overexpression of the two miRNAs and clones Uλγ7-miR-1λa D and G and Uλγ7-miR-1λb D and E were selected for further investigation (Figure S4). Upon treatment with Vorinostat, Uλγ7-miR-1λa and Uλγ7-miR-1λb cells showed a higher percentage of cell death in comparison with the negative control (Figure 5A). Caspase assays in Uλγ7-εIR cells further suggested that in Uλγ7-miR-1λa and Uλγ7-miR-1λb cells Vorinostat treatment induced stronger caspase-κ and, in particular, caspase-λ activation (Figure 5B).
BARD1 silencing increases mortality of U937 cells after Vorinostat treatment
To understand whether BARD1ω1isoform expression contributes to Aεδ maintenance, we performed transfection experiments with specific BARD1 siRNAs, followed by administration of 5 µε Vorinostat for β4 hours. Cells with lower BARD1ω1 isoform expression (Figure 5C and D) displayed a higher percentage of cell death, thus corroborating the involvement of BARD1 isoforms in inhibiting apoptosis pathways.
BARD1 Ω1 inhibits apoptosis
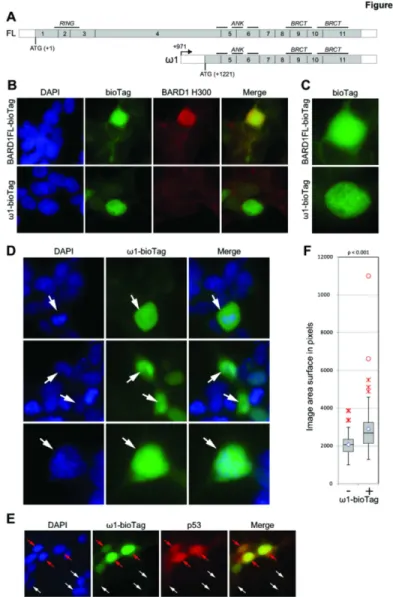
To determine how BARD1ω1 isoform expression counteracts the pro-apoptotic signal of Vorinostat treatment, we investigated its intracellular localization. A biotin tagged form of BARD1ω1 was cloned and expressed in HEK-βλγ cells (Figure 6 and Figure S5). BARD1 Ω1 expressing cells were detected with streptavidin interaction. Comparison of GFP-Fδ BARD1 expression and Bio-BARD1ω1 showed that both localized primarily to the nucleus, although in a different manner. GFP-Fδ BARD1 localizes to nuclear speckles, whereas Bio-BARD1ω1 showed a homogeneous distribution, suggesting a different interaction with protein binding partners (Figure 6A and B).
We also investigated whether Bio-BARD1ω1 cells showed defects in mitosis, as was reported for other BARD1 isoforms [6,κ]. Indeed Bio-BARD1ω1 expressing cells showed a significantly increased number of aberrant mitotic figures, such as aberrant chromosome alignment at the metaphase and anaphase state and abnormally increased size of their nucleus (Figure 6C-E).
To investigate the observed increase of apoptosis in cells that were repressed for BARD1ω1, and considering that Fδ BARD1 was reported to promote p5γ-dependent apoptosis [1β,14,15], we co-stained cells with anti-p5γ antibodies. Indeed p5γ signal was massively increased in Bio-BARD1ω1 expressing cells, as compared to un-transfected cells (Figure 6F). Note that both exogenous and endogenous expression of ω isoforms are shown in Figure S6A-B. Since the intracellular distribution of Bio-BARD1ω1 is different from Fδ BARD1, these observations suggest that Bio-BARD1ω1 stabilizes and sequesters p5γ, but does not promote p5γ dependent apoptosis.
Discussion
In the present manuscript, we identified three BARD1 isoforms of potential interest as cancer markers in Aεδ. The substitution of Fδ BARD1, weakly (if at all) expressed in ex vivo
Aεδ blasts and human Aεδ cell lines, with truncated BARD1 isoforms suggests that this process causes or contributes to leukemogenesis. Thus, the three overexpressed truncated BARD1 mRNA isoforms, together with Fδ BARD1 down-regulation, might be bona fide candidates as diagnostic tumor markers. Consistently, Fδ BARD1 was observed to be down-regulated not only in leukemia [1κ], but also in colon cancer patients [4] and NSCδC samples [5]. It is tempting to speculate that frequent loss or reduced expression of Fδ BARD1 might also be a poor prognosis factor. εoreover, some BARD1 isoforms were expressed in both cancer and adjacent healthy tissues [5], leading to the conclusion that isoform expression could be involved in the initiation of tumorigenesis, thus ‘marking’ an early step of cancer progression.
The oncogenic potential of truncated BARD1 isoforms might be related to their lack of some important domains, in particular the RING N-terminal domain, consistent with the loss of BARD1 tumor-suppressor functions. εoreover, expression of truncated BARD1 isoforms has been correlated with poor prognostic factors in breast, ovarian and lung cancer,
Figure 4. BARD1 is the target of miR-19a and miR-19b. (A) Real-Time PCR for mir-1λa and miR-1λb in NB4 cells transfected with mimic-miR-1λa, mimic-miR-1λb or mimic-miR-scramble (miR-s). Data show the mean value of three parallel experiments with error bars showing the standard deviations on top of each column. (B) BARD1 Real-Time PCR in NB4 cells transfected with mimic-miR-1λa, mimic-miR-1λb or mimic-miR-scramble. Data show the mean value of three parallel experiments with error bars showing the standard deviations on top of each column. (C) δuciferase assay in Heδa cells after transfection with 1 µg pGδγ-γ’UTR-BARD1 wild-type (left) and mutated (right) vectors plus mimic-miR-1λa/b or scramble at a concentration of β00 nε. Data show the mean value of three parallel experiments with error bars showing the standard deviations on top of each column. Annealing of miR-1λa and miR-1λb to BARD1 γ’UTRμ wild type and mutated BARD1 γ’UTR are schematized.
doiμ 10.1γ71/journal.pone.00κγ01κ.g004
Figure 5. Modulation of miR-19a, miR-19b and BARD1increases mortality of U937 cells after Vorinostat treatment. (A) Cell death analysis in Uλγ7-mir cells after β4 h treatment with Vorinostat (5 µε). Data show the mean value of three parallel experiments with error bars showing the standard deviations on top of each column. (B) Caspase-κ and -λ activation in Uλγ7-mir cells treated for β4 h with Vorinostat (5 µε). Data show the mean value of three parallel experiments with error bars showing the standard deviations on top of each column. (C) BARD1 expression levels measured by Real-Time PCR in Uλγ7 cells transfected with specific siRNAs as indicated. Data show the mean value of three parallel experiments with error bars showing the standard deviations on top of each column. (D) Analysis of cell death by PI incorporation after β4 h of Vorinostat treatment (5 µε) in Uλγ7 siRNA-transfected cells. Data show the mean value of three parallel experiments with error bars showing the standard deviations on top of each column.
doiμ 10.1γ71/journal.pone.00κγ01κ.g005
Figure 6. Visualization of BARD1ω fused to the biotin tag in HEK293T cells. (A) Intron structure and protein domain scheme of Fδ BARD1 and BARD1ω1 mRNA. Non-coding sequences are shown as a black line; protein-coding sequences are shown as grey bars. (B) BARD1 full length and BARD1ω1 fused to N-terminal biotin tag (ω1-bioTag) were visualized with streptavidin conjugated to Dyδight 4κκ at β0x magnification. The cells were co-stained with Bethylanti-BARD1 Hγ00 antibody recognizing C-terminal fragment of BARD1. As expected, the antibody recognizes BARD1Fδ-bioTag, but not BARD1ω1-bioTag protein. Non-transfected cells show weak peri-nuclear staining due to endogenously biotinylated proteins localized mostly in mitochondria. Note predominantly nuclear localization of BARD1ω1-bioTag. (C) The distribution of recombinant BARD1 full length and BARD1ω1 in the interphase nucleus. (D) The distribution of BARD1ω1 and phenotype of the cells expressing BARD1ω1 (all panels are shown at 40x magnification). Upper panelμ the distribution of bioTag in the anaphase nucleus (white arrow). Note that BARD1ω1-bioTag is not co-localized with DNA and enriches the nucleoplasm. εiddle panelμ the cells expressing BARD1ω1-BARD1ω1-bioTag are frequently appear multi-nuclei (marked with arrows). δower panelμ nuclei of the cells expressing BARD1ω1-bioTag are significantly bigger than the cells with undetectable levels of the fusion protein but show the same DNA density (marked with arrows). (E) p5γ content is higher in the cells overexpressing ω1-bioTag (red arrows) then in the cells with low level of recombinant protein (white arrows). We hypothesize that ω1-bioTag may bind p5γ protecting it from degradation and tethering it out from its normal localization. (F) Over-expression of Omega affects the size of the nuclei. The box-plot represents the distribution of the size of nuclei of the cells not visibly expressing (-) or expressing (+) BARD1 omega-biotin. The size of the nuclei was quantified using the microscopic image of DAPI stained cells taken at β0x magnification. The sample size is no less than 100. The inner quartiles of each sample are represented by grey boxes, separated at the median by a black line. The lower and upper quartiles are represented by whiskers. The average of each sample is represented by a diamond marker. The close and far outliers are shown as red crosses and red circles correspondingly. Unpaired two tailed Student T-test demonstrates that this distributions are significantly different with the p-value < 0.001.
doiμ 10.1γ71/journal.pone.00κγ01κ.g006
suggesting a pro-tumorigenic function of the isoforms [5]. In particular, the truncated BARD1 isoforms described here are similar, but not identical, to those described previously [γ] devoid of the RING domain and BRCA1interaction, which result in altered ubiquitination activity on target proteins and perturbation of cell cycle progression [β].
We demonstrate that BARD1 is a target of miR-1λa and miR-1λb, two miRNAs belonging to the miR-17-λβ cluster, located on chromosome 1γ.
The miR-17-λβ cluster is known as ‘oncomir-1’, since its encoded miRNAs are often amplified in lymphomas and several solid tumors, including breast, lung and colon cancers [40]. miR-17-λβ cluster appears to be able, together with c-myc, to induce B-cell lymphoma development in a mouse model [κ,λ] and to increase proliferation of normal and malignant lung cells, while inhibiting their differentiation [41]. miR-1λb, especially, seems to play a crucial role in inducing carcinogenesis. However, apart from its ability to increase cell proliferation and to exert an anti-apoptotic effect by targeting death-promoting proteins opposed to PIγK (Phosphatidyl-Inositol-γ-kinase)/Akt pathway in Acute δymphoid δeukemia (Aδδ) [4β], the exact mechanism responsible for its oncogenicity remains unknown. On the other hand, there is also evidence that miR-17-λβ cluster deletion is linked to hepatocellular carcinoma, suggesting that these miRNAs could express tumor-suppressor properties in different contexts [4γ].This apparent contradiction can now be explained by considering the recently reported ceRNA code hypothesis, in which mRNAs combinatorially use miRNAs as a mechanism of crosstalk. Thus, competing endogenous RNAs (ceRNAs) may compete for the same miRNA, thereby affecting each other’s expression levels and being affected by the expression of the miRNA. The key point is therefore the expression level of the miRNA, suggesting that any alteration in the miRNA dose would affect the physiology of the cell leading to pathological states [44].
Speculating on the relationship between miR-1λa/b expression levels and leukemogenesis, we hypothesized that lower levels of miR-1λa/b could be related to cancer advancement, whereas higher expression, coupled with overexpression of BARD1 oncogenic isoforms, may provide a better response to Vorinostat treatment by altering the ceRNA code. In this scenario, the oncogenic role played by miR1λa/b, described by Xu et al, in human cervical cancer cells could be explained [45]. The fact that Vorinostat treatment increases miR-1λa/b and that cells overexpressing miR-1λa/b are particularly sensitive to Vorinostat stimulation, leading to hyperactivation of caspase-λ, strongly endorse this hypothesis. εoreover, considering that one of the reported miR-1λb targets is Bim, a protein of the mitochondrial apoptosis pathway [4β], a reorganisation in the events leading to caspase-λ activation might be postulated. The evidence that high expression levels of truncated BARD1 isoforms together with Vorinostat induction of miR-1λa/b could represent a marker of response to Vorinostat in Aεδ suggests the potential application of miR-1λa/band truncated BARD isoform expression as markers in Aεδ. In other words, it is tempting to speculate on a possible patient stratification on the basis of expression levels of miR-1λ
and BARD1 isoforms to better define patients that might actually benefit from epi-based treatment. Corroborating this hypothesis, BARD1 silencing in Aεδ cells led to higher sensitivity to Vorinostat stimulation. These findings strengthen our conclusions regarding the prognostic role of miR-1λa and miR-1λb, and give new connotations to the isoforms of BARD1, which may prove useful both as diagnostic and predictive markers.
εoreover, the fact that in vivo BARD1 isoforms are expressed and significantly down- regulated in many, but not all, Aεδ patients undergoing Vorinostat administration, strongly supports the hypothesis that patients might benefit from a pre-selection based on expression of truncated BARD1 isoforms for a more effective epigenetic treatment.
Supporting Information
Figure S1. Expression of BARD1 isoforms in Human blood cancer cell lines. Cell linesμ εCF7 - breast cancer; εδ-β, HEδ, Hδ-60 – blood cancer. Upper panelμ BARD1 RT-PCR using forward primer from exon 1 (ATG CCG GAT AAT CGG CAG CC) and reversed primer from exon 11 (CGA ACC CTC TCT GGG TGA TA), γ5 cycles. The isoforms corresponding to the amplified fragments are marked at the left. δower panelμ BARD1 RT-PCR using forward primer from exon 6 (AGC AAG TGG CTC CTT GAC AG) and reversed primer from exon 11 (CGA ACC CTC TCT GGG TGA TA), β5 cycles. GAPDH RT-PCR has been used as internal control.
(PDF)
Figure S2. BARD1 expression can be affected by epigenetic drug treatment in human AML cell lines. (A) BARD1 RT-PCR in human leukemia cell lines after Vorinostat treatment (5 µε). (B) BARD1 RT-PCR after 6 h Vorinostat (5 µε) treatment in γ different human leukemia cell lines. (C) BARD1 RT-PCR in NB4 cell lines after treatment with different epi-compounds for β4 h at the indicated concentrations. GAPDH represents loading control.
(PDF)
Figure S3. BARD1 expression is also modulated by Vorinostat treatment in solid cancer cells. (A) BARD1 RT-PCR in Heδa, εCF7 and Kelly cells. (B) BARD1 RT-RT-PCR in the same cell lines with a longer PCR protocol. GAPDH represents loading control.
(PDF)
Figure S4. Validation of stable transfected clones for miR-19a and miR-19b. Real-Time PCR for miR-1λa and miR-1λb in pCεV-εIR stable transfected Uλγ7 cells. Data show the mean value of three parallel experiments with error bars showing the standard deviations on top of each column. (EPS)
Figure S5. Visualization of BARD1ω fused to the biotin tag in HEK293T cells. BARD1ω1 fused to N-terminal biotin tag (ω1-bioTag) was visualized with streptavidin conjugated to
Dyδight 4κκ at β0x magnification. Non-transfected cells shows weak peri-nuclear staining due to endogenously biotinylated proteins localized mostly in mitochondria. Note predominantly nuclear localization of BARD1ω1-bioTag and increased size of the nuclei expressing BARD1ω1-bioTag.
(PDF)
Figure S6. Exogenous and endogenous expression of ω isoforms. (A) Protein extracts from HEKβλγT cells transfected with pcDNAγ.1 empty vector or with pcDNAγ.1-Omega-A BirA tagged construct. Western blot was probed with Avidin-HRP conjugate shows a protein of expected size for Omega-A BirA and two smaller degradation products. (B) Western blot of NB4 and Hδ60 cells untreated (controls) and SAHA treated, show
proteins of sizes corresponding to ω and degradation products that are reduced upon SAHA treatment, when probed with BARD1 C-terminal antibody (C-β0). Note C-β0 should recognize all BARD1 isoforms.
(PDF)
Author Contributions
Conceived and designed the experimentsμ FF TI GGε IIF δA. Performed the experimentsμ Iδ CD εP εC AN FDB FPT. Analyzed the dataμ CD IIF δA GGε. Contributed reagents/ materials/analysis toolsμ GGε FPT FF TI. Wrote the manuscriptμ δA Iδ.
References
1. Conte ε, Altucci δ (β01β) εolecular pathwaysμ the complexity of the epigenome in cancer and recent clinical advances. Clin Cancer Res 1κμ 55β6-55γ4. doiμ10.115κ/107κ-04γβ.CCR-1β-β0γ7. Pubεedμ ββλ0410γ. β. Wu JY, Vlastos AT, Pelte εF, Caligo εA, Bianco A et al. (β006) Aberrant expression of BARD1 in breast and ovarian cancers with poor prognosis. Int J Cancer 11κμ 1β15-1ββ6. doiμ10.100β/ijc.β14βκ. Pubεedμ 1615β61β.
γ. δi δ, Ryser S, Dizin E, Pils D, Krainer ε et al. (β007) Oncogenic BARD1 isoforms expressed in gynecological cancers. Cancer Res 67μ 11κ76-11κκ5. doiμ10.115κ/000κ-547β.CAN-07-βγ70. Pubεedμ 1κ0κλκ1κ.
4. Sporn JC, Hothorn T, Jung B (β011) BARD1 expression predicts outcome in colon cancer. Clin Cancer Res 17μ 5451-546β. doiμ 10.115κ/107κ-04γβ.CCR-11-0β6γ. Pubεedμ β16λγ656.
5. Zhang YQ, Bianco A, εalkinson Aε, δeoni VP, Frau G et al. (β01β) BARD1μ an independent predictor of survival in non-small cell lung cancer. Int J Cancer 1γ1μ κγ-λ4. doiμ10.100β/ijc.β6γ46. Pubεedμ β1κ1514γ.
6. Bosse KR, Diskin SJ, Cole KA, Wood AC, Schnepp RW et al. (β01β) Common variation at BARD1 results in the expression of an oncogenic isoform that influences neuroblastoma susceptibility and oncogenicity. Cancer Res 7βμ β06κ-β07κ. doiμ10.115κ/15γκ-7445.Aεβ01β-β06κ. Pubεedμ ββγ5040λ.
7. Irminger-Finger I, Jefford CE (β006) Is there more to BARD1 than BRCA1? Nat Rev Cancer 6μ γκβ-γλ1. doiμ10.10γκ/nrc1κ7κ. Pubεedμ 166γγγ66.
κ. Ryser S, Dizin E, Jefford CE, Delaval B, Gagos S et al. (β00λ) Distinct roles of BARD1 isoforms in mitosisμ full-length BARD1 mediates Aurora B degradation, cancer-associated BARD1beta scaffolds Aurora B and
BRCAβ. Cancer Res 6λμ 11β5-11γ4. doiμ
10.115κ/000κ-547β.SABCS-11β5. Pubεedμ 1λ176γκλ.
λ. Choudhury AD, Xu H, εodi AP, Zhang W, δudwig T et al. (β005) Hyperphosphorylation of the BARD1 tumor suppressor in mitotic cells. J Biol Chem βκ0μ β466λ-β467λ. doiμ10.1074/jbc.ε50β446β00. Pubεedμ 15κ55157.
10. Edwards RA, δee εS, Tsutakawa SE, Williams RS, Nazeer I et al. (β00κ) The BARD1 C-terminal domain structure and interactions with polyadenylation factor CstF-50. Biochemistry 47μ 11446-11456. doiμ 10.10β1/biκ01115g. Pubεedμ 1κκ4β000.
11. Henderson BR (β005) Regulation of BRCA1, BRCAβ and BARD1 intracellular trafficking. Bioessays β7μ κκ4-κλγ. doiμ10.100β/bies.β0β77. Pubεedμ 1610κ06γ.
1β. Feki A, Jefford CE, Berardi P, Wu JY, Cartier δ et al. (β005) BARD1 induces apoptosis by catalysing phosphorylation of p5γ by DNA-damage response kinase. Oncogene β4μ γ7β6-γ7γ6. doiμ10.10γκ/ sj.onc.1β0κ4λ1. Pubεedμ 157κβ1γ0.
1γ. Irminger-Finger I, δeung WC, δi J, Dubois-Dauphin ε, Harb J et al. (β001) Identification of BARD1 as mediator between proapoptotic stress and p5γ-dependent apoptosis. εol Cell κμ 1β55-1β66. doiμ 10.1016/S10λ7-β765(01)00406-γ. Pubεedμ 1177λ501.
14. Jefford CE, Feki A, Harb J, Krause KH, Irminger-Finger I (β004) Nuclear-cytoplasmic translocation of BARD1 is linked to its apoptotic activity. Oncogene βγμ γ50λ-γ5β0. doiμ10.10γκ/sj.onc.1β074β7. Pubεedμ 150771κ5.
15. Gautier F, Irminger-Finger I, Grégoire ε, εeflah K, Harb J (β000) Identification of an apoptotic cleavage product of BARD1 as an
autoantigenμ a potential factor in the antitumoral response mediated by apoptotic bodies. Cancer Res 60μ 6κλ5-6λ00. Pubεedμ 11156γκκ. 16. Tembe V, Henderson BR (β007) BARD1 translocation to mitochondria
correlates with Bax oligomerization, loss of mitochondrial membrane potential, and apoptosis. J Biol Chem βκβμ β051γ-β05ββ. doiμ10.1074/ jbc.ε70β6β7β00. Pubεedμ 17510055.
17. Irminger-Finger I (β010) BARD1, a possible biomarker for breast and ovarian cancer. Gynecol Oncol 117μ β11-β15. doiμ10.1016/j.ygyno. β00λ.10.07λ. Pubεedμ 1λλ5λβ10.
1κ. εahadevan D, Diεento J, Croce KD, Riley C, George B et al. (β006) Transcriptosome and serum cytokine profiling of an atypical case of myelodysplastic syndrome with progression to acute myelogenous leukemia. Am J Hematol κ1μ 77λ-7κ6. doiμ10.100β/ajh.β06λ0. Pubεedμ 16κγκγβ5.
1λ. εarks PA, Breslow R (β007) Dimethyl sulfoxide to vorinostatμ development of this histone deacetylase inhibitor as an anticancer drug. Nat Biotechnol β5μ κ4-λ0. doiμ10.10γκ/nbt1β7β. Pubεedμ 17β11407.
β0. εercurio C, εinucci S, Pelicci PG (β010) Histone deacetylases and epigenetic therapies of hematological malignancies. Pharmacol Res 6βμ 1κ-γ4. doiμ10.1016/j.phrs.β010.0β.010. Pubεedμ β0β1λ67λ.
β1. O'Connor OA, Heaney εδ, Schwartz δ, Richardson S, Willim R et al. (β006) Clinical experience with intravenous and oral formulations of the novel histone deacetylase inhibitor suberoylanilide hydroxamic acid in patients with advanced hematologic malignancies. J Clin Oncol β4μ 166-17γ. doiμ10.1β00/JCO.β005.01.λ67λ. Pubεedμ 16γγ0674. ββ. εann BS, Johnson JR, He K, Sridhara R, Abraham S et al. (β007)
Vorinostat for treatment of cutaneous manifestations of advanced primary cutaneous T-cell lymphoma. Clin Cancer Res 1γμ βγ1κ-βγββ. doiμ10.115κ/107κ-04γβ.CCR-06-β67β. Pubεedμ 174γκ0κλ.
βγ. Rosato RR, Almenara JA, Grant S (β00γ) The histone deacetylase inhibitor εS-β75 promotes differentiation or apoptosis in human leukemia cells through a process regulated by generation of reactive oxygen species and induction of pβ1CIP1/WAF1 1. Cancer Res 6γμ γ6γ7-γ645. Pubεedμ 1βκγλλ5γ.
β4. Bracker TU, Sommer A, Fichtner I, Faus H, Haendler B et al. (β00λ) Efficacy of εS-β75, a selective inhibitor of class I histone deacetylases, in human colon cancer models. Int J Oncol γ5μ λ0λ-λβ0. Pubεedμ 1λ7β4λβλ.
β5. Hess-Stumpp H, Bracker TU, Henderson D, Politz O (β007) εS-β75, a potent orally available inhibitor of histone deacetylases--the development of an anticancer agent. Int J Biochem Cell Biol γλμ 1γκκ-1405. Pubεedμ 17γκγβ17.
β6. Ryan QC, Headlee D, Acharya ε, Sparreboom A, Trepel JB et al. (β005) Phase I and pharmacokinetic study of εS-β75, a histone deacetylase inhibitor, in patients with advanced and refractory solid tumors or lymphoma. Journal of Clinical Oncology μ Official Journal of the American Society Of Clinical Oncology βγμ γλ1β-γλββ. doiμ10.1β00/ JCO.β005.0β.1κκ.
β7. εai A, εassa S, Pezzi R, Simeoni S, Rotili D, et al. (β005) Class II (IIa)-selective histone deacetylase inhibitors. 1. Synthesis and biological evaluation of novel (aryloxopropenyl)pyrrolyl hydroxyamides. Journal of medicinal chemistry 4κμ γγ44-γγ5γ.
βκ. Nebbioso A, εanzo F, εiceli ε, Conte ε, εanente δ et al. (β00λ) Selective class II HDAC inhibitors impair myogenesis by modulating the
stability and activity of HDAC-εEFβ complexes. EεBO Rep 10μ 776-7κβ. doiμ10.10γκ/embor.β00λ.κκ. Pubεedμ 1λ4λκ465.
βλ. Scott GK, εarx C, Berger CE, Saunders δR, Verdin E et al. (β00κ) Destabilization of ERBBβ transcripts by targeting γ' untranslated region messenger RNA associated HuR and histone deacetylase-6. εol Cancer Res 6μ 1β50-1β5κ. doiμ10.115κ/1541-77κ6.εCR-07-β110. Pubεedμ 1κ644λκ7.
γ0. Breving K, Esquela-Kerscher A (β010) The complexities of microRNA regulationμ mirandering around the rules. Int J Biochem Cell Biol 4βμ 1γ16-1γβλ. Pubεedμ 1λκ000βγ.
γ1. Wang Y, Blelloch R (β011) Cell cycle regulation by microRNAs in stem cells. Results Probl Cell Differ 5γμ 45λ-47β. Pubεedμ β16γ0156. γβ. Chan SP, Slack FJ. (β007) (β007) And now introducing mammalian
mirtrons. Dev Cell 1γμ 605-607. doiμ10.1016/j.devcel.β007.10.010. Pubεedμ 17λκ11βλ.
γγ. Shan G (β010) RNA interference as a gene knockdown technique. Int J Biochem Cell Biol 4βμ 1β4γ-1β51. Pubεedμ 1λ44β757.
γ4. Bartel DP (β004) εicroRNAsμ genomics, biogenesis, mechanism, and function. Cell 116μ βκ1-βλ7. doiμ10.1016/S00λβ-κ674(04)00045-5. Pubεedμ 147444γκ.
γ5. Grimson A, Farh KK, Johnston WK, Garrett-Engele P, δim δP et al. (β007) εicroRNA targeting specificity in mammalsμ determinants beyond seed pairing. εol Cell β7μ λ1-105. doiμ10.1016/j.molcel. β007.06.017. Pubεedμ 1761β4λγ.
γ6. Brueckner B, Stresemann C, Kuner R, εund C, εusch T et al. (β007) The human let-7a-γ locus contains an epigenetically regulated microRNA gene with oncogenic function. Cancer Res 67μ 141λ-14βγ. doiμ10.115κ/000κ-547β.CAN-06-4074. Pubεedμ 17γ0κ07κ.
γ7. Sato F, Tsuchiya S, εeltzer SJ, Shimizu K (β011) εicroRNAs and epigenetics. FEBS J β7κμ 15λκ-160λ. doiμ10.1111/j. 174β-465κ.β011.0κ0κλ.x. Pubεedμ β1γλ5λ77.
γκ. Garcia-εanero G, Tambaro FP, Bekele NB, Yang H, Ravandi F et al. (β01β) Phase II trial of vorinostat with idarubicin and cytarabine for patients with newly diagnosed acute myelogenous leukemia or myelodysplastic syndrome. Journal of Clinical Oncology μ Official Journal of the American Society Of Clinical Oncology γ0μ ββ04-ββ10. doiμ10.1β00/JCO.β011.γκ.γβ65.
γλ. Beckett D, Kovaleva E, Schatz PJ (1λλλ) A minimal peptide substrate in biotin holoenzyme synthetase-catalyzed biotinylation. Protein Science μ a Publication of the Protein Society κμ λβ1-λβλ.
40. Olive V, Jiang I, He δ (β010) mir-17-λβ, a cluster of miRNAs in the midst of the cancer network. International Journal of Biochemistry and Cell Biology 4βμ 1γ4κ-1γ54.
41. Hayashita Y, Osada H, Tatematsu Y, Yamada H, Yanagisawa K et al. (β005) A polycistronic microRNA cluster, miR-17-λβ, is overexpressed in human lung cancers and enhances cell proliferation. Cancer Res 65μ λ6βκ-λ6γβ. doiμ10.115κ/000κ-547β.CAN-05-βγ5β. Pubεedμ 16β66λκ0. 4β. εavrakis KJ, Wolfe Aδ, Oricchio E, Palomero T, de Keersmaecker K et al. (β010) Genome-wide RNA-mediated interference screen identifies miR-1λ targets in Notch-induced T-cell acute lymphoblastic leukaemia. Nat Cell Biol 1βμ γ7β-γ7λ. doiμ10.10γκ/ncbβ0γ7. Pubεedμ β01λ0740. 4γ. δin YW, Sheu JC, δiu δY, Chen CH, δee HS et al. (1λλλ) δoss of
heterozygosity at chromosome 1γq in hepatocellular carcinomaμ identification of three independent regions. Eur J Cancer γ5μ 17γ0-17γ4. doiμ10.1016/S0λ5λ-κ04λ(λλ)00β05-1. Pubεedμ 106740β1. 44. Salmena δ, Poliseno δ, Tay Y, Kats δ, Pandolfi PP (β011) A ceRNA
hypothesisμ the Rosetta Stone of a hidden RNA language? Cell 146μ γ5γ-γ5κ. doiμ10.1016/j.cell.β011.07.014. Pubεedμ β1κ0β1γ0. 45. Xu Xε, Wang XB, Chen εε, δiu T, δi YX et al. (β01β) εicroRNA-1λa
and -1λb regulate cervical carcinoma cell proliferation and invasion by targeting CUδ5. Cancer δett γββμ 14κ-15κ. doiμ10.1016/j.canlet. β01β.0β.0γκ. Pubεedμ ββ561557.