Mathematical Modelling of Leachate Production from
Waste Contained Site
Ojolo S. Joshua, Ismail S. Oluwarotimi
*, Apeh E. Solomon
Department of Mechanical Engineering, University of Lagos, Lagos, Nigeria Received 18 April 2012; received in revised form 20 May 2012; accepted 27 June 2012
Abstract
In this work, mathematical models of leachate production from Waste Contained Site (WCS) was developed and validated using the existing experimental data with aid of MATLAB, 2007a. When the leachate generation potentials (Lo) were 100m3, 80m3 and 50m3, the maximum amount of leachate generated were about 2920m3, 2338m3 and 1461m3 for about 130 days respectively. It was noted that as the leachate percolates through a selected distance, the concentration keeps decreasing for one-dimensional flow in all the cases considered. Decreasing in concentration continues until a point was reached when the concentration was almost zero and later constant. The effects of diffusivity, amount of organic content present within the waste and gravity, as cases, were also considered in various occasions during the percolation. Comparison of their effects was also taken into account. In case of gravity at constant diffusivity, decrease in concentration was not rapid but gradually while much organic content in the waste caused the rate of leachate production to be rapid; hence, giving rise to a sharp sloped curve. It can be concluded that gravity influences the rate of change in the concentration of the leachate generation as the leachate percolate downward to the underground water. When the diffusivity and gravity are put into consideration, the concentration of the leachate decreases gradually and slowly.
Keywords: leachate production, waste contained site, percolation, diffusivity, gravity
1.
Introduction
Air and water pollutions emanating from Landfills called Waste Contained Site (WCS), coupled with limited suitable land available for the ever increasing needs of disposal of MSW have led to Landfill operations that involve active management of the refuse [7]. The disposal of solid waste had always consisted of either burning or burying materials [5]. However, presently, Waste Contained Site is the predominant means for the disposal solid wastes. This is because this option offers the lowest cost and is most easily managed. It is also practicable in almost all societies [3]. Although, disposal of wastes
using Landfills, or Waste Contained Site, offers the said advantages, they have been identified as one of the major threat to groundwater resources [2, 10]. Wastes placed in Landfill or Waste Contained Site/open dumps are subject to either groundwater flow or infiltration from precipitation.
The dumped solid waste gradually releases its initial intestinal water and some of its decomposition by products gets into water moving through the waste deposit. Such liquid containing innumerable organic and inorganic compound is called "Leachate". This leachate accumulates at the bottom of the Landfill or Waste Contained Site and percolates through the soil. Landfills or Waste Contained Site will remain a significant part of our waste management practice since they are designed and
*Corresponding author. E-mail address: [email protected]
constructed to contain discarded waste so as to minimize release of contaminants to the environment [5, 9]. It is recognized that no silver bullet exists for managing waste and therefore an integrated approach is required. This realization has given birth to the integrated waste management model. An integrated waste management system will contain some or all of the principles identified below according to the following hierarchy of waste management; Reduction of Waste at Source, Reuse of Products, Recycling of Materials, Recovery of Energy and Other Products and Residual Management (R5). Integrated waste management evolved from the realization that one activity (e.g. recycling or recovery of products) alone would not achieve the objective of minimizing risks associated with waste. Several inter-related activities are necessary to achieve a significant risk reduction. The combination of activities is selected in a manner suitable to handle targeted portions of the waste stream. The integration of programs for waste reduction and reuse at the source, recycling and treatment/ recovery of products are aimed at reducing the amount of waste disposed of in landfills [4].
The long-term potential for production of contaminated gas and leachate from Waste Contained Site has resulted in establishment of various bodies which control and regulate the disposal of solid waste in different parts of the world [10].
Mathematical models for the generation/production and the percolation/flow of the leachate generated from waste contained site were developed and validated using existing data as the major objectives behind this work.
2.
Material and Methods
2.1. Mathematical Models Development
The development of the mathematical models starts from the generation of the leachate then to Percolattion (movement or flow of the leachate) models.
2.2. The Landfill Leachate Generation Model
The rate of Generation of the Landfill Leachate is directly proportional to the amount of Leachate present in the Wastes.i.e.
Kdt M
M d
lnMKtC
At t=0
,
MMolnMo K
0 Cln
C Mo
So,
ln MKtlnMo
ln MlnMo Kt
ln o M
M M dt M
d
kt e o M
M
kt e o M
M
Knowing that the waste are deposited from time to time,
kt e o M n i KLo G
L (1)
Where K= Refuse/waste degradation rate (1/yr)
Lo= Leachate Generation Potential (m3/tonne)
M= Mass of waste deposited (tonnes) in year “i”
ti= age of waste (years) in year “i”
Note that Lo is the total amount of Leachate that 1 tonne of waste can produce.
This is mainly a function of waste composition, amount of organic wastes.
2.3. Water Flow Model (Percolation)
From the Darcy’s law, the discharge per unit area of the cross-section is proportional to the gradient of the piezometric head in the direction of flow.
i.e. ∆
∆ (2)
Where Q is the discharge through the sample, A is the gross area of the sample’s cross-section, ∆ is the head loss in a length ∆ and K is a constant known as coefficient of permeability or transmission constant.
First, the flow of leachate is described by a diffusion equation. In the capillary zone, the water flow under the action gradient of the capillary potential, so by the Darcy’s
(3)
Where the permeability of the unsaturated soil is K and depends upon the volumetric moisture content θ. The effects of gravity are ignored.
But with the effect of gravity,
(4)
The continuity equation ensures that
So,
Z K θ Z ·
(5)
This is the moisture transport equation,
Where θ is the water content L L
q; Darcy velocity L T
Z; Elevation computed from surface to bottom (L)
K θ ; Hydraulic conductivity
Ψ is the sunction head (L)
t is time (T)
C is specific moisture capacity equal to ,θ Ψ, K θ
If Ψ Ψ,
Then,
(6)
If ,
(7)
(8)
Where,
, (9)
(10)
Ψ is the suction head near saturation (L)
K is saturation hydraulic conductivity L T
b is an experimental constant
But when the effect of gravity is neglected,
So that
(11)
With the diffusivity for the liquid phase defined by
D θ K θ
This becomes:
(12)
This is the same as the diffusion equation.
The diffusivity is not a single valued function of the moisture content. It has a hysteris which depends on the history of wetting and drying of the soil.
2.4. Percolation Models
Case 1: For One-Dimensional Flow Neglecting the Effect of Gravity
Assumptions: Assumptions made in the development of these models are as follows
(1) That the percolation is considered to be in one direction, however, it is not entirely true since some of these flows are liable to percolate in other direction as well.
(2) That in case one, the diffusivity is considered to be constant, but in reality diffusivity is never constant.
(3) That the effect of gravity can be neglected as in the case one.
From
Using a finite difference method
∆
So we have:
∆ ∆
∆
∆ (13)
∆
∆
ψ BB
(14)
CASE 2: For One-Dimensional Flow Considering the Effect of Gravity
Where K K B
i.e.
∆ ∆ ∆
∆
∆
∆
Where
and
∆
∆ ∆ (15)
∆
∆
∆
ψ BB
B
(16)
CASE 3: For One-Dimensional Flow with the Diffusivity as a Function of Moisture Content and Considering Gravity
∆ ∆
∆
∆ ∆
∆ ∆
∆
∆ (17)
and
∆ ∆
∆
∆ (18)
∆
∆
∆
(19)
3.
Results and Discussion
Simulation / Validation of Results
3.1. For the Landfill Leachate Generation Model
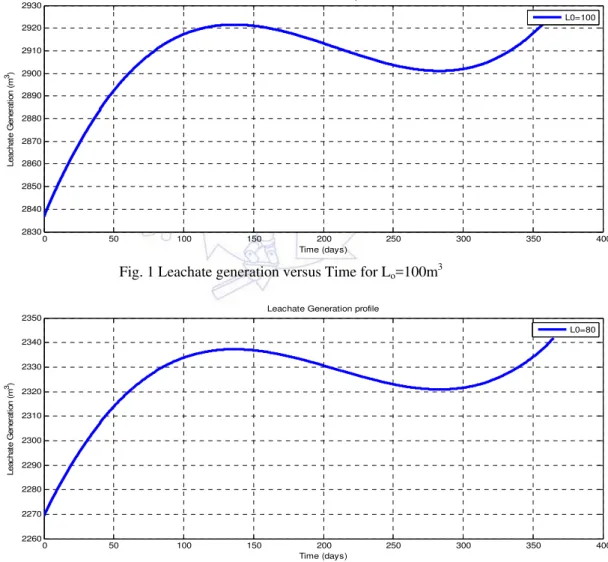
For the generation models, three cases of leachate generation potentials, L0 of 100m3, 80m3 and 50m3 were considered. Using MATLAB with the following range of values: K = 1(1/yr), M = 50 tonnes and t = 10.3.2. Design constraints
Fig. 1 Leachate generation versus Time for Lo=100m3
Fig. 2 Leachate generation versus Time for Lo=80m3
0 50 100 150 200 250 300 350 400 2830
2840 2850 2860 2870 2880 2890 2900 2910 2920 2930
Time (days)
Lea
c
ha
te G
en
er
a
ti
on
(
m
3)
Leachate Generation profile
L0=100
0 50 100 150 200 250 300 350 400 2260
2270 2280 2290 2300 2310 2320 2330 2340 2350
Time (days)
L
eac
hat
e G
ene
rat
ion
(
m
3)
Leachate Generation profile
Fig. 3 Leachate generation versus Time for Lo=50m3
From the figures above, the quantity of the leachate generated increases steadily at the initial stage until it reaches a maximum volume of 2920m3, 2338m3 and 1461m3, then decreases as the time increases due to less organics matters in the landfill and later increases after 275 days. This is similar in all the three cases. The leachate generation models and results
above were validated [1]
.
3.2. For the Landfill Leachate Generation Model
CASE 1: For One-Dimensional Flow Neglecting the Effect of Gravity
2
2
t Z
D
Using MATLAB with the following boundary and initial conditions:
= 0 = 0.02mg/m3 t = 0, 0 H
= max = 5mg/m3 t > 0, = 0
= min = 0.01mg/m3 t > 0, = H
For a length of landfill=195cm, =1.95m, total time of simulation=163days
KS = Saturation hydraulic conductivity=0.544cm/day=0.00544m/day
s
=0.1-0.3%
S
=Suction head near saturation=100cm=1.00m,
∆z and ∆t are chosen to give a very good acuracy.
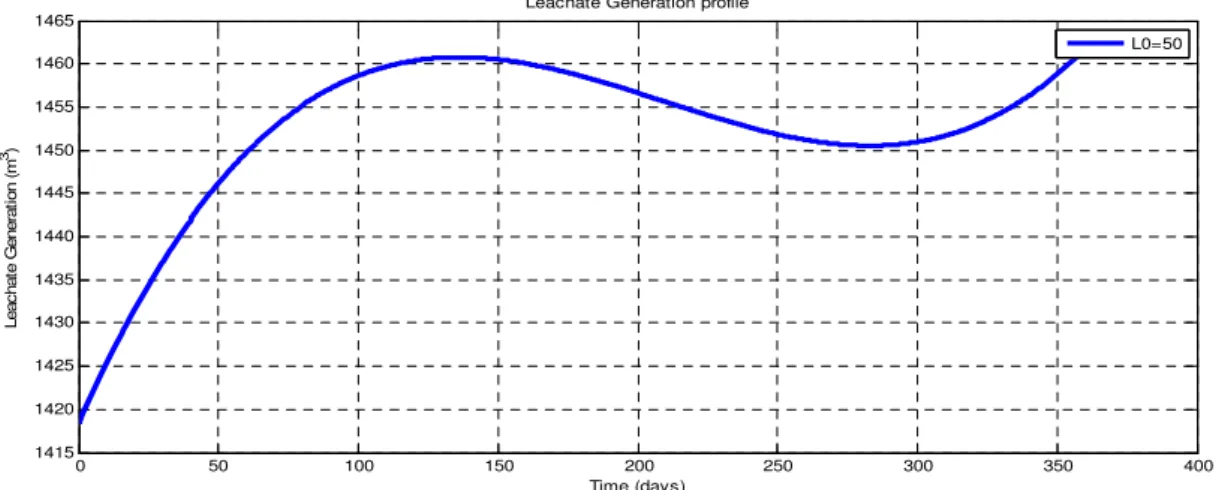
Figures 4 and 5 show the variation of the concentration with distance and time respectively, concentration begins to diminish after 12 and 14 days for 0.488m and 0.325m from the source respectively.
The percolation of the leachate through the ground to the underground water can be evaluated in order to determine the distance from the landfill where the concentration of the leachate will become almost zero and the underground water can be safe for domestic use and other purposes.
0 50 100 150 200 250 300 350 400
1415 1420 1425 1430 1435 1440 1445 1450 1455 1460 1465
Time (days)
Leac
hat
e G
ener
at
ion (
m
3)
Leachate Generation profile
Fig. 4 Concentration versus Distance
Fig. 5 Concentration versus Time
CASE 2: For One-Dimensional Flow Considering the Effect of Gravity
( ) 2 2 t D
For a length of landfill=240cm=2.4m, total time of simulation=1000 days KS = Saturation hydraulic conductivity=0.223cm/day=0.00223m/day
s
=0.1-0.3%S
=100cm=1m,Using MATLAB with the following boundary and initial conditions:
= 0 = 0.02mg/m3 t = 0, 0 H
= max = 5mg/m3 t > 0, = 0
= min = 0.01mg/m3 t > 0, = H
0 0.5 1 1.5 2 2.5 3 3.5 4 4.5
0 0.5 1 1.5 2 2.5 3 3.5 4 4.5 5 Distance (m) C onc ent rat ion ( g/ m 3)
0 2 4 6 8 10 12 14 16 18
0 0.2 0.4 0.6 0.8 1 1.2 1.4 Time (days) Leac h at e Conc e nt rat ion (g /m 3)
Leachate Concentration Profile over Time
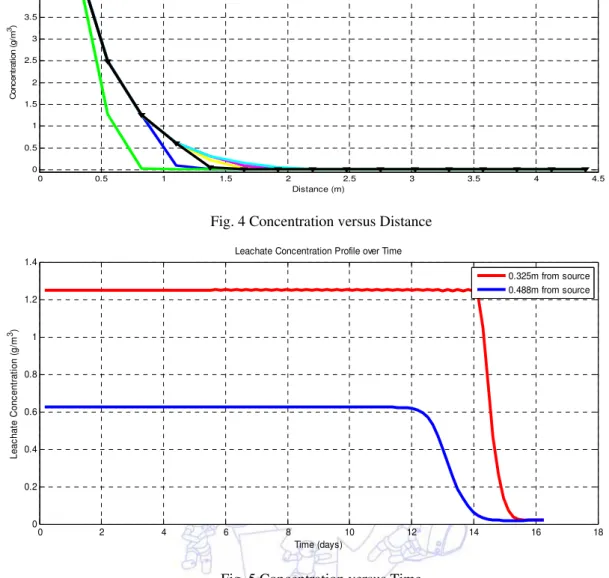
Fig. 6 Concentration versus Distance
Fig. 7 Concentration versus Time
Figures 6 and 7 show the effects of gravity when the diffusivity is kept constant, the concentration decreases gradually. However, when the gravity was not considered, the decrease was very rapid.
Also, with the effect of gravity, the decrease in concentration starts just after a (one) day, but when the gravity was neglected, the concentration remains constant for a longer period before it starts to decrease after 12 days. From the figure above it can be inferred that gravity influences the rate of change in the concentration of the leachate generation as the leachate percolates downward to the underground water.
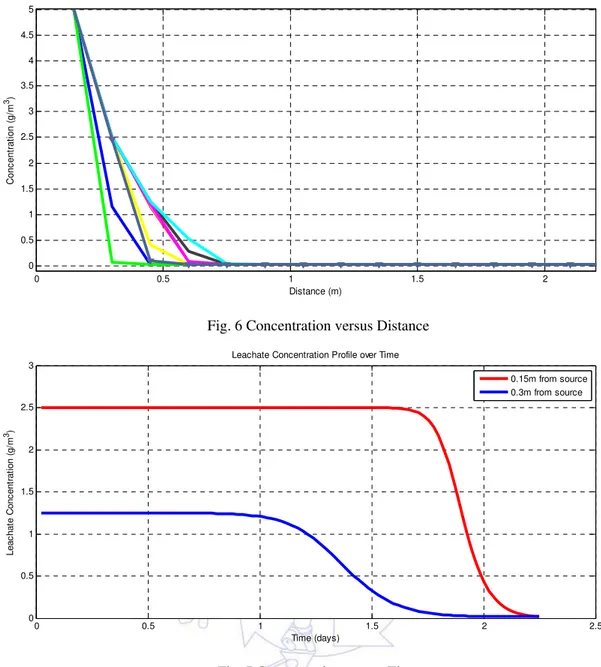
CASE 3: For One-Dimensional Flow with the Diffusivity as a Function of Moisture Content and Considering Gravity
) ( ) ( t K DUsing MATLAB with the following boundary and initial conditions
= 0 = 0.02mg/m3 t = 0, 0 H
= max = 5mg/m3 t > 0, = 0
= min = 0.01mg/m3 t > 0, = H
For a length of landfill=610cm=6.10m, total time of simulation=1410 days
0 0.5 1 1.5 2
0 0.5 1 1.5 2 2.5 3 3.5 4 4.5 5 Distance (m) C onc ent rat ion ( g/ m 3)
0 0.5 1 1.5 2 2.5
0 0.5 1 1.5 2 2.5 3 Time (days) Leac hat e C onc ent rat ion ( g/ m 3)
Leachate Concentration Profile over Time
KS = Saturation hydraulic conductivity=0.0018cm/day=0.000018m/day
s
=0.1-0.3%
S
=35cm=0.35m,
This is a real life obtainable condition; this shows that the diffusivity is not constant and that the effect of gravity is considered. From Figures 8 and 9, it is noted that when the diffusivity and gravity are put into consideration, the concentration of the leachate decreases gradually and slowly. The percolation models were validated with experimental measurements [8, 11,
6]
.
Fig. 8 Concentration versus Distance
Fig. 9 Concentration versus Distance
4.
Conclusions
The mathematical models of Leachate production from Waste Contained Site has been developed and validated. When the leachate generation potentials, Lo were 100m3, 80m3 and 50m3, the maximum amount of leachate generated were about
2920m3, 2338m3 and 1461m3 for about 130 days respectively. The effects of diffusivity, amount of organic content present within the wastes and gravity cannot be over-looked during the percolation phases of Leachate generation and concentration
0 0.5 1 1.5 2 2.5
0 0.5 1 1.5 2 2.5 3 3.5 4 4.5 5
Distance (m)
C
o
nc
ent
rat
ion (
g
/m
3)
0 0.5 1 1.5 2 2.5
0 0.5 1 1.5 2 2.5 3
Time (days)
Le
ac
hat
e C
onc
e
n
tr
at
ion
(
g
/m
3)
Leachate Concentration Profile over Time
from Waste Contained Site.
Considering the adverse effects of environmental pollutions; air and water types, proper management of wastes from the generation to the final stage of disposal, nature of the place where they are been disposed (Landfill or Waste Contained Site) are all very important and should be given adequate consideration in order to minimize hazardous effects on underground water.
References
[1] E. Demirekler, R. K. Rowe, K. Unlu, “Modelling Leachate Production from Municipal Solid Waste Landfills,” Seventh International Waste Management and Landfill symposium, Cagliari, Italy, vol.2, October 1999, pp 17-24.
[2] D. Fatta, A. Papadopoulos, M. Loizidou, “A Study on the Landfill Leachate and its Impact on the Ground Water Quality of the Greater Area,” Environmental Geochemical Health 21 (2), unpublished, 1999, pp 175 - 190.
[3] Franklin, Associates, Ltd, "Characterization of Municipal Solid Waste in the U.S., 1995, Update," unpublished, Prairie Village, Kansas.
[4] J. P. A. Hettiaratchi, “New Trends in Waste Management: North American Perspective,” Proceedings of the International Conference on Sustainable Solid Waste Management, 5 - 7 September, 2007, Chennai, India. pp. 9-14.
[5] P. T. McCreanor, “Landfill Leachate Recirculation System Mathematical Modeling and Validation,” Ph.D. Thesis, Department of Civil and Environmental Engineering, University of Central Florida, 1998.
[6] S. A. Mirbagheri, and H. R. Kazemi Esfeh, “Finite Modelling of Leaching From a Municipal Landfill,” Journal of Applied Sciences, vol. 8 (4), pp 629-635, 2008
[7] E. M. Oldenburg, Burgling, Hazen, T.E, “Multiphase Modeling of Flow, Transport and Biodegradation in a Mesoscale Landfill Bioreactor,”Earth Science Division Lawrence Berkeley National Laboratory Berkeley, CA 94720, 2002, unpublished.