Objective: The purpose of this study was to evaluate the inluence of the magniication factor of the radiographic image in angu-lar, linear and proportional measurements. Methods: From a dried human skull where metallic spheres with predetermined size were ixed (1.0 mm), 14 radiographs were obtained in devices of three diferent manufacturers: Panoura, Instrumentarium and Tomeceph. The Pearson correlation test was used to investigate the relationship between the rate of radiographic magniication and the cephalometric measurements assessed. Results: According to the results, the linear measurements showed a high positive correlation, pointing out great inluence of the magniication factor, while the angular and proportional measurements did not correlate. Conclusions: Comparisons between linear cephalometric measurements obtained with diferent devices from the same manufacturer showed maximum rates of expansion of 0.6%, 1.25% and 2.3%, respectively, for the devices from Instrumentarium (OP-100, Instrumentarium, Finland), Panoura (10CSU, Yoshida, Japan) and Satelec/Tomeceph (XMind, Satelec/Tomeceph Orion Corporation, Finland).
Keywords: Orthodontics. Diagnostic. Radiograph. Radiographic magniication.
Objetivo: avaliar a inluência do fator de magniicação da imagem radiográica nas grandezas angulares, lineares e proporcionais. Métodos: a partir de um crânio seco humano, no qual foram ixadas esferas metálicas de dimensões pré-deinidas (1,0mm de diâmetro), 14 telerradiograias foram obtidas em diferentes aparelhos de três fabricantes: Panoura, Instrumentarium e Tomeceph. Foi realizada a análise estatística descritiva e utilizado o teste de correlação de Pearson para veriicar a relação entre a taxa de mag-niicação radiográica e as grandezas cefalométricas analisadas. Resultados: as medidas lineares apresentaram alta correlação posi-tiva, evidenciando grande inluência do fator de magniicação sobre essas grandezas, ao passo que as angulares e proporcionais não apresentaram correlação. Conclusão: comparações entre medidas cefalométricas lineares obtidas com diferentes aparelhos do mesmo fabricante demonstraram taxas de ampliações máximas de 0,6%, 1,25% e 2,3%, respectivamente, para os aparelhos Instrumentium (OP-100 Instrumentarium), Panoura (10CSU Yoshida) e Satelec/Tomeceph (XMind Satelec/Tomeceph Orion Corp).
Palavras-chave: Ortodontia. Diagnóstico. Radiograia. Ampliação radiográica.
Evaluation of radiographic magniication in lateral
cephalograms obtained with diferent X-ray devices:
Experimental study in human dry skull
José Rino Neto1, João Batista de Paiva2, Gilberto Vilanova Queiroz3, Miguel Ferragut Attizzani4, Hiroshi Miasiro Junior4
How to cite this article: Rino Neto J, Paiva JB, Queiroz GV, Attizzani MF, Miasiro Junior H. Evaluation of radiographic magnification in lateral cephalograms obtained with different X-ray devices: Experimental study in human dry skull. Dental Press J Orthod. 2013 Mar-Apr;18(2):17.e1-7.
Submitted: October 13, 2008 - Revised and accepted: March 09, 2009
Contact address:José Rino Neto
Av. Professor Lineu Prestes, 2227 – Cidade Universitária – Brazil CEP: 05.508-000 – São Paulo/SP - E-mail: [email protected]
1 Associate Professor, Department of Orthodontics, FOUSP 2 Head Professor, Department of Orthodontics, FOUSP
3 PhD in Orthodontics. FOUSP. Professor of the Specialization Course in
Orthodontics, ABENO.
4 MSc in Orthodontics, FOUSP. Specialist in Orthodontics, Department of
Orthodontics, FOUSP FUNDECTO / FOUSP.
Figure 1 - Diagram showing the process of radiographic magniication. In the position “A” of the ilm due to the proximity of this one in relation to the patient, there will be less image magniication comparing to the position “B”. (Source: Weems,27 1995).
INTRODUCTION
Lateral cephalometric radiographs are important in growth analysis, diagnosis, treatment planning and re-sults. The basic equipment to obtain them consists of an X-ray source, an adjustable cephalostat, a chassis for the X-ray ilm with intensifying screens and the support to the chassis. All these components are rigidly attached to each other and arranged at predetermined distances, thus creating a unit.
For obtaining reliable images, one must know, de-termine, and if possible, control the several variables related to its performing. Freitas et al11 pointed
didacti-cally the many factors related to the formation of ra-diographic image. One relates to the geometry and it is also related to the principles of formation of radio-graphic images, being directly related to the position of the emitting source of X-rays, the object and the ilm, that are governed by the principle of geometric optics.
Regarding the use of cephalometric radiographs, either lateral or frontal, the factors that have great in-luence on the image are: The radiographic distortion, radiographic magniication and errors in the delimita-tion of the points and in the cephalometric measure-ments.1-8,11,12,16-19,23
Radiographic distortion
In obtaining lateral cephalometric radiographs, the cephalostat allows the midsagittal plane of the individual to remain parallel to the radiographic ilm and perpen-dicular to the X-ray beams. Horizontal head rotations cause changes in the alignment between beams and the object, causing distortions in the image, consisting of the mistaken duplication of a particular structure or area, causing inaccuracies in the analysis of overlaps that could be performed.22
Radiographic magnification
Because the X-rays emanating from the source have a divergent pattern, there is a variation in the amount of magniication of the object in any radiograph.2,22 To
reduce the magniication in lateral cephalometric ra-diographs, one should increase the distance between the source of X-rays and the object to be radiographed in order to take advantage of the central beam, which is latter, and also decrease the distance between the ob-ject and the radiographic ilm.4,9,15,21 It is recommended
a distance of 152.4 cm between the X-ray source and the
sagittal plane, considering that increasing the distance would result in loss of penetration of rays.6 According to
Weens27 magniication of craniofacial structures varies
from almost 0% up to 24% in objects close to the ilm or objects in the exact center of the rays. This magni-ication is not constant for all possible sagittal plane of patient. Structures located closer to the ilm will pres-ent lower magniication comparing to those closer to the rays. As mentioned earlier, another variable, considering the magniication factor, would be the distance between the midsagittal plane of the individual and the ilm. To minimize variations between diferent patients and ob-tain consistent measurements in an individual over time, it is recommended to maintain constant this distance. An average distance of 15 cm is oten used, although it would be ideal to position the frame as close to the patient’s head as possible to reduce the magniication (Fig 1).
Errors in tracing landmarks and cephalometric measurements
In a study by Bjork and Solow,7 it was observed that the
tracing process introduces signiicant systematic errors. Depending on the anatomical structures assessed, there is more or less variability in the tracing of landmarks.5
The reproducibility in the tracing of landmarks and linear measurements was studied by Midtgard et al.17
Ac-cording to the authors, measurement errors are directly dependent on the precise tracing of the landmarks. In a similar study, Savage et al21 found out that the
repro-ducibility is dependent upon and varies according to the
Midsagittal plane Position “B”
of the film Position “A” of the film
X-ray beam Central X-ray beam
Collimator
152.4 cm
evaluated structure, and it was not associated to the level of experience of the observer or the quality of the radio-graphic image for tracing.
The cephalometric radiographs are used by both clinical orthodontists and researchers, that through an-gular, linear and proportional measurements seek to describe the craniofacial morphology and compare the results of diferent orthodontic treatments. In order to increase the accuracy in the interpretation of cephalo-metric measurements, the objectives of this study are:
a) To verify the possible inluence of radiographic magniication on angular, linear and proportional mea-surements, formed by anatomical points located in the midsagittal plane or by a combination of points in the midsagittal plane and lateral regions of the face.
b) To check the rates of radiographic magniication in lateral cephalometric radiographs obtained in difer-ent machines from the same manufacturer.
MATERIAL AND METHODS
The sample consisted of 14 lateral cephalometric radiographs of a dry skull belonging to the Institute of Biomedical Sciences, University of São Paulo, ob-tained using 14 diferent X-rays devices. The device models provided by radiological institutes were Panoura (10CSU-Yoshida, Japan), Instrumentarium (OP100, Instrumentarium, Finland) and Satelec/Tomeceph (XMindSatelec / Tomeceph-Orion Corp., Finland).
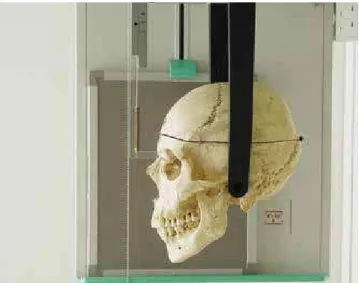
The position of the skull was oriented in the cepha-lostat, with the Frankfort horizontal plane parallel to the horizon, while maintaining the midsagittal plane perpendicular to it. The ear rods were inserted into the external auditory canal, preventing rotation of the skull and then adjusted to nasal positioner for maintenance of the position (Fig 2). To standardize the acquisition of the radiographs, only devices whose chassis were posi-tioned on the right side of the skull were used. The up-per teeth were ixed to the lower ones with acrylic resin to maintain constant the relation between the mandible and the skull, avoiding errors in the measurements. Due to the diference between the speciications of the de-vices, their adjustment was based on the quality of the radiographic image produced, especially in the sharp-ness of radiopaque markers. The brand of ilms used were Kodak, 18x24 T-MAT G/RA. The radiographic processing was performed in the radiology institutes themselves, always using automatic processors.
In order to eliminate errors in the identiication of landmarks that could lead to errors of reproducibility and measurement,5,7,12,14,16,17,19 radiopaque markers were
ixed in dry skull (standardized steel balls with 1.0-mm diameter) at the sites described in Table 1 and shown in Figures 3, 4 and 5. In relation to points located outside the midsagittal plane, it was advocated ixing the metallic markers on the right side of the skull to make them closer to the chassis and to have the smallest magniication.22
Ater obtaining the lateral cephalometric radio-graphs, they were scanned. The landmarks were traced on the metal spheres, using the Radiocef program (Ra-dioMemory-Brazil). The lines and plans shown on Fig-ure 6 and Table 2 were outlined for evaluation.
Further, we evaluated the cephalometric measure-ments described on Tables 3, 4, 5.
Figure 2 - Positioning the skull on the cephalostat.
Table 1 - Anatomical structures.
Nasion (N) Anterior-most point of frontonasal suture
Anterior sella (AS) The deepest portion of the anterior concavity of the sella turcica.
Anterior nasal spine (ANS) Vertex of the anterior nasal spine.
Posterior nasal spine (PNS) Vertex of the posterior nasal spine.
Point A The deepest point of the anterior concavity in
the maxilla.
Menton (Me) Most inferior point of the mandibular symphysis.
Gonion (Go) Most posterior inferior point on the mandibular
angle.
Xi The geometric center of the ramus of the
using the Dahlberg’s formula. To evaluate the error of measurement as to the tracing of the landmarks, ive lat-eral radiographs were randomly selected and submitted again to the digitization process.
The statistical descriptive analysis was performed and the Pearson correlation test was used to verify the relationship between the rate of radiographic magniica-tion and the accuracy of cephalometric measurements.
Table 2 - Lines and planes.
Figure 3 - View of the radiopaque marker located in the mandibular angle.
Figure 4 - View of the radiopaque marker located in the frontonasal suture, corresponding to the point N.
Figure 5 - Scheme of the dry skull, with the rep-resentation of the sites where the radiopaque markers were attached.
N-A Line joining nasion and A point
Sa-N Line joining the anterior sella and nasion
Go-Me Line joining gonion and menton
Go-ANS Line joining gonion and anterior nasal spine
ANS-PNS Line joining anterior nasal spine and posterior nasal spine
Xi-ANS Line joining point Xi and the anterior nasal spine
Xi-Me Line joining point Xi and the menton
Table 3 - Linear measurements.
Sa-N Distance between Sa and N points.
Located in the midsagittal plane.
Go-Me Distance between the Go and Me points. Plane with one structure on the right side and one on the midsagittal plane.
Table 4 - Angular measurements.
Sa.N.A Angle formed by lines Sa-N and N-A. Angle formed by
structures located in the midsagittal plane
ANS.Xi.Me
Angle formed by lines connecting the points ANS-Xi and
Xi-Me. Angle formed by structures located in the midsagittal plane and in the right side.
Table 5 - Proportion measurements.
ANS-PNS:Sa-N Proportion between the distances ANS-PNS and As-N. Formed by lines located in the midsagittal plane.
Sa-N:Go-Me
Proportion between the distances Sa-N and Go-Me.
Formed by a line located in the midsagittal plane and one on the right side of the midsagittal plane
Figure 6 - Scheme of the dry skull with the cephalograms for representation of reference lines and planes.
The measurements were obtained by a single op-erator, twice, at diferent times, and their means were considered for analysis. The angular and linear cephalo-metric measurements were presented as means, medians and standard deviations. To evaluate the accuracy in the positioning of the skull in the cephalostat, two new lat-eral cephalometric radiographs were obtained in ive of the devices used. These measurements were compared
N
ANS A
Me Go
upper Go Xi
PNS R1
measurements showed high positive correlation for lin-ear measurements, while the angular and proportional did not correlate (Table 7). The radiographs obtained with each brand of equipment were ordered in increas-ing order of magniication from the lowest value found to Sa-N linear measurement. The highest diferences were of 0.6 mm, 0.8 mm and 1.5 mm, respectively for the brands Instrumentarium, Panoura and Satelec.
In Table 8 one can observe the percentage values of corresponding magniications.
DISCUSSION
The reliability of the results of this study depends on the control of errors related to the positioning of the skull in the tracing of landmarks.
RESULTS
There were no significant differences in the evalu-ation of the method error according to data obtained with the Dahlberg’s formula. Considering the posi-tioning of the skull and the tracing of landmarks, the method error was 0.27 mm for linear measurements, 0.27° for angular measurements, and 0.0% for pro-portion measurements. The general values obtained for cephalometric measurements are shown in Table 6. The radiographs were ordered in increasing order of magnification from the smallest value found to Sa-N linear measurement.
Pearson’s linear correlation test to investigate the correlation between the rate of magniication of ra-diographic images and the accuracy of cephalometric
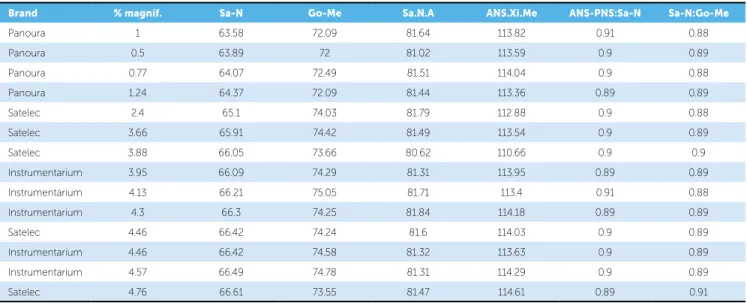
Table 6 - Results of linear, angular and proportional measurements obtained with diferent devices.
Table 7 - Pearson correlation test to evaluate the correlation between the magniication and accuracy of measurements.
Brand % magnif. Sa-N Go-Me Sa.N.A ANS.Xi.Me ANS-PNS:Sa-N Sa-N:Go-Me
Panoura 1 63.58 72.09 81.64 113.82 0.91 0.88
Panoura 0.5 63.89 72 81.02 113.59 0.9 0.89
Panoura 0.77 64.07 72.49 81.51 114.04 0.9 0.88
Panoura 1.24 64.37 72.09 81.44 113.36 0.89 0.89
Satelec 2.4 65.1 74.03 81.79 112.88 0.9 0.88
Satelec 3.66 65.91 74.42 81.49 113.54 0.9 0.89
Satelec 3.88 66.05 73.66 80.62 110.66 0.9 0.9
Instrumentarium 3.95 66.09 74.29 81.31 113.95 0.89 0.89
Instrumentarium 4.13 66.21 75.05 81.71 113.4 0.91 0.88
Instrumentarium 4.3 66.3 74.25 81.84 114.18 0.89 0.89
Satelec 4.46 66.42 74.24 81.6 114.03 0.9 0.89
Instrumentarium 4.46 66.42 74.58 81.32 113.63 0.9 0.89
Instrumentarium 4.57 66.49 74.78 81.31 114.29 0.9 0.89
Satelec 4.76 66.61 73.55 81.47 114.61 0.89 0.91
Sa-N Go-Me Sa.N.A ANS.Xi.Me ANS-PNS:Sa-N Sa-N:Go-Me
% magnif. 0.989803 0.880141 0.032727 0.065401 -0.20471 0.47854
Table 8 - Results of linear measurements obtained with diferent devices of the same brand and model.
Panoura Satelec Instrumentarium
% magnif. Sa-N Go-Me % magnif. Sa-N Go-Me % magnif. Sa-N Go-Me
1 63.58 72.09 1 65.1 74.03 1 66.09 74.29
0.5 63.89 72 1.24 65.91 74.42 0.18 66.21 75.05
0.77 64.07 72.49 1.6 66.05 73.66 0.31 66.3 74.25
1.24 64.37 72.09 2 66.42 74.24 0.49 66.42 74.58
– – – 2.3 66.61 73.55 0.6 66.49 74.78
x 0.88 63.9 72.16 1.62 66.02 73.98 0.51 66.3 74.59
S.D. 0.31 0.33 0.22 0.53 0.58 0.37 0.31 0.16 0.33
As found in the literature, a frequent cause for the ap-pearance of ghost images is related to improper position-ing of the patient in the cephalostat.3,4,18,22,23 Studies about
radiographic distortion using dry skulls are mentioned in the literature, evaluating the inluence of head position in radiographs acquisition. According to Ahlqvist et al,3
rotations of the object up to 5° resulted in a variation of less than 1% in length of the linear measurements. Rota-tions greater than 5° may result in noticeable cephalomet-ric errors, and as they are evident when positioning the patient, they must be corrected prior to exposure. In a study by Spolyar,22 it was observed a mean linear change
of 1.7 mm ranging from 0.5 to 6.2 mm, and mean angu-lar changes of 1.59°, ranging from 0 to 5.23°. According to another study by Ahlqvist et al,4 cranial rotations of 5°
to 10° were responsible for signiicant distortions in the angular measurements. Rotation of the head in the verti-cal direction (Z axis) also cause a distortion, and Yoon et al28 noted that the angular measures showed projection
errors smaller than the linear measures, and that the use of references located on the midsagittal plane for angular measurements showed less distortion.
In the present study to evaluate the existence of errors related to the positioning of the skull in cephalostat, two lateral cephalometric radiographs were taken at diferent times, totaling ive X-ray devices in the evaluation of the method error. There were no rotations of the skull, dis-carding the incorporation of signiicant distortions that could inluence the cephalometric measurements.
Another problem for studies that use cephalometric radiographs, is the location of the landmarks.5,7,13,17,20,21,23
Its accuracy depends on the anatomical structure used, the radiographic image quality, visual acuity and expe-rience of the operator on locating the landmarks, con-sidering that great care must be taken so that measure-ment errors do not inluence the study.5,7 In order to
avoid the incorporation of errors in the identiication of landmarks, we chose to ixate 1-mm radiopaque spheres in selected regions of the dry skull.
The irst objective of this study was to evaluate the inluence of image magniication rate on the angular, linear and proportional cephalometric measurements using lateral cephalometric radiographs. Measures lo-cated in the midsagittal plane and lateral regions of the face were analyzed.
According to Bergensen,6 the magniication rate
in lateral cephalometric radiographs ranges from 4.6% to 7.2%. The results are related to the location of landmarks outside the midsagittal plane and to the variation of distance between the ilm and the X-ray source. Adams1 in its cephalometric study also noted
a signiicant variation for linear measurements, as the distance from the X-ray source was increased. In the same study, the angular measurements showed an av-erage increase of 1°, with less variation for measures which references were in the midsagittal plane, and greater variation for those located in the mandible. The author concluded that the variation for these measures, especially the linear ones, increases as the distance from the central beam of X-rays is increased.
According to the results obtained with the Pearson’s test, the linear measurements showed a high positive cor-relation with the rate of image magniication, while the angular and proportional ones, did not correlate (Table 7). These results conirm that the angular measurements are subjected to small changes. This was also observed for pro-portional measurements, which showed small correlation. Linear measurements derived from landmarks locat-ed in the midsagittal plane showlocat-ed dimensional changes that were similar to those from linear measurements that have reference points located in the midsagittal plane and in the lateral regions of the face (Table 6).
The magniication rate of radiographic images is an important factor because most orthodontic studies are based on cephalometric analysis and its measurements are made on cephalometric radiographs obtained with dif-ferent X-ray devices.12,14 However, despite it is known
that it inluences the measures, the magniication rate is not mentioned in several articles. Radiographs collected for several years are an important source for retrospec-tive studies; however, not knowing its magniication rates prevents its use in longitudinal studies. A possible alterna-tive to validate the use of these radiographs would be to ensure equal magniication rates in devices with the same brand and model, allowing for the determination of the magniication rate in equal devices still in use.
The images obtained with diferent X-ray devices of the same type and brand did not show uniform magni-ication rates, with linear variations ranging from 0.4 to 1.5 mm, corresponding to magniication percentages of 0.6 to 2.3% (Table 8).
Although variations in the magnification rate of the device of the brand Instrumentarium were very low, generally it is not recommended to compare lin-ear cephalometric measurements made with different X-ray devices, even those of the same brand and model, being necessary to use a ruler to standardize the magni-ication rate of radiographs.
1. Adams JW. Correction of error in cephalometric roentgenograms. Angle Orthod. 1940;10(1):3-13.
2. Ahlquist J, Eliasson S, Welander U. The cephalographic projection. Part II. Principles of image distortion in cephalography. Dentomaxillofac Radiol. 1983;12(2):101-8.
3. Ahlqvist J, Eliasson S, Welander U. The efect of projection errors on cephalometric length measurements. Eur J Orthod. 1986;8(3):141-8. 4. Ahlqvist J, Eliasson S, Welander U. The effect of projection errors on
angular measurements in cephalometry. Eur J Orthod. 1988;10(4):353-61.
5. Baumrind S, Frantz RC. The reliability of head ilm measurements. 1- Landmark identiication. Am J Orthod. 1971;60(2):111-27.
6. Bergensen EO. Enlargement and distortion in cephalometric radiography: compensation tables for linear measurements. Angle Orthod.
1980;50(3):230-44.
7. Björk A, Solow B. Measurement on radiographs. J Dent Res. 1962;41(3):672-83.
8. Buschang PH. Cephalometric reliability: A full ANOVA model for the estimation of true and error variance. Angle Orthod. 1987;57(2):168-75. 9. Dibbets JMH, Nolte K. Efect of magniication on lateral cephalometric
studies. Am J Orthod Dentofacial Orthop. 2002;122(2):196-201. 10. Franklin JB. Certain factors of aberration to be considered in clinical
roentgenographic cephalometry. Am J Orthod. 1952;38(5):351-68. 11. Freitas L. Fatores na produção da imagem radiográica. In: Freitas A, et al.
Radiologia odontológica. 2a ed. São Paulo: Artes Médicas; 1988. p. 61-70. 12. Hsiao T, Chang H, Liu K. A method of magniication correction
for posteroanterior radiographic cephalometry. Angle Orthod. 1997;67(2):137-42.
13. Jarvinen S. A study of the factors causing diferences in relative variability of linear radiographic cephalometric measurements. Am J Orthod Dentofacial Orthop. 1987;92(1):17-23.
14. Lew KKK. Superimposition of cephalometric radiographs with diferent machine magniications. Br J Orthod. 1989;16(4):281-3.
REFERENcEs
15. Lundgren D, Owman-Moll P, Kurol J, Mårtensson B. Accuracy of orthodontic force and tooth movement measurements. Br J Orthod. 1996;23(3):241-8. 16. Macri V, Athanasiou AE. Sources of error in lateral cephalometry. In:
Athanasiou AE. Orthodontic cephalometry. England: Mosby-Wolfe; 1995. p. 125-40.
17. Midtgard J, Björk G, Linder-Aronson S. Reproducibility landmarks and errors of measurements of cephalometric cranial distances. Angle Orthod. 1976;44(1):56-61.
18. Nawrath K. Moglichkeiten und Grenzen der rontgenologischen Kephalometrie. Habilitationsschrift der Johannes Gutenbeg-Universitat, Mains 1961.
19. Phillips C, Greer J, Vig P, Matteson S. Photocephalometry: errors of projection and landmark location. Am J Orthod. 1984;86(3):233-43. 20. Sandler PJ. Reproducibility of cephalometric measurements. Br J Orthod.
1988;15(2):105-10.
21. Savage AW, Showfety KJ, Yancey J. Repeated measures analysis of geometrically constructed and directly determined cephalometry points. Am J Orthod Dentofacial Orthop. 1987;91(4):295-9.
22. Spolyar JL. Head positioning error in cephalometric radiography - an implant study. Angle Orthod. 1987;57(1):77-88.
23. Stabrum AE, Danielsen K. Precision in cephalometric landmark identiication. Eur J Orthod. 1982;4:185-96.
24. Thurow RC. Cephalometric methods in research and private practice. Angle Orthod. 1951;21(2):104-16.
25. Tng TTH, Chan TCK, Cooke MS. Validity of cephalometric landmarks. An experimental study on human skulls. Eur J Orthod. 1994;16(2):110-20. 26. Van Aken J. Geometrical errors in lateral skull x-ray projections. Nederlands
Tidschrift voor Tandheelkunde. 1963;70:18-30.
27. Weems RA. Radiographic cephalometric technique. In: Jacobson A. Radiographic cephalometry from basics to video imaging. Carol Stream: Quintessence; 1995. p. 39-52.
28. Yoon YJ, Kim KS, Hwang MS, Kim HJ, Choi EH, Kim KW. Efect of head rotation on lateral cephalometric radiographs. Angle Orthod. 2001;71(5):396-403.
CONCLUSIONS
The radiographic magniication showed high positive correlation with the linear measurements, being responsible for signiicant variations, regardless of whether the anatomical points were located in the midsagittal plane or lateral regions of the face. The angular and proportional measurements showed no signiicant correlation.