Protein sources and digestive enzyme activities in
jundiá (
Rhamdia quelen
)
Rafael Lazzari
1; João Radünz Neto
1*; Fabio de Araújo Pedron
1; Vania Lucia Loro
2;
Alexandra Pretto
2; Carolina Rosa Gioda
31
UFSM – Depto. de Zootecnia, Campus Universitário, Av. Roraima, 1000 – 97105-900 – Santa Maria, RS – Brasil.
2
UFSM – Depto. de Química – Lab. de Bioquímica Adaptativa. 3
UFMG – Instituto de Ciências Biológicas, Av. Antônio Carlos, 6627 - Pampulha - 31270-901 - Belo Horizonte, MG – Brasil.
*Corresponding author <[email protected]>
ABSTRACT:Digestive enzymes activity influence feed utilization by fish, and its understanding is important to optimize diet formulation. This study reports the digestive enzyme activities of jundiá juveniles fed diets with protein sources. Fish were fed six experimental diets for 90 days: MBY (meat and bone meal + sugar cane yeast), SY (soybean meal + sugar cane yeast), S (soybean meal), MBS (meat and bone meal + soybean meal), FY (fish meal + sugar cane yeast) and FS (fish meal + soybean meal), and then sampled every 30 days and assayed in two intestine sections for digestive enzymes – trypsin, chymotrypsin and amylase – activities; gastric protease was assayed in the stomach. Digestive and hepatosomatic index, intestinal quotient, digestive tract length and weight gain were also measured. Trypsin and chymotrypsin activities were higher (p < 0.0001) in fish fed diets containing animal protein sources (MBY, MBS, FY and FS diets). Alkaline proteases were negatively affected by dietary soybean meal in the SY and S diets. Amylase activity had greater variation between diets and intestine sections. Fish fed MBY and MBS diets showed higher gastric protease activity (p < 0.0001). Weight gains were higher in fish fed the MBS and FS diets (p < 0.05). Highest values (p < 0.05) of digestive tract length were observed in fish fed MBS and FY diets, but no correlation with enzymes activities was found. Hepatosomatic index (HSI) was affected by diet composition. Dietary composition influenced digestive enzymes activities of jundiá.
Key words: digestion, nutrition, soybean meal, meat and bone meal, fish meal
Fontes protéicas e atividade de enzimas digestivas em jundiás
(
Rhamdia quelen
)
RESUMO:As enzimas digestivas influenciam a utilização dos alimentos em peixes, e seu conhecimento é importante para otimizar a formulação de dietas. Este trabalho descreve a atividade de enzimas digestivas em juvenis de jundiá alimentados com fontes protéicas. Os peixes foram alimentados com seis dietas (90 dias): MBY (farinha de carne e ossos + levedura de cana), SY (farelo de soja + levedura de cana), S (farelo de soja), MBS (farinha de carne e ossos + farelo de soja), FY (farinha de peixe + levedura de cana) e FS (farinha de peixe + farelo de soja). A cada 30 dias, foram analisadas as enzimas digestivas (tripsina, quimiotripsina e amilase) no intestino. No estômago, foi mensurada a protease ácida. Foram estimados os índices digestivo e hepato-somático, quociente intestinal, comprimento do trato digestório e ganho em peso. As atividades de tripsina e quimiotripsina foram maiores (p < 0,0001) nos peixes alimentados com as dietas com fontes de origem animal (MBY, MBS, FY e FS). As proteases alcalinas foram afetadas negativamente pelo farelo de soja nas dietas. A atividade de amilase apresentou grandes variações. Os peixes alimentados com as dietas MBY e MBS apresentaram maior atividade de protease ácida (p < 0,0001). Os ganhos em peso foram maiores nos peixes alimentados com as dietas MBS e FS (p < 0,05). Os maiores valores (p < 0,05) de comprimento do trato digestório foram verificados nos peixes alimentados com as dietas MBS e FY. A composição da dieta influencia na atividade de enzimas digestivas do jundiá.
Palavras-chave: digestão, nutrição, farelo de soja, farinha de carne e ossos, farinha de peixe
Introduction
The study of digestive enzymes is an essential step towards understanding the mechanism of digestion and how organisms adapt to changes in the nutritional envi-ronment (Sunde et al., 2004). Digestive enzyme activities of fish are associated with innate feeding habit and diet
elucidate some aspects of their nutritional physiology (Uys and Hecht, 1987).
The need for optimizing the production of aquafeeds has taken several researchers to evaluate alternative pro-tein sources with homogeneous composition, low cost and good nutrient balance. Animal protein sources are regularly used in feeds, because they present good es-sential amino acids balance (Tacon, 1993). However, higher costs and heterogeneous composition repeatedly limit their use, and the use of alternative sources is re-quired (Webster et al., 1995).
Jundiá (Rhamdia quelen) is a native catfish to South-ern Brazil, an omnivorous fish feeding on small fish, crus-taceans, and vegetable debris in the nature (Gomes et al., 2000). Under farming conditions, jundiá readily ac-cepts various processed aquafeeds, and shows resiliency and high productive potential (Barcellos et al., 2004). A great proportion of the available information on nutri-ent digestion and teleost digestive enzyme profiles and performance refers to environmental conditions, espe-cially temperature, not encountered in nature by most species (Papoutsoglou and Lyndon, 2005). Thus, this study aimed to investigate the digestive enzyme activi-ties in jundiá juveniles fed diets containing different pro-tein sources.
Material and Methods
Fish and experimental diets
The feeding trial was carried out in Santa Maria, Rio Grande do Sul State, Brazil (29º43’S, 53º42’W, 95 m a.s.l.). Five hundred and forty jundiá juveniles (15.00 ± 0.62 g; 11.98 ± 0.35 cm) obtained by induced spawning
were randomly distributed in 18, 280-L tanks (30 fish pertank) in a water recirculation system with biologi-cal filters (Radünz Neto et al., 1987), a completely ran-domized experimental design (n=3). Fish were accli-mated to the experimental conditions for one week and subsequently fed the experimental diets during 90 days, twice a day (9h00 and 17h00 h), to apparent satiation.
Six diets were tested : MBY - meat and bone meal + sugar cane yeast; SY - soybean meal + sugar cane yeast; S - soybean meal; MBS - meat and bone meal + soybean meal; FY - fish meal + sugar cane yeast; and FS - fish meal + soybean meal, formulated to meet Coldebella and Radünz Neto (2002) creteria.. Dry ingredients were ground, mixed and added of canola oil . Water was added at 250 g kg–1 of mixture. The mixtures were then pelleted and dried in oven at 57ºC for 24 h. Pellets were packed in plastic bags and kept at -20ºC until use. Formulation and composition of experimental diets are presented in Tables 1 and 2.
The following water quality parameters were mea-sured daily and were within the limits appropriate for fish production (Gomes et al., 2000): temperature (26.85 ± 1.02 ºC), pH (7.30 ± 0.26), dissolved oxygen (5.53 ± 0.62 mg L–1), alkalinity (48.96 ± 13.40 mg CaCO3 L–1), to-tal ammonia (0.50 ± 0.22 mg L–1) and nitrite (0.06 ± 0.01 mg L–1). Tanks were cleaned by siphoning out feces and food residues every day. Fish were individually weighed at the end of the experiment.
Tissue samples
Every 30 days, three juveniles per tank were captured for excision of digestive tract and liver. Fish fasted for 24 h before collection and were sacrificed by spinal cord
Table 1 – Formulation of experimental diets.
1Diets: MBY: meat and bone meal + sugar cane yeast; SY: soybean meal + sugar cane yeast; S: soybean meal; MBS: meat and bone meal + soybean meal; FY: fish meal + sugar cane yeast; FS: fish meal + soybean meal. 2Vitamin/mineral mixture (kg product): Vit.A: 6000000UI; Vit.B1: 1400 mg; Vit.B2: 3375 mg; Vit.B6: 4830 mg; Vit.B12: 5000 mcg; Vit.C: 25000 mg; Vit.D3: 530000UI; Vit.E: 22500 mg; Vit.K3: 5000 mg; Zinc: 40000 mg. Folic acid: 400mg; Nicotinic acid: 14000mg; Cobalt: 1500mg; Pantothenic acid: 8000 mg; Copper: 15000 mg; Colin: 1500 mg; Iron: 50000 mg; Iodine: 700 mg; Manganese: 23000mg; Selenium: 250mg; 3(32% etoxiquin. 18% propyl-galate. 50% inert).
t n e i d e r g n
I Diet
1
Y B
M SY S MBS FY FS
---- gkg–1------------------------------------------------------------------
--t s a e y e n a c r a g u
S 280 332.7 - - 259.2
-l a e m e n o b d n a t a e
M 385.3 - - 300 -
-l a e m h s i
F - - - - 300.6 224.8
l a e m n a e b y o
S - 332.7 685.3 320 - 300
n i a r g n r o
C 150 134.4 124.5 169.5 200 195
r u o l f t a e h
W 80 100 100 80.3 150 180
l i o a l o n a
C 74.5 70 60 100 60 70
t l a
S 10 10 10 10 10 10
e t a h p s o h p m u i c l a c i
D 10 10 10 10 10 10
e r u t x i m l a r e n i m / n i m a t i
V 2 10 10 10 10 10 10
t n a d i x o i t n
puncture, weighted and eviscerated for separation of di-gestive tract. The didi-gestive tract was measured, weighted and separated in three sections: stomach, anterior and posterior intestines. The sections were immediately stored at –20ºC. Later, each section was dissected in a Petri dish containing saline solution (0.7%, NaCl), the digestive content was discarded and the sections were homogenized (1000 × g) for 2 min in a van Potter_Elvehjem tissue homogenizer with buffer solu-tion pH 7.0. The samples were then centrifuged at 12000 × g for 5 min (4ºC) and the supernatant was used as en-zyme source.
Enzyme assays
At 30 days in the experiment, fish were sampled and the activity of acid protease measured in the stom-ach, and the activity of amylase, trypsin and chymot-rypsin measured in two intestinal sections. Total acid protease activity was measured using non-specific sub-strate (casein) according to Kunitz (1947), with modi-fications by Hidalgo et al. (1999). The assay was car-ried out using 0.2 M KCl buffer, pH 2.0. The absor-bance of the enzyme extract had recorded at 280 nm. All samples were assayed in duplicate and readings
corrected for blank solutions. Tyrosine was used as standard, and one unit of enzyme was defined as the amount of enzyme needed to catalyze the formation of 1.0 mg of tyrosine per min per mg protein, accord-ing to Hidalgo et al. (1999). Alkaline protease, trypsin, chymotrypsin and a-amylase were determined in homogenates from intestinal sections. Trypsin activity (E.C.3.4.21.4) was assayed with a-r-toluenesulphonyl-L-arginine methyl ester hydrochloride (TAME). Crude extracts were incubated for 2 min (25ºC) in 2 mL of Tris/CaCl2 buffer, pH 8.1. Chymotrypsin activity (E.C.3.4.21.1) was assayed with benzoyl tyrosine ethyl ester (BTEE). Crude extracts were incubated for 2 min in 2 mL of Tris/CaCl2 buffer, pH 7.8. Both trypsin and chymotrypsin were assayed in duplicate and enzyme activities were recorded at 247 and 256 nm, respectively, according to protocol by Hummel (1959). One unit of enzyme was defined as the amount of enzyme needed to hydrolyze 1 mg of substrate (TAME or BTEE) per min per mg protein. Activity of a-amylase was assayed in 0.2M phosphate-citrate buffer, pH 7.0, 0.5% NaCl with a starch concentration of 2.5%. The reaction was stopped by adding Ba(OH)2 0.3N and ZnSO4 5%. The experimental protocol was 1Diets: MBY: meat and bone meal + sugar cane yeast; SY: soybean meal + sugar cane yeast; S: soybean meal; MBS: meat and bone meal + soybean meal; FY: fish meal + sugar cane yeast; FS: fish meal + soybean meal. 2Nitrogen free extract calculated by difference. 3DE=[(23.6 kJ g–1× %Protein × 0.9) + (39.8 kJ g–1× %Lipids × 0.85) + (17.2 kJ g–1× %Cho × 0.5)]/100, when 1 KJ=0.239 kcal. 4Calculated values.
Table 2 – Proximate and amino acids composition of the experimental diets.
t e i D 1 Y B
M SY S MBS FY FS
) r e t t a m y r d n i % ( s i s y l a n a e t a m i x o r P n i e t o r p e d u r
C 34.67 32.14 33.03 34.45 32.92 31.92
h s
A 13.24 5.27 6.23 12.98 9.98 10.7
d i p i l e d u r
C 12.75 8.0 7.2 16.4 9.83 11.42
r e b i f e d u r
C 1.80 3.09 4.23 3.67 1.83 3.68
e r u t s i o
M 6.94 7.91 8.95 5.52 6.50 8.00
E F
N 2 37.54 51.50 49.31 32.5 45.44 42.28
m u i c l a
C 3.49 1.36 1.59 3.00 2.16 2.16
s u r o h p s o h
P 2.01 0.75 0.87 1.84 1 7.5 1.58
y g r e n e e l b i t s e g i
D 3(kcalkg–1) 3417.7 3173.9 3087.9 3628.0 3267.1 3248.0
) t e i d n i % ( s d i c a o n i m A 4 e n i n i g r
A 1.79 1.84 2.54 2.15 1.70 2.11
e n i n a l a l y n e h
P 1.04 1.48 1.86 1.28 1.29 1.49
e n i d i t s i
H 0.52 0.75 0.95 0.65 0.95 1.00
e n i c u e l o s
I 1.00 1.45 1.60 1.07 1.31 1.33
e n i s y
L 2.08 2.02 2.14 1.94 2.10 2.00
e n i c u e
L 1.80 2.28 2.60 1.95 2.28 2.35
e n i t s y c + e n i n o i h t e
M 0.81 0.84 1.03 0.87 0.92 0.98
e n i n o e r h
T 1.14 1.44 1.40 1.04 1.43 1.28
n a h p o t p y r
T 0.13 0.27 0.47 0.28 0.27 0.40
e n i l a
modified according to Bernfeld (1955). The determi-nation of starch hydrolysis was done following Park and Johnson (1949). The absorbance was recorded at 660 nm. One unit of enzyme was defined as 1 mmol of glucose released from starch per min per mg of pro-tein. Protein content of crude extracts was determined by the method of Lowry et al. (1951), using bovine se-rum albumin as a standard.
Calculations
Digestive somatic index (DSI) = (digestive tract weight/body weight) × 100; Hepatosomatic index (HSI) = (liver weight/body weight) × 100; Digestive tract length (DTL) = expressed in cm; Intestinal quotient (IQ) = digestive tract length/total fish length; Weight gain (WG) = (final weight – initial weight), in g.
Statistical analysis
Data were assessed for normality using a Shapiro– Wilk test and submitted to one-way ANOVA. Data on activity amylase, trypsin and chymotrypsin were sub-mitted to two-way ANOVA, intestine sections consid-ered in the model. Means were compared by Duncan test (α = 0.05), and values expressed as mean ± standard error (n = 3). All statistics were carried out using SAS® (1997) software.
Results
The activity of digestive enzymes of jundiá juve-niles varied with diet composition (Figures 1, 2 and 3). A decrease (p < 0.0001) in trypsin and chymot-rypsin activities was detected in jundiá fed diets with-out animal source feedstuffs, i. SY and S diets (Fig-ures 1 and 2) in both intestine sections and in all sam-pling periods. Trypsin activity at the end of the ex-periment was higher in the anterior intestine (Figure 1C). The higher trypsin activity (p < 0.0001) after 30 and 60 days was observed in fish fed FS, MBY and MBS diets (Figures 1A and 1B). At 90 days, fish fed diets containing feedstuffs of animal origin combined with soybean meal (MBS and FS) had higher trypsin activity (p < 0.0001).
Chymotrypsin activities were higher in fish fed MBS and FS diets after 30 and 60 feeding days (Figures 2A and 2B). At the end of trial (Figure 2C), fish fed FS diet had higher chymotrypsin activity (p < 0.0001) in the an-terior intestine. In the posan-terior intestine (Figure 2C), higher chymotrypsin activities were found in fish fed MBS and fish meal-based diets (FY and FS).
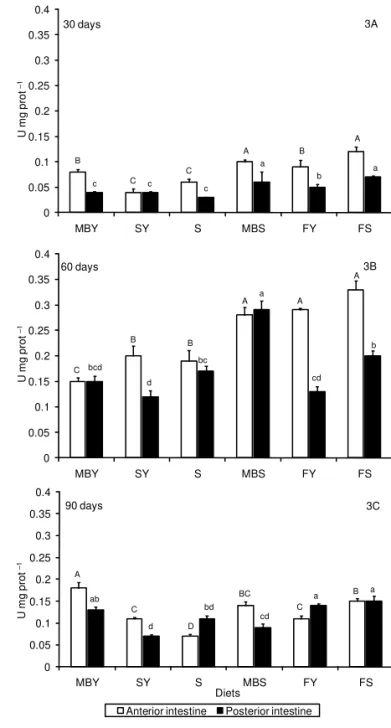
The amylase activitiy showed great variation be-tween feeding periods, intestine sections and diets (Fig-ure 3). At 30 days of trial, higher amylase activities were found in fish fed FS and MBS diets (p < 0.0001). In the posterior intestine (Figure 3A), lower amylase activities were found in fish fed MBY, SY and S diets. Higher amylase secretion was observed after 60 days in the anterior intestine of jundiá fed FY, FS, and MBS diets, and in the posterior intestine of fish fed MBS diet
(Figure 3B). At 90 days, fish fed the MBY diet showed higher amylase activity in the anterior intestine while in fish fed S diet amylase activity was lower (Figure 3C). In the posterior intestine, lower amylase was found in fish fed SY diet. No differences were observed be-tween amylase activities in anterior and posterior in-testines of jundiá (p > 0.05). The acid protease activi-Figure 1 – Trypsin activity (U mg–1 prot) in intestine of jundiá after 30 (1A), 60 (1B) and 90 (1C) days of feeding diets with different protein sources. Values showed as mean ± SEM (n = 3). *U= μmol of substrate (TAME) hydrolyzed per min per mg of protein. Diets: MBY: meat and bone meal + sugar cane yeast; SY: soybean meal + sugar cane yeast; S: soybean meal; MBS: meat and bone meal + soybean meal; FY: fish meal + sugar cane yeast; FS: fish meal + soybean meal. Capital letters indicate difference between diets in the anterior intestine and smaller letters represent difference in the posterior intestine (Duncan’s test, p < 0.0001).
0 1 2 3 4 5 6
MBY SY S MBS FY FS
U
m
g
prot
–1
Diets
Anterior intestine Posterior intestine
90 days 1C
BC
DE E
AB
CD
A
b
d
c
a a ab
0 0.5 1 1.5 2 2.5 3 3.5 4 4.5 5
MBY SY S MBS FY FS
U
m
g
prot
–1
30 days 1A
AB
B
C
A A
A
a
ab b
b ab a
0 0.5 1 1.5 2 2.5 3 3.5 4 4.5 5
MBY SY S MBS FY FS
U
m
g
prot
–1
60 days 1B
A
B
C A
B
A a
b
d a
c
ties were higher (p < 0.0001) in fish fed MBS and FS diets at 30 days of trial (Table 3). At 60 days, fish fed only soybean meal (diet S) showed lower acid protease activity. Fish fed diets containing meat and bone meal (MBS and MBY) showed higher acid protease activities at the end of trial (Table 3).
No differences were observed in the DSI values of jundiá (Table 4). The hepatosomatic index, total
diges-tive tract length and intestinal quotient were higher in fish fed the MBS diet (p < 0.05, Table 4). Values of in-testinal quotient were lower in fish fed diets without the inclusion of animal protein sources (SY and S di-ets). Higher weight gain values (p < 0.05) were obtained in fish fed MBS and FS diets (95.5 and 94.1 g, respec-tively). The juvenile jundiá fed the soybean meal based diet (S diet) showed lower weight gain (15.8 g).
Figure 2 – Chymotrypsin activity (U mg–1 prot) in intestine of jundiá after 30 (2A), 60 (2B) and 90 (2C) feeding days. Values showed as mean ± SEM (n = 3). *U= μmol of substrate (BTEE) hydrolyzed per min per mg of protein. Diets: MBY: meat and bone meal + sugar cane yeast; SY: soybean meal + sugar cane yeast; S: soybean meal; MBS: meat and bone meal + soybean meal; FY: fish meal + sugar cane yeast; FS: fish meal + soybean meal. Capital letters indicate significant difference between diets in the anterior intestine and smaller letters represent difference in the posterior intestine by Duncan’s test(p < 0.0001).
Figure 3 – Amylase activity (U mg–1 prot) in intestine of jundiá after 30 (3A), 60 (3B) and 90 (3C) feeding days. Values showed as mean ± SEM (n = 3). *U= μmol substrate hydrolyzed per min per mg of protein. Diets: MBY: meat and bone meal + sugar cane yeast; SY: soybean meal + sugar cane yeast; S: soybean meal; MBS: meat and bone meal + soybean meal; FY: fish meal + sugar cane yeast; FS: fish meal + soybean meal. Capital letters indicate significant difference between diets in the anterior intestine and smaller letters represent difference in the posterior intestine by Duncan’s test (p < 0.0001).
0 200 400 600 800 1000 1200 1400 1600 1800
MBY SY S MBS FY FS
U
m
g
prot
–1
Diets
Anterior intestine Posterior intestine
90 days 2C
B
C
D A
B
A
a
c c
b b
a 0
200 400 600 800 1000 1200 1400 1600 1800
MBY SY S MBS FY FS
U mg
p
ro
t
–1
60 days 2B
B
C
D
A
B A
a
c c
b b
a
0 200 400 600 800 1000 1200 1400 1600 1800
MBY SY S MBS FY FS
U
m
g
prot
–1
30 days 2A
B B
C A
B
A
b c
d
a b
a
0 0.05 0.1 0.15 0.2 0.25 0.3 0.35 0.4
MBY SY S MBS FY FS
U
m
g
prot
–1
30 days 3A
B C
C
A B
A
c c
c a
b a
0 0.05 0.1 0.15 0.2 0.25 0.3 0.35 0.4
MBY SY S MBS FY FS
U
m
g
prot
–1
C
B B
A A
A
bcd d
bc a
cd b
60 days 3B
0 0.05 0.1 0.15 0.2 0.25 0.3 0.35 0.4
MBY SY S MBS FY FS
U
m
g
prot
–1
Diets
Anterior intestine Posterior intestine
90 days 3C
A
C D
BC C
B ab
d
bd cd
s t e i
D DSI HSI DTL IQ WG
--%
---- cm g
Y B
M 2.2±0.21a 0.8±0.12b 1 56. bc±1.5 0.8ab±0.0 76.6b±0.39
Y
S 2.4±0.13a 0.7±0.06b 13.6bc±1.4 0.7b±0.06 5 24. c±2.76
S 2.6±0.13a 0.9±0.04ab 1 03. c±0.96 0.7b±0.04 1 85. d±0.61
S B
M 2.4±0.13a 1.0±0.06a 2 20. a±1.27 0 9. a±0.07 9 55. a±3.65
Y
F 2.2±0.11a 0.9±0.05ab 1 37. ab±1.1 0 8. ab±0.05 75.3b±1.58
S
F 2.4±0.19a 0.8±0.12b 1 26. bc±1.4 0 8. ab±0.06 9 14. a±1.73 Table 4 – Digestive and growth parameters in jundiá juveniles fed diets with different protein sources.
Values are showed as mean ± standard error (n = 3). DSI: digestive somatic index; HSI: hepatosomatic index; DTL: digestive tract length; IQ: intestinal quotient; WG: weight gain. Diets: MBY: meat and bone meal + sugar cane yeast; SY: soybean meal + sugar cane yeast; S: soybean meal; MBS: meat and bone meal + soybean meal; FY: fish meal + sugar cane yeast; FS: fish meal + soybean meal. Means with different superscripts letters in the columns showed difference by Duncan test (p < 0.05).
Table 3 – Acid protease activity in stomach of jundiá juveniles fed diets with protein sources.
Values are showed as mean ± standard error (n = 3). Means with different superscripts letters in the columns showed difference by Duncan test (p < 0.0001). Diets: MBY: meat and bone meal + sugar cane yeast; SY: soybean meal + sugar cane yeast; S: soybean meal; MBS: meat and bone meal + soybean meal; FY: fish meal + sugar cane yeast; FS: fish meal + soybean meal.
t e i
D 30days 60days 90days
μ − − − − − − − − − − − − − − − − − − − −
− gtyr/min/mg/protein−−−−−−−−−−−−−−−−−−−−− Y
B
M 47.7c±1.5 74.9a±6.5 55.8a±2.5
Y
S 33.9d±0.8 64.8ab±2.5 49.9b±1.8
S 61.8b±2.7 45.5c±3.9 37.7c±2.1
S B
M 74.3a±2.2 58.5b±2.0 56.6a±1.6
Y
F 43.8c±1.7 54.4bc±0.9 31.5d±0.8
S
F 71.4a±3.1 74.2a±2.9 35.0cd±1.4
Discussion
Fish fed the SY and S diets had lower trypsin and chymotrypsin activities demonstrating the negative ef-fect of soybean meal in both intestine sections. Several authors actually show that higher dietary soybean meal levels result in lower trypsin activity and reduced growth rates in fish decrease (Oliva-Teles et al., 1994; Olli et al., 1994; Refstie et al., 1998; Krogdahl et al., 2003). Trypsin and chymotrypsin activities can be used for the prediction of dietary protein quality or the di-gestive ability of the organism, which may in turn lead to differences in growth rate (Sunde et al., 2004). The highest alkaline protease activities registered for fish fed diets with animal protein sources (mainly MBS and FS diets) may be explained by the quality of protein of these ingredients. In consequence, fish fed these diets had higher weight gains. Trypsin activity has been shown to influence growth rate in Atlantic cod (Lemieux et al., 1999) and Atlantic salmon (Sunde et al., 2004).
The digestive enzymes response can be also influ-enced by the feeding period, as changes in protein syn-thesis and enzyme activity in fishes can be observed af-ter a long feeding period (Krogdahl et al., 1994; Kaushik et al., 1995; López et al., 1999). Measuring the activity of digestive enzymes is not enough to determine the value
of a specific fish feed, as enzymes act in combination with feed composition, thus when associated with meta-bolic parameters they are a more reliable indicator of the fish nutritional status (Lundstedt et al., 2004). Usu-ally, fish use less carbohydrate, demanding higher pro-tein levels in the feeds (Kikuchi, 1999). However, sev-eral researchers showed the presence of carbohydrases, such as amylase, in many fish species (Ugwumba, 1993; Hidalgo et al., 1999; Alarcón et al., 2001; Lundstedt et al., 2004).
Fish species differ greatly in their ability to digest carbohydrates. Digestive functions capable of hydrolyz-ing a greater variety of carbohydrate-containhydrolyz-ing feedstuffs have been developed in herbivorous and om-nivorous fish, in contrast to carom-nivorous fish (De Almeida et al., 2006). Lower amylase levels may be in-dicative of the limited potential of fish to exploit diets containing high carbohydrate levels. In tambaqui (Colossoma macropomum), amylase secretion is higher in the posterior intestine (De Almeida et al., 2006). It was expected that enzymatic activities in the final intestine section of jundiá would show lower values for all the experimental diets because this section is responsible for the absorption of nutrients, electrolytes, and water (Tengjaroenkul et al., 2000).
(Table 2). In gilthead sea bream, amylase is affected by dietary fat level (Fountoulaki et al., 2005). In trout, amy-lase activity increases with higher consumption, tem-perature, and water salinity (Steffens, 1987). No varia-tion was observed in amylase activities, even in diets with lower protein and high carbohydrate levels, in fin-gerling Labeo rohita fed diets containing different pro-tein levels (25 up to 40% CP) (Debnath et al., 2007).
Acid protease is more abundant in the stomach of fishes, mainly in carnivorous species (Garcia-Carreño et al.,2002). However, high proteolytic potential is also reported in non-carnivorous fishes (Hidalgo et al., 1999; De Almeida et al., 2006). The protease observed in jundiás had great heterogeneity between diets (Table 3). No correlation was found between protease activ-ity and growth, since jundiá fed fish meal-based diets had lower protease activities and higher growth after 90 days.
The better growth rates observed in fish fed meat and bone meal (MBS) or fish meal and soybean meal-based (FS) diets is related to the good balance and availability of essential amino acids of these feedstuffs (Tacon, 1993). In spite of their omnivorous feeding habit, jundiá re-quires high amount of protein in the diet, similar to some carnivorous fish (Meyer and Fracalossi, 2004). The apparent digestibility coefficients of protein and energy of soybean meal for jundiá is 88.6 and 76.5%, respectively (Oliveira Filho and Fracalossi, 2006). Energetic feeds showed medium values of digestibility. Soybean meal-based diets showed negative growth response in jundiá (Table 4), probably asa result of processing of the ingre-dient and relation with fish consumption influencing growth results.
High HSI values are usually found in fish fed diets containing high carbohydrate levels (Debnath et al., 2007). When the protein level is lower, other nutrients may be used for energy production, resulting in higher glycogen in the hepatic tissue, with increased HSI. For sunshine bass juveniles an inverse relationship between HSI and diet protein level was observed (Brown et al., 1992). No significant correlation between HSI and fish weight was recorded. Higher HSI values were reported (1.8-2.0%) for African catfish (Clarias gariepinus) fed dif-ferent soybean meal levels (Fagbenro and Davies, 2001). Referential values herein recorded may be useful for further studies with jundiá. When juvenile jundiá were fed diets containing higher soybean meal levels (68%), intestine alkaline protease activity was greatly affected, that is, dietary soybean meal is a potent inhibitor of al-kaline proteases in jundiá and lead to reduced growth rates. O the other hand, jundiá shows digestive plastic-ity that can be modulated with diet.
Acknowledgements
To Coordenação de Aperfeiçoamento de Pessoal de Ensino Superior (CAPES), for providing a Master fellow-ship to R. Lazzari, and to Dr. David A. Stiles, from West-ern Kentucky University (USA), for language revision.
References
Alarcón, F.J.; Martinez, T.F.; Diaz, M.; Moyano, F.J. 2001. Characterization of digestive carbohydrase activity in the gilthead seabream (Sparus aurata). Hydrobiologica 445: 199-204. Barcellos, L.J.G.; Kreutz, L.C.; Quevedo, R.M.; Fioreze, I.; Cericato, L.; Soso, A.B.; Fagundes, M.; Conrad, J.; Baldissera, R.K.; Bruschi, A.; Ritter, F. 2004. Nursery rearing of jundiá, Rhamdia quelen (Quoy & Gaimard) in cages: cage type, stocking density and stress response to confinement. Aquaculture 232: 383-394. Bernfeld, P. 1955. Amylases a and b: colorimetric assay methods.
p. 149-158 In: Colowick, S.P.; Kaplan, N.O. Methods in enzimology. Academic Press, New York, NY, USA.
Brown, M.L.; Nematipour, G.R.; Gatlin III, D.M. 1992. Dietary protein requirement of juveniles sunshine bass at different salinities. Progressive Fish Culturist 54: 148-156.
Coldebella, I.J.; Radünz Neto, J. 2002. Soybean meal in the diets for South American Catfish (Rhamdia quelen) fingerlings. Ciência Rural 32: 499-503. (in Portuguese, with abstract in English). De Almeida, L.C.; Lundstedt, L.M.; Moraes, G. 2006. Digestive
enzyme responses of tambaqui (Colossoma macropomum) feed on different levels of protein and lipid. Aquaculture Nutrition 12: 443-450.
Debnath, D.; Pal, A.K.; Sahu, N.P.; Yengkokpam, S.; Baruah, K.; Choudhury, D.; Venkateshwarlu, G. 2007. Digestive enzymes and metabolic profile of Labeo rohita fingerlings fed diets with different crude protein levels. Comparative Biochemistry and Physiology 146B: 107-114.
Fagbenro, O.A.; Davies, S.J. 2001. Use of soybean flour (dehulled, solvent-extracted soybean) as a fish meal substitute in practical diets for African catfish, Clarias gariepinus (Burchell 1822): growth, feed utilization and digestibility. Journal of Applied Ichthiology 17: 64-69.
Fountoulaki, E.; Alexis, M.N.; Nengas, I.; Venou, B. 2005. Effect of diet composition on nutrient digestibility and digestive enzyme levels of gilthead sea bream (Sparus aurata L.). Aquaculture Research 36: 1243-1251.
Garcia-Carreño, F.L.; Albuquerque-Cavalcanti, C.; Navarrete Del Toro, M.A.; Zaniboni-Filho, E. 2002. Digestive proteinases of
Brycon orbignyanus (Characidae, Teleostei): characteristics and effects of protein quality. Comparative Biochemistry and Physiology 132B: 343-352.
Gomes, L.C.; Golombieski, J.I.; Chippari-Gomes, A.R.; Baldisserotto, B. 2000. Biology of jundiá Rhamdia quelen
(Teleostei, Pimelodidae). Ciência Rural 30: 179-185. (in Portuguese, with abstract in English).
Hidalgo, M.C.; Urea, E.; Sanz, A. 1999. Comparative study of digestive enzymes in fish with different nutritional habits. Proteolytic and amylase activities. Aquaculture 170: 267-283. Hummel, B.C.W. 1959. A modified spectrophotometric
determination of chymotrypsin, trypsin and thrombin.Canadian Journal of Biochemistry and Physiology 37: 1393-1399. Kaushik, S.J.; Cravedi, J.P.; Lalles, J.P.; Sumpter, J.; Fauconneau,
B.; Laroche, M. 1995. Partial or total replacement of fish meal by soybean protein on growth protein utilization, potential estrogenic or antigenic effects, cholesterolemia and flesh quality in rainbow trout, Oncorhynchus mykiss. Aquaculture 133: 257-274.
Kikuchi, K. 1999. Use of defatted soybean meal as a substitute for fish meal in diets of Japanese flounder (Paralichthys olivaceus). Aquaculture 179: 3-11.
Krogdahl, A.; Lea, T.B.; Olli, J.J. 1994. Soybean proteinase inhibitors affect intestinal trypsin activities and amino acid digestibilities in rainbow trout (Oncorhynchus mykiss). Comparative Biochemistry and Physiology 107: 215-219. Krogdahl, A.; Mckellep A.M.B.; Baeverfjord, G. 2003. Effects of
Kunitz, M. 1947. Chrystalline soybena trypsin inhibitor. II. General properties. Journal of General Physiology 30: 291-310. Kuz‘mina, V. 1990. Temperature influence on the total level of
proteolytic activity in the digestive tract of some species of freshwater fishes. Journal of Ichtiology 30: 97-109.
Kuz‘mina, V. 1996. Influence of age on digestive enzyme activity in some freshwater teleosts. Aquaculture 148: 25-37.
Lemieux, H.; Blier, P.; Dutil, J-D. 1999. Do digestive enzymes set a physiological limit on growth rate and food conversion efficiency in the Atlantic cod (Gadus morhua)? Fish Physiology and Biochemistry 20: 293-303.
López, M.F.J.; Martínez Díaz, I.; Díaz López, M.; Alarcón López, F.J. 1999. Inhibition of digestive proteases by vegetable meal in three fish species; seabream (Sparus aurata), tilapia (Oreochromis niloticus) and African sole (Solea senegalensis). Comparative Biochemistry and Physiology 122B: 327-332.
Lowry, O.H.; Rosebrough, N.J.; Farr, A.L.; Randall, R.J. 1951. Protein measurement with Folin-phenol reagent. Journal of Biological Chemistry 193: 265-275.
Lundstedt, L.M.; Melo, J.F.B.; Moraes, G. 2004. Digestive enzymes and metabolic profile of Pseudoplatystoma corruscans (Teleostei: Siluriformes) in response to diet composition. Comparative Biochemistry and Physiology 137B: 331-339.
Meyer, G.; Fracalossi, D.M. 2004. Protein requirement of jundiá fingerlings, Rhamdia quelen, at two dietary energy concentrations. Aquaculture 240: 331-343.
Oliva-Teles, A.; Gouveia, A.; Gomes, E.; Rema, P. 1994. The effect of different processing treatments on soybean meal utilization by rainbow trout, Oncorhynchus mykiss. Aquaculture 124: 343-349.
Oliveira-Filho, P.R.; Fracalossi, D.M. 2006. Apparent digestibility coefficients of feed ingredients for jundiá juveniles. Revista Brasileira de Zootecnia S35: 1581-1587 (in Portuguese, with abstract in English).
Olli, J.; Hjelmeland, K.; Krogdahl, A. 1994. Soybean trypsin inhibitors in diets for Atlantic salmon (Salmo salar L.): effects on nutrient digestibilities and trypsin in pyloric cecca homogenate and intestinal content. Comparative Biochemistry and Physiology 109: 923-928.
Papoutsoglou, E.S.; Lyndon, A.R. 2005. Effect of incubation temperature on carbohydrate digestion in important teleosts for aquaculture. Aquaculture Research 36: 1252-1264. Park, J.T.; Johnson, M.J. 1949. A submicro determination of
glucose. Journal of Biological Chemistry 181: 149-151.
Radünz Neto, J.; Kohler, C.C.; Lewis, W.M. 1987. Water re-use system of fingerling fishes in Brasil with emphasis on South American catfishes (Rhamdia quelen and R. sapo). Tropical Agriculture 64: 2-6.
Ray, A.K. 1988. On the digestive enzymes in three Indian freshwater perches in relation to food and feeding habits. Journal of the Fisheries Society Indonesian 20: 1-5.
Refstie, S.; Storebakken, T.; Roem, A.J. 1998. Feed consumption and conversion in Atlantic salmon (Salmo salar) fed diets with fish meal, extracted soybean meal or soybean meal with reduced content of oligosaccharides, trypsin inhibitors, lectins and soy antigens. Aquaculture 162: 301-312.
SAS Institute. 1997. Statistical Analysis System: User’s Guide; Version 6.08. 4. ed. SAS Institute,, North Caroline, NC, USA. 846 p.
Steffens, W. 1987. Principios Fundamentales de la Alimentación de los Peces. Acribia, Zaragoza, Spain. 275 p.
Sunde, J.; Eiane, S.A.; Rustad, A.; Jensen, H.B.; Opstvedt, J.; Nygard, E.; Venturini, G.; Rungruangsak-Torrissen, K. 2004. Effect of fish feed processing conditions on digestive protease activities, free amino acid pools, feed conversion efficiency and growth in Atlantic salmon (Salmo salar L.). Aquaculture Nutrition 10: 261-277.
Tacon, A.G.J. 1993. Feed Ingredients for Warm Water Fish: Fish Meal and Other Processed Feedstuffs. FAO, Rome, Italy., (FAO Fisheries Circular, 856).
Tengjaroenkul, B.; Smith, B.J.; Caceci, T.; Smith, S.A. 2000. Distribution of intestinal enzyme activities along the intestinal tract of cultured Nile tilapia, Oreochromis niloticus L. Aquaculture 182: 317-327.
Ugolev, A.M.; Kuz’mina, V.V. 1994. Fish enterocyte hydrolases. Nutrition adaptations. Comparative Biochemistry and Physiology 107A: 187-193.
Ugwumba, A.A.A. 1993. Carbohydrases in the digestive tract of the African bony-tongue Heterotis niloticus (Pisces: Osteoglossidae). Hydrobiologica 257: 95-100.
Uys, W.; Hecht, T. 1987. Assays on the digestive enzymes of Sharptooth Catfish, Clarias gariepinus (Pisces: Claridae). Aquaculture 63: 301-313.
Webster, C.D.; Tidwell, J.H.; Tiu, L.S. 1995. Use of soybean meal as partial or total substitute of fish meal in diets for blue catfish (Ictalurus furcatus). Aquatic Living Resources 8: 379-384.