Time course of changes in heart rate
and blood pressure variability in
streptozotocin-induced diabetic rats
treated with insulin
1Laboratório de Fisiologia Cardiovascular, Instituto de Biociências,
Universidade Federal do Rio Grande do Sul, Porto Alegre, RS, Brasil
2Serviços de Endocrinologia, Cardiologia e Engenharia Biomédica,
Hospital de Clínicas de Porto Alegre, Universidade Federal do Rio Grande do Sul, Porto Alegre, RS, Brasil
B.D. Schaan1,2, C.Y. Maeda1,
H.B. Timm1, S. Medeiros1,
R.S. Moraes2, E. Ferlin2,
T.G. Fernandes1, J.P. Ribeiro2,
H. Schmid2 and
M.C. Irigoyen1
Abstract
Autonomic neuropathy is a frequent complication of diabetes associ-ated with higher morbidity and mortality in symptomatic patients, possibly because it affects autonomic regulation of the sinus node, reducing heart rate (HR) variability which predisposes to fatal arrhyth-mias. We evaluated the time course of arterial pressure and HR and indirectly of autonomic function (by evaluation of mean arterial pressure (MAP) variability) in rats (164.5 ± 1.7 g) 7, 14, 30 and 120 days after streptozotocin (STZ) injection, treated with insulin, using measurements of arterial pressure, HR and MAP variability. HR variability was evaluated by the standard deviation of RR intervals (SDNN) and root mean square of successive difference of RR inter-vals (RMSSD). MAP variability was evaluated by the standard devia-tion of the mean of MAP and by 4 indices (P1, P2, P3 and MN) derived
from the three-dimensional return map constructed by plotting MAPn
x [(MAPn+1) - (MAPn)] x density. The indices represent the maximum
concentration of points (P1), the longitudinal axis (P2), and the
trans-versal axis (P3) and MN represents P1 x P2 x P3 x 10-3. STZ induced
increased urinary glucose in diabetic (D) rats compared to controls (C). Seven days after STZ, diabetes reduced resting HR from 380.6 ± 12.9 to 319.2 ± 19.8 bpm, increased HR variability, as demonstrated by increased SDNN, from 11.77 ± 1.67 to 19.87 ± 2.60 ms, did not change MAP, and reduced P1 from 61.0 ± 5.3 to 51.5 ± 1.8 arbitrary
units (AU), P2 from 41.3 ± 0.3 to 29.0 ± 1.8 AU, and MN from 171.1
± 30.2 to 77.2 ± 9.6 AU of MAP. These indices, as well as HR and MAP, were similar for D and C animals 14, 30 and 120 days after STZ. Seven-day rats showed a negative correlation of urinary glucose with resting HR (r = -0.76, P = 0.03) as well as with the MN index (r = -0.83, P = 0.01). We conclude that rats with short-term diabetes mellitus induced by STZ presented modified autonomic control of HR and MAP which was reversible. The metabolic control may influence these results, suggesting that insulin treatment and a better metabolic control in this model may modify arterial pressure, HR and MAP variability.
Correspondence
M.C. Irigoyen
Departamento de Fisiologia Instituto de Biociências, UFRGS Rua Sarmento Leite, 500 90050-170 Porto Alegre, RS Brasil
Presented at the XI Annual Meeting of the Federação de Sociedades de Biologia Experimental, Caxambu, MG, Brasil, August 21-24, 1996.
Research supported by CNPq, FIPE-HCPA, FAPERGS, and CAPES.
Received April 19, 1996 Accepted July 15, 1997
Key words
•Diabetes mellitus •Streptozotocin •Insulin
Autonomic neuropathy is a frequent com-plication of diabetes mellitus associated with higher morbidity and mortality in sympto-matic patients (1) which affects the auto-nomic modulation of the sinus node, reduc-ing heart rate (HR) variability (2). In addi-tion, these patients have a higher systolic blood pressure during 24-h monitoring (3). In the rat model, Monckton and Pehowich (4) described degenerative changes in auto-nomic neurons occurring from 3 days to 6 weeks after the injection of streptozotocin (STZ). Other studies have shown degenera-tive changes 5 to 15 months after the use of STZ (5-7). In our laboratory, we recently observed that STZ-induced diabetic rats with no insulin treatment presented lower mean arterial pressure (MAP) and HR than con-trols, as well as reduced intrinsic HR, vagal and sympathetic tone and sympathetic ef-fect, suggesting early autonomic dysfunc-tion due to diabetes (8). Little informadysfunc-tion is available on the time course of changes in autonomic control in STZ-induced diabetic rats treated with insulin.
The autonomic nervous system modulates beat-to-beat fluctuations in heart rate and blood pressure, playing an important role in cardio-vascular homeostasis. In the healthy state, heart rate variability is high at rest and reduced during adrenergic stimulation, while blood pressure variability is reduced at rest and in-creased during stressful situations. Autonomic modulation has been investigated by methods that quantify HR and MAP variability in terms of time and frequency (9). Recently, methods based on non-linear dynamics have been used with interesting results (10). In the present study, we evaluated the time course of MAP and HR and indirectly of autonomic function (by evaluation of MAP and HR variability) in STZ-induced diabetic rats treated with insulin. Experiments were performed on male Wistar rats from the Animal House of the Universidade Federal do Rio Grande do Sul, Porto Alegre, Brazil, weighing 164.5 ± 1.7 g and housed in small groups with free access to
tap water and standard rat food. Animals were made diabetic (D) by the injection of STZ (65 mg/kg, iv) (Sigma Chemical Co., St. Louis, MO) dissolved in citrate buffer, pH 4.5. Con-trols (C) were injected with citrate buffer alone. Rats were fasted overnight before STZ injec-tion. STZ-treated rats developed elevated plasma glucose values (confirmed by qualita-tive measurements of plasma glucose >300 mg% 48 h after the injection) and maintained high urinary glucose levels during the course of the studies. They received daily doses of neutral protamine Hagedorn (NPH) insulin (1 IU, subcutaneously) beginning 48 h after STZ injection. Metabolic control was evaluated by 24-h urinary glucose measurements and by weighing the animals monthly. Rats were grouped according to the time of evaluation after STZ injection, with 8, 14, 9 and 9 rats being evaluated at 7, 14, 30 and 120 days, respectively.
Catheters filled with saline were im-planted under ether anesthesia into the femo-ral artery and vein (PE-10) for direct meas-urement of arterial pressure (AP) and drug administration, respectively. One day after catheter placement, the arterial cannula was connected to a strain-gauge transducer (P23Db, Gould-Statham, Oxnard, CA) and blood pressure signals were recorded during a 40-min period with a microcomputer equipped with an analog-to-digital converter board (CODAS, 2-kHz sampling frequency, Dataq Instruments Inc., Akron, OH). Rats were conscious and moved freely during the experiments. Recorded data were analyzed on a beat-to-beat basis. To evaluate MAP variability, we used the standard deviation of the mean of MAP and also a modification of the method proposed by Moraes et al. (10). Three-dimensional return maps (3DRM) were built using as axis MAPn x
[(MAPn+1) - (MAPn)] x density. The
distribu-tion generated was evaluated in order to quantify different patterns of behavior. A set of normalized indices, P1, P2, and P3, was
maxi-mum concentration of points, P2 the
longitu-dinal axis, and P3 the transversal axis. P1 is
inversely proportional to the spread around the maximum concentration cross section, i.e., the mean slope at the most probable MAP. P2 is calculated from the maximum
longitudinal length of distribution and repre-sents the dynamic range of MAP variation. The maximum transversal range of variation represented by P3 is the highest beat-to-beat
MAP variation. The global behavior was measured by the MN index (MN = P1 x P2 x
P3 x 10-3). These indices are reported as
arbitrary units (AU) (10). HR variability was evaluated in the time domain by the follow-ing indices: 1) root mean square of succes-sive difference of RR intervals (RMSSD) and 2) standard deviation of the normal RR intervals (SDNN) (11).
Data are reported as mean ± SEM, and the Mann-Whitney U-test was used to com-pare values among groups. The relationship between metabolic control, measured by 24-h urinary glucose and t24-he degree of auto-nomic modulation, measured by the indices cited above, as well as the relationship be-tween standard deviation of MAP and the P2
index were evaluated by the Spearman rank correlation. Differences were considered to be significant at P<0.05 for all tests.
Urinary glucose levels measured after STZ injection were higher than after citrate buffer injection: 7181 ± 600 mg% at 7 days, 8507 ± 1732 mg% at 14 days, 5363 ± 1812 mg% at 30 days and 6697 ± 2573 mg% at 120 days in diabetic rats, and 25 ± 6 mg%, 14 ± 4 mg%, 13 ± 6 mg% and 7 ± 6 mg% in controls, at the same times, respectively. The weight of diabetic rats was always lower than that of the control group: 170.5 ± 7.4 g at 7 days, 176.8 ± 29.1 g at 14 days, 190.6 ± 13.5 g at 30 days and 318.0 ± 13.2 g at 120 days in diabetic rats, and 194.5 ± 19.1 g, 215.5 ± 12.4 g, 252.4 ± 14.2 g and 337.5 ± 30.9 g in control rats, at the same times, respectively.
Significant cardiovascular changes were found only in 7-day STZ rats, indicating that time-course changes were probably pre-vented by insulin administration since auto-nomic dysfunction demonstrated previously after 5-day STZ treatment (8) is also present after 15 and 30 days of untreated STZ diates (12). Although MAP did not differ be-tween control and STZ-diabetic rats through-out the experiment, MAP variability evalu-ated by 3DRM indices was reduced 7 days after STZ administration. P1, P2, and the
global index MN were significantly reduced in diabetic rats (Table 1). Two examples of
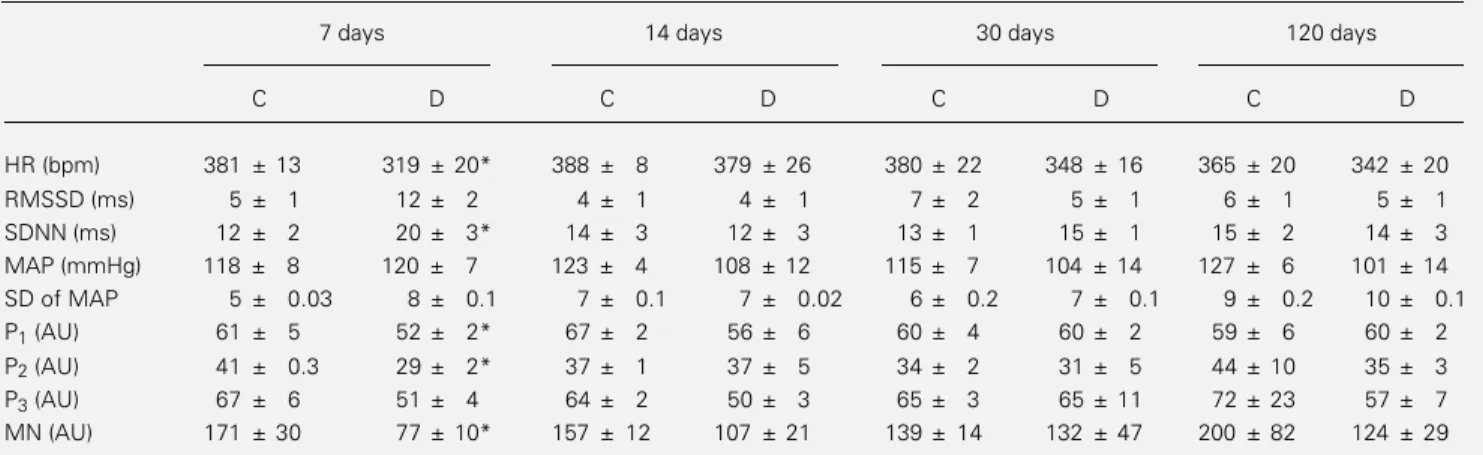
Table 1 - Cardiovascular characterization of diabetic (D) and control (C) rats 7, 14, 30 and 120 days after streptozotocin injection.
Data are reported as means ± SEM. *P≤0.05 vs control rats (Mann-Whitney U-test). HR = Heart rate; RMSSD = root mean square of successive difference of RR intervals; SDNN = standard deviation of the normal RR intervals; MAP = mean arterial pressure; SD = standard deviation; AU = arbitrary units.
7 days 14 days 30 days 120 days
C D C D C D C D
HR (bpm) 381 ± 13 319 ± 20* 388 ± 8 379 ± 26 380 ± 22 348 ± 16 365 ± 20 342 ± 20
RMSSD (ms) 5 ± 1 12 ± 2 4 ± 1 4 ± 1 7 ± 2 5 ± 1 6 ± 1 5 ± 1
SDNN (ms) 12 ± 2 20 ± 3* 14 ± 3 12 ± 3 13 ± 1 15 ± 1 15 ± 2 14 ± 3
MAP (mmHg) 118 ± 8 120 ± 7 123 ± 4 108 ± 12 115 ± 7 104 ± 14 127 ± 6 101 ± 14
SD of MAP 5 ± 0.03 8 ± 0.1 7 ± 0.1 7 ± 0.02 6 ± 0.2 7 ± 0.1 9 ± 0.2 10 ± 0.1
P1 (AU) 61 ± 5 52 ± 2* 67 ± 2 56 ± 6 60 ± 4 60 ± 2 59 ± 6 60 ± 2
P2 (AU) 41 ± 0.3 29 ± 2* 37 ± 1 37 ± 5 34 ± 2 31 ± 5 44 ± 10 35 ± 3
P3 (AU) 67 ± 6 51 ± 4 64 ± 2 50 ± 3 65 ± 3 65 ± 11 72 ± 23 57 ± 7
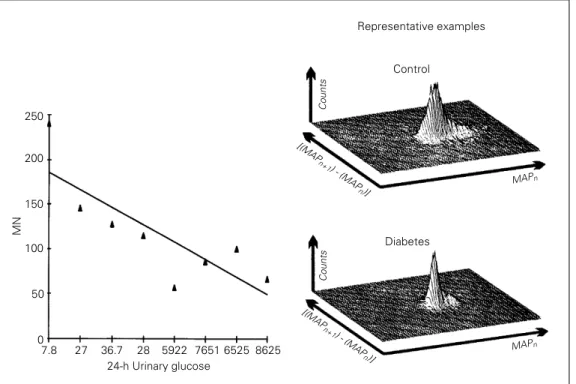
3DRM, one for a diabetic and the other for a control rat, are shown in Figure 1. The mean of the standard deviations of MAP was 8 ± 0.1 in diabetics and 5 ± 0.03 in controls (P<0.05) (Table 1). There was a positive correlation between the standard deviation of MAP and the P2 index obtained by the
3DRM (r = 0.94, P<0.002).
Seven-day diabetes significantly reduced resting HR from 381 ± 13 to 319 ± 20 bpm while these differences were not found 14, 30 and 120 days after induction of diabetes in rats treated with insulin (Table 1). HR variability, reported as SDNN, was increased in diabetic rats (20 ± 3 ms) compared to controls (12 ± 2 ms), although RMSSD did not change. There was a negative correlation between 24-h urinary glucose and resting HR (r = -0.76, P = 0.03), as well as between the former and MN index (r = -0.83, P = 0.01) (Figure 1). All indices described above were similar for STZ-treated rats at 14, 30 and 120 days, and controls (Table 1).
Several studies have demonstrated changes in AP as well as increased or de-creased baroreflex responses to changes in
MN
250
200
150
100
50
0
7.8 27 36.7 28 5922 7651 6525 8625 24-h Urinary glucose
Representative examples
Control
Diabetes
Counts
Counts
MAPn
MAPn
[(MAP
n+1
) - (MAP
n)] [(MAP
n+1
) - (MAP
n)] Figure 1 - Left panel,
Scatter-gram representing 24-h urinary glucose and the MN index of diabetic and control rats 7 days after streptozotocin. Right panel, A three-dimensional re-turn map of one control and one diabetic rat.
MAP variability, may be related to changes in autonomic function at this time. Lower resting HR has been attributed to a change in sinoatrial node as well as to functional changes in cardiac cholinergic mechanisms (8). Chang and Lund (13) also observed that insulin treatment restores normal cardiovas-cular and baroreflex function, at least when given during the early stages of diabetes (12-week experiment). In contrast, baroreflex sensitivity changes from hypersensitivity to a later state of hyposensitivity indicating that the reduced ability to regulate HR is attribut-able to an impairment of cardiac parasympa-thetic regulation (8,13). In a morphological study of the autonomic nervous system, Schmidt et al. (18) showed amelioration of neuroaxonal dystrophy by early treatment of diabetic rats with insulin, by pancreatic islet transplant or by administration of the aldose-reductase inhibitor sorbinyl, but not by di-etary administration of myo-inositol. How-ever, when these treatments were instituted later, after neuropathy was established, inhi-bition of progression was attained, but the parameters studied did not normalize (19).
These findings are in agreement with our results since the changes in resting HR per-sisted while MAP and HR variability im-proved at 7 days and returned to baseline values after this time, indicating that time-dependent changes of metabolic parameters due to hyperglycemia and insulinopenia, or decreases in cardiac adrenergic receptors (20) may be possible explanations for the opposite findings. The controversial data suggesting changes induced by diabetes may be attributed to differences in experimental and analytical approaches. The time after diabetes induction, age of the animal, diabetogen used and the use of insulin could modify the diabetic state obtained, changing the natural history of different complica-tions of experimental diabetes (14).
Since the neurotoxic effects of STZ could be expected during the first weeks after its
injection, with regenerative changes after 6 weeks (4), we cannot attribute any toxic effect of the drug to our results, because they indicate amelioration of autonomic function at 7 days of diabetes.
Indeed, changes in autonomic function at 7-day STZ diabetes did not persist, at least until 4 months of diabetes, since the evalua-tion at 14, 30 and 120 days after STZ injec-tion was similar for diabetic and control animals.
References
1. Sampson MJ, Wilson S, Karaggianis P, Edmonds ME & Watkins PJ (1990). Pro-gression of diabetic autonomic neuropa-thy over a decade in insulin dependent diabetics. Quarterly Journal of Medicine, 75: 635-646.
2. Murray A, Ewing DJ, Campbell IW, Neilson JMM & Clarke BF (1975). RR in-terval variations in young male diabetics.
British Heart Journal, 37: 882-885. 3. Rubler S, Chu DA & Bruzzone CL (1985).
Blood pressure and heart rate responses during 24-hour ambulatory monitoring and exercise in men with diabetes mellitus.
American Journal of Cardiology, 55: 801-806.
4. Monckton G & Pehowich E (1980). Auto-nomic neuropathy in the streptozotocin diabetic rat. Journal Canadien des Sci-ences Neurologiques, 7: 135-142. 5. Schmidt RE & Plurad SB (1986).
Ultra-structural and biochemical characteriza-tion of autonomic neuropathy in rats with chronic streptozotocin diabetes. Journal ofNeuropathology and Experimental Neu-rology, 45: 525-544.
6. Yagihashi S & Sima AAS (1985). Diabetic autonomic neuropathy in the BB rat: Ul-trastructural and morphometric changes in sympathetic nerves. Diabetes, 34: 558-564.
7. Yagihashi S & Sima AAS (1986). Diabetic autonomic neuropathy in the BB rat: Ul-trastructural and morphometric changes in parasympathetic nerves. Diabetes, 35: 733-743.
8. Maeda CY, Fernandes TG, Timm HB & Irigoyen MC (1995). Autonomic dysfunc-tion in short-term experimental diabetes.
Hypertension, 26 (Part 2): 1000-1004. 9. Parati G, Saul JP, Di Rienzo M & Mancia G
(1995). Spectral analysis of blood pres-sure and heart rate variability in evaluating cardiovascular regulation: A critical ap-praisal. Hypertension, 25: 1276-1286.
10. Moraes R, Ferlin E, Polanczik C, Wainstein M, Zaslawski L & Ribeiro J (1993). Three dimension return map: a method for quan-tification of heart rate variability. Journal ofthe American College of Cardiology, 21 (Suppl 2): 156 (Abstract).
11. Hayano J, Sakakibara Y, Yamada A, Yamada M, Mukai S, Fujinami T, Yokoyama K, Watanabe Y & Takata K (1991). Accuracy of assessment of car-diac vagal tone by heart rate variability in normal subjects. American Journal of Car-diology, 67: 199-204.
12. Dall’Ago P, Fernandes TG, Machado UF, Belló AA & Irigoyen MC (1997). Baroreflex and chemoreflex dysfunction in strepto-zotocin-diabetic rats. Brazilian Journal of Medical and Biological Research, 30: 119-124.
13. Chang KSK & Lund DD (1986). Alterations in the baroreceptor reflex control of heart rate in streptozotocin diabetic rats. Jour-nal of Molecular and Cellular Cardiology, 18: 617-624.
14. Jackson CV & Carrier GO (1983). Influ-ence of short-term experimental diabetes on blood pressure and heart rate in re-sponse to norepinephrine and angiotensin II in the conscious rat. Journal of Cardio-vascular Pharmacology, 5: 260-265. 15. Homma S, Yamazaki Y & Karakida T
(1993). Blood pressure and heart rate re-lationships during cervical sympathetic and vagus nerve stimulation in streptozo-tocin diabetic rats. Brain Research, 629: 342-344.
16. Nicholl TA, Lopaschuk GD & MacNeill JH (1991). Effects of free fatty acids and dichloroacetate on isolated working dia-betic rat heart. American Journal of Phys-iology, 261: H1053-H1059.
17. Maeda CY, Fernandes TG, Lulhier F & Irigoyen MC (1995). Streptozotocin diabe-tes modifies arterial pressure and baroreflex sensitivity in rats. Brazilian Journal of Medical and Biological Re-search, 28: 497-501.
18. Schmidt RE, Plurad SB, Sherman WR, Williamson JR & Tilton RG (1989). Effects of aldose-reductase on neuroaxonal dys-trophy and levels of myo-inositol and sor-bitol in sympathetic autonomic ganglia of streptozotocin-induced diabetic rats. Dia-betes, 38: 569-579.
19. Schmidt RE, Plurad SB, Coleman BD, Williamson JR & Tilton RG (1991). Effects of sorbinyl, dietary myo-inositol supple-mentation, and insulin on resolution of neuroaxonal dystrophy in mesenteric nerves of streptozotocin-induced diabetic rats. Diabetes, 40: 574-582.
20. Williams RS, Schaible TF, Scheur J & Kennedy R (1983). Effects of experimen-tal diabetes on adrenergic and cholinergic receptors of rat myocardium. Diabetes, 32: 881-886.
21. Junod A, Lambert AE, Stauffacher W & Renold AE (1969). Diabetogenic action of streptozotocin: relationship of dose to metabolic response. Journal of Clinical In-vestigation, 48: 2129-2139.