Bo ne m ine ral de nsity in Brazilian
m e n 5 0 ye ars and o lde r
1Departamento deReumatologia, Hospital Heliópolis, São Paulo, SP, Brasil 2Departamento de Epidemiologia, Faculdade de Saúde Pública,
Universidade de São Paulo, São Paulo, SP, Brasil C.A.F. Zerbini1,
M.R.O . Latorre2,
P.C. Jaime2,
T. Tanaka2 and
M.G.B. Pippa1
Abstract
Bone mineral density (BMD) in the lumbar spine (LSBMD), femoral neck (FNBMD) and whole body (WBBMD) and whole body tissue composition were evaluated in 288 Brazilian men 50 years and older, 80% white and 20% Mulattoes. Age was inversely correlated with WBBMD (r = -0.20) and FNBMD (r = -0.21) but not with LSBMD (r = 0.03). Body mass index and weight showed a strong positive correlation with WBBMD (r = 0.48 and 0.54), LSBMD (r = 0.37 and 0.45) and FNBMD (r = 0.42 and 0.48). Correlation with height was positive but weaker. No significant bone loss at the lumbar spine level was observed as the population aged. FNBMD and WBBMD de-creased significantly only in the last decade (age 70-79) studied. BMD was higher for Brazilian men as compared to Brazilian women at all sites. No significant differences were observed between Brazilian and the US/European male population for BMD in the femoral neck. BMD measured by dual-energy X-ray absorptiometry in South American men is reported here for the first time. A decrease in FNBMD was detected only later in life, with a pattern similar to that described for the US/European male population.
Co rre spo nde nce
C.A.F. Zerbini
R. João Moura, 647, Suite 64 05412-911 São Paulo, SP Brasil
Fax: + 55-11-852-4105 E-mail: criszerb@ uol.com.br
Publication supported by FAPESP.
Received April 24, 2000 Accepted September 13, 2000
Ke y wo rds
·Bone mineral density
·O steoporosis
·Epidemiology
Intro ductio n
Low bone mass is the most important predictor of fragility fracture. Other risk fac-tors such as low body weight and a positive maternal history of fracture may be predic-tive of fragility fracture but they are not as objectively quantifiable as bone mass meas-urements. Bone mineral density (BMD) has been measured with good precision for the purpose of identifying asymptomatic indi-viduals at risk for fracture but factors such as ethnic variability and environmental diver-sity preclude the use of a single reference data base (1). Bone measurements may vary among people of different racial background
measure-ments and also patterns of bone loss for each particular population in order to identify pathologic deviations and indicate therapeu-tic interventions.
The epidemiology of osteoporosis in South America is incomplete since it has been studied in only a few areas and only in women. Available data have been summa-rized by Mautalen and Pumarino (10). Al-though it has been established that bone mass for white women at the time of meno-pause in São Paulo (Brazil) is very similar to values for white women in the US (11) there are no bone mass measurement studies in the normal male population. This would not be a surprise since osteoporosis research has been focused on the group at highest risk of os-teoporotic fracture, i.e., white women. Only in recent years has it been recognized that fractures are common and osteoporosis in men is also a public health problem (12-14). A large study conducted in the US, the Third National Health and Nutrition Exami-nation Survey (NHANES III), estimated that 1-4% of men have osteoporosis and 15-33% have osteopenia based on World Health Or-ganization female cutoffs for BMD at the femoral neck level (15).
A later pattern of bone loss and also a lesser loss of cortical bone in healthy men as compared to healthy women have been well documented (16,17). The incidence of
frac-tures due to minimal-to-moderate trauma also occurs later in life in men (18,19).
The objective of this study was to obtain normal reference data for vertebral and proxi-mal femur bone density in men 50 years and older living in an area of southern Brazil and to observe the pattern of bone loss with age. Comparisons with female Brazilian and US/ European male populations were also made.
Patie nts and Me tho ds
We recruited 357 healthy male subjects 50 years and older, all residents of São Paulo city (southwestern Brazil) from among hus-bands whose wives were sent by their pri-mary care physicians for a bone densitom-etry and we also advertised in newspapers. This cross-sectional study was part of a larger study designed to determine the relationship between body composition and bone mass in older men. All subjects were submitted to a medical interview including a food and bev-erage intake questionnaire, smoking habits and medication use. Written informed con-sent was obtained from all subjects. We measured weight (kg) with a standardized balance-beam scale and height (m) with a stadiometer and calculated the body mass index (BMI) as the ratio of weight (kg) to height (m2).
BMD in the anteroposterior lumbar spine L2-L4, femoral neck and whole body and whole body soft tissue composition were measured with a Lunar dual-energy X-ray absorptiometer (DXA) (3.6z software; Lu-nar Corp., Madison, WI, USA). We report bone content in grams and BMD in g/cm2.
We excluded any subjects whose whole body was not fully visible within the scan region and those who had >40% body fat.
The coefficients of variation for DXA measures were 1.5% for lumbar spine and femoral neck BMDs and 0.6% for whole body BMD.
After application of the exclusion criteria the number of participants was reduced to
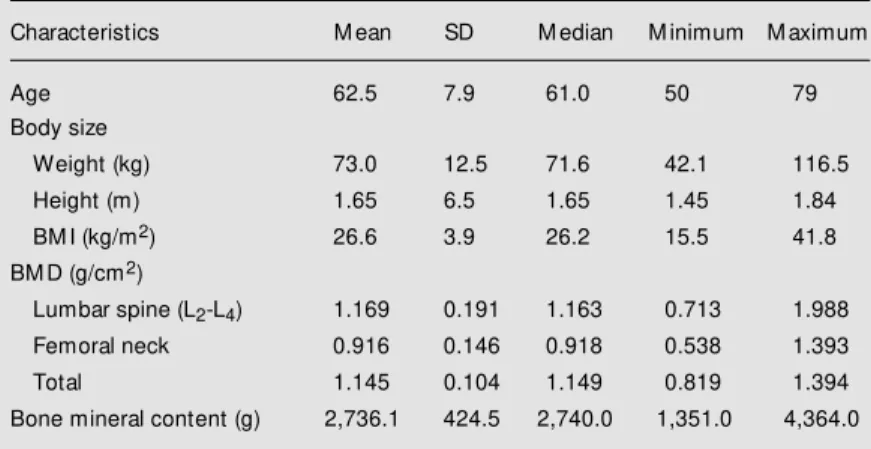
Table 1 - Body size and bone mineral density (BM D) of 288 healthy men, aged 50 years and more.
Characteristics M ean SD M edian M inimum M aximum
Age 62.5 7.9 61.0 50 79
Body size
Weight (kg) 73.0 12.5 71.6 42.1 116.5
Height (m) 1.65 6.5 1.65 1.45 1.84
BM I (kg/m2) 26.6 3.9 26.2 15.5 41.8
BM D (g/cm2)
Lumbar spine (L2-L4) 1.169 0.191 1.163 0.713 1.988
Femoral neck 0.916 0.146 0.918 0.538 1.393
Total 1.145 0.104 1.149 0.819 1.394
288 males, 79.86% of them white and 20.14% Mulatto. There were no Orientals in our sample.
Statistical analysis
The Kruskal-Wallis test was used to com-pare BMDs among different decades of life. Pearsons correlation coefficients were cal-culated to analyze the association between bone mass/bone density variables and body size measurements. The Student t-test was used to examine possible differences be-tween Brazilian and US/European male popu-lations for the measured variables and also between Brazilian female (11) and male populations. The effective P value for obser-vations to be considered statistically signifi-cant was 0.05. Data were analyzed using the SPSS statistical software system.
Re sults
The characteristics of the 288 men are shown in Table 1. Their mean age was 62.5 years, 79.86% were white and 20.14% were Mulattoes. Their mean BMI was 26.6 kg/m2,
mean weight 73 kg, and mean height 1.65 m. A correlation matrix is provided in Table 2, which indicated a negative association between BMD and age at all skeletal sites except the lumbar spine. These associations were significant for the femoral neck (P<0.001) and whole body (P = 0.001) but not for the spine. Height associations were weaker and less consistent. BMI and weight were significantly correlated with BMDs at all sites showing similar Pearsons coeffi-cients. When subjects were stratified by de-cade (Table 3) significant decrements in weight and height were observed only in the eighth decade (age 70-79). These decrements kept BMI unchanged with age.
Body size comparisons between Brazil-ian male and female (11) populations are shown in Table 4. Women had a significant increase in BMI with age due to decreasing
Table 4 - Comparison betw een Brazilian male (M ) and female (F)* populations for w eight, height and body mass index (BM I) stratified by decade.
Data w ere analyzed statistically by the Student t-test. * Brazilian female population from Ref. 11.
Age (years) N Weight (kg) Height (m) BM I (kg/m2)
50-59 M (122) 74.2 ± 13.4a 1.66 ± 0.1c 26.7 ± 4.2e
F (138) 64.0 ± 8.1b 1.58 ± 0.1d 25.5 ± 3.1f
60-69 M (106) 73.8 ± 11.3g 1.65 ± 0.1i 26.8 ± 3.7k
F (61) 63.4 ± 8.1h 1.55 ± 0.1j 26.4 ± 3.5l
70-79 M (60) 69.2 ± 12.0m 1.62 ± 0.1o 26.3 ± 4.1q
F (18) 64.1 ± 7.7n 1.54 ± 0.1p 27.0 ± 3.1r
Table 3 - Clinical and demographic characteristics of 288 healthy Brazilian men strati-fied by decade.
P<0.05 for a x c, b x c, d x f, and e x f (Kruskal-Wallis test w ith correction). BM I, Body mass index.
Age (years) N Weight (kg) Height (m) BM I (kg/m2)
50-59 122 74.2 ± 13.4a 1.66 ± 6.2d 26.7 ± 4.2g
60-69 106 73.8 ± 11.3b 1.65 ± 7.0e 26.8 ± 3.7h
70-79 60 69.2 ± 12.0c 1.62 ± 5.8f 26.3 ± 4.1i
Table 2 - Correlations betw een body size and bone mass variables (N = 288 men).
r = Pearson’s correlation coefficient; BM I = body mass index; WBBM C = w hole body bone mineral content; WBBM D = w hole body bone mineral density; LSBM D = lumbar spine bone mineral density; FNBM D = femoral neck bone mineral density.
Variables WBBM C WBBM D LSBM D FNBM D
Age (r) -0.19 -0.20 0.03 -0.21
P (0.001) (0.001) (0.631) (<0.001)
Weight (r) 0.72 0.54 0.45 0.48
P (<0.001) (<0.001) (<0.001) (<0.001)
Height (r) 0.57 0.26 0.25 0.24
P (<0.001) (<0.001) (<0.001) (<0.001)
BM I (r) 0.52 0.48 0.37 0.42
P (<0.001) (<0.001) (<0.001) (<0.001)
participate in a multicenter trial already pub-lished elsewhere (20).
No significant bone loss was observed at the lumbar spine level as the study popula-tion aged (Table 5). Artifacts such as osteo-phytes or extravertebral calcification, which are common in older men, may have influ-enced lumbar spine BMD results. Femoral neck and whole body BMDs did not change significantly between the sixth decade (age 50-59) and the seventh decade (age 60-69). When these two decades were compared with the last decade (age 70-79) BMD val-ues showed a significant decrease, disclos-ing a later pattern of bone loss in the mainly predominant cortical bone areas. Brazilian women had lower BMDs at all sites and also an earlier pattern of bone loss when com-pared to men (Table 6).
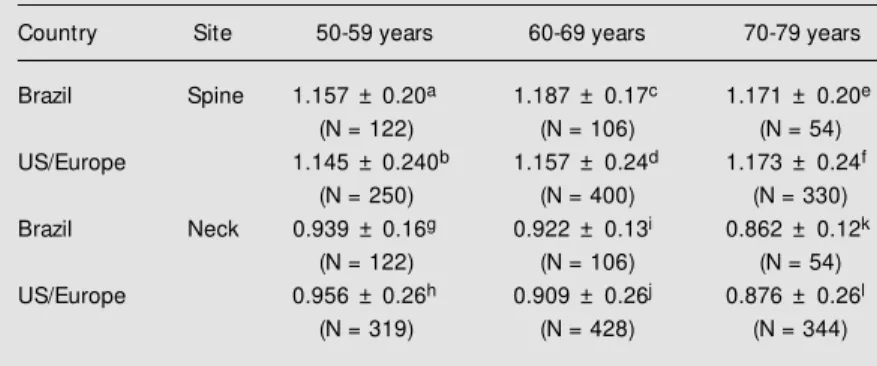
No significant differences were observed between Brazilian and US/European (21) older male populations for BMD at all skel-etal sites except for lumbar spine in the seventh decade (Table 7). Neither popula-tion showed a decrease in bone mass at the lumbar spine level with age. At the femoral neck level, bone density decreased linearly with age for all subjects.
D iscussio n
The present results show normative data for BMD and the pattern of bone loss for Brazilian men 50 years and older living in São Paulo city (southwestern Brazil).
Brazil is a large country with a wide variety of environmental conditions. The Brazilian male population shows ethnic mul-tiplicity and is characterized by an interra-cial mixing rarely seen in other countries. Taking into account these factors the data-base obtained in our study may not be repre-sentative of the entire Brazilian male popu-lation and therefore our normative data should be used only for a population sharing the same genetic potential and living under simi-lar environmental conditions. One limitation
Table 7 - Comparison of Brazilian and US/European* male populations for lumbar spine and femoral neck bone mineral densities (g/cm2) stratified by decade.
Data w ere analyzed statistically by the Student t-test. No statistical differences w ere detected betw een measurements except c x d (P = 0.02). * Lunar reference data from Ref. 21.
Country Site 50-59 years 60-69 years 70-79 years
Brazil Spine 1.157 ± 0.20a 1.187 ± 0.17c 1.171 ± 0.20e
(N = 122) (N = 106) (N = 54)
US/Europe 1.145 ± 0.240b 1.157 ± 0.24d 1.173 ± 0.24f
(N = 250) (N = 400) (N = 330)
Brazil Neck 0.939 ± 0.16g 0.922 ± 0.13i 0.862 ± 0.12k
(N = 122) (N = 106) (N = 54)
US/Europe 0.956 ± 0.26h 0.909 ± 0.26j 0.876 ± 0.26l
(N = 319) (N = 428) (N = 344)
Table 6 - Comparison of Brazilian male (M ) and female (F)* populations for lumbar spine and femoral neck bone mineral densities stratified by decade.
Data w ere analyzed statistically by the Student t-test. P<0.0001 for a x b, c x d, e x f, g x h, and i x j. P<0.0007 for k x l. * Brazilian female population from Ref. 11.
Age (years) N Spine (g/cm2) Femur (g/cm2)
50-59 M (122) 1.157 ± 0.20a 0.939 ± 0.16g
F (138) 1.010 ± 0.14b 0.830 ± 0.10h
60-69 M (106) 1.187 ± 0.17c 0.922 ± 0.13i
F (61) 0.940 ± 0.14d 0.770 ± 0.11j
70-79 M (60) 1.171 ± 0.20e 0.862 ± 0.12k
F (18) 0.950 ± 0.16f 0.750 ± 0.10l
Table 5 - M ean bone mineral density of lumbar spine, femoral neck and w hole body of 288 healthy Brazilian men 50 years and older.
P<0.05 for d x f, e x f, g x i, and h x i (Kruskal-Wallis test w ith correction).
Age (years) N Spine (g/cm2) Neck (g/cm2) Whole body (g/cm2)
50-59 122 1.157 ± 0.20a 0.939 ± 0.15d 1.160 ± 0.17g
60-69 106 1.187 ± 0.17b 0.922 ± 0.16e 1.149 ± 0.10h
70-79 60 1.171 ± 0.20c 0.862 ± 0.12f 1.114 ± 0.10i
of our study was the recruitment of volun-teers. The study sample was not population based but recruited from husbands whose wives were admitted for bone densitometry or through newspaper advertisements. It is possible that this may introduce a selection bias focusing on the wealthier and better educated part of the population or alterna-tively on those who through life style or living conditions are more prone to os-teoporosis.
To our knowledge, this is the first study of BMD in a large South American male population using DXA measurements. Be-fore our study Pumarino et al. (22) published BMD data for the normal male population of Santiago (Chile). Unfortunately, the deter-minations were performed with a different type of equipment (Norland 2000) using a gadolinium-153 source. The different cali-bration of the equipment and doubts involv-ing the analysis of values from different scales prevented a comparison. In the pre-sent study body size (weight and BMI) was strongly correlated with BMD at the spine, femoral neck and whole body levels. BMD decrements by age were observed at all skel-etal sites, except the spine. The lack of asso-ciation between spinal BMD and age has been observed in other studies in men using bone absorptiometry (22-25). This may re-flect degenerative changes of the spine due to spondylosis deformans or vascular calci-fications, although one study (26) demon-strated stability of L2-L4 BMD with age in men after radiographic exclusion of osteo-phytes. A recent study has used lumbar spine BMD successfully to correlate bone loss with vertebral body size in a small male population (27). Trabecular bone loss with aging has been evidenced by the technique of quantitative computed tomography (QCT) in the male spine (28,29). Probably the use of lateral QCT and DXA measurements may provide a more accurate assessment of spi-nal bone mass changes in men (30).
Significant weight loss was associated
with significant decrements in whole body and femoral neck BMDs in the eighth de-cade. Weight has been correlated with bone mass variations showing that heavier men have greater BMD and that weight loss is associated with bone loss with aging (31,32). Mazess et al. (26) found a low but also significant correlation of lumbar spine and femoral neck BMDs with body weight in males. It should be taken into account, how-ever, that BMD is influenced by skeletal size since it is not corrected for variations in the third dimension. Since body weight and skel-etal size are related this may explain some of the relations described. Longitudinal studies are needed to confirm our results.
Some controversy still remains over the continuation and pattern of bone loss in the very elderly population. Although some stud-ies suggest that cortical bone loss may cease in old age (33,34), our cross-sectional study suggests that cortical bone loss, which pre-dominates at femoral neck and whole body sites, may continue in old males. A cross-sectional study may have some limitations due to a possible cohort effect, but the same pattern of bone loss was also observed in the longitudinal Framingham Osteoporosis Study (35).
levels decreased significantly with age at all sites except the male spine and bone loss was significantly higher in women except for the ultradistal radius. Differences among cross-sectional studies may be elucidated in future prospective studies.
The similar values for BMD at the lum-bar spine and femoral neck level between Brazilian and US male populations allow the use of the same reference data for both. An exception was the lumbar spine BMD in the seventh decade (ages 60-69). This may be due to osteophytes or to an artifact effect as discussed earlier.
In the present study we cannot exclude cohort effects such as socioeconomic status, lifetime exercise patterns or nutritional hab-its. A survival bias may also have occurred since we made bone measurements only in
the individuals able to come to the outpatient clinic. It is possible that the total elderly male population may have lower BMD lev-els.
We have described BMD data for a pre-dominantly Caucasian healthy Brazilian male population 50 years and older. Our cross-sectional data indicate that BMD levels in cortical areas decline with age in men and this occurs later in life than for women. These observations suggest that interven-tions directed at preserving bone mass may be helpful in elderly men. Population screen-ing for osteoporosis in men may be consid-ered at the beginning of the eighth decade when there is a significant bone loss in the femoral neck, probably followed by a rapid increase in age-related fractures (37).
Re fe re nce s
1. DeSimone DP, Stevens J, Edw ards J, Shary J, Gordon L & Bell NH (1989). Influ-ence of body habitus and race on bone mineral density of the midradius, hip, and spine in aging w omen. Journal of Bone and M ineral Research, 4: 827-830.
2. Wasnich RD (1997). Epidemiology of os-teoporosis in the United States of Ame-rica. Osteoporosis International, 7 (Suppl 3): S68-S72.
3. Liu ZH, Zhao YL, Ding GZ & Zhou Y (1997). Epidemiology of primary osteoporosis in China. Ost eoporosis Int ernat ional, 7 (Suppl 3): S84-S87.
4. Row e SM , Jung ST & Lee JY (1997). Epi-demiology of osteoporosis in Korea. Os-teoporosis International, 7 (Suppl 3): S88-S90.
5. Reeve J & Silman A (1997). Epidemiology of osteoporotic fractures in Europe: to-w ard biological mechanisms. The Euro-pean Prospective Osteoporosis Study.
Osteoporosis International, 7 (Suppl 3): S78-S83.
6. Hashimoto T, Sakata K & Yoshimura N (1997). Epidemiology of osteoporosis in Japan. Ost eoporosis Int ernat ional, 7 (Suppl 3): S99-S102.
7. Farmer M E, White LR & Brody JA (1984). Race and sex differences in hip fracture incidence. American Journal of Public Health, 44: 1374-1380.
8. Luckey M M , M eier DE, M andeli JP, DaCosta M C, Hubbard M L & Goldsmith SL (1989). Radial and vertebral bone den-sity in w hite and black w omen: evidence for racial differences in pre-menopausal bone homeostasis. Journal of Clinical En-docrinology and M etabolism, 69: 762-770. 9. Yano K, Wasnich RD, Vogel JM & Heilbrun LK (1984). Bone mineral measurements among middle-aged and elderly Japanese residents in Haw aii. American Journal of Epidemiology, 119: 751-764.
10. M autalen C & Pumarino H (1997). Epide-miology of osteoporosis in South Ame-rica. Osteoporosis International, 7 (Suppl 3): S73-S77.
11. Szejnfeld VL, Atra E, Baracat EC, Aldright JM & Civitelli R (1995). Bone density in w hite Brazilian w omen: rapid loss at the time around the menopause. Calcified Tis-sue International, 56: 186-191.
12. Orw oll ES & Klein RF (1995). Osteoporo-sis in men. Endocrine Review s, 16: 87-116.
13. Ray NF, Chan JK, Thamer M & M elton LJ (1997). M edical expenditures for the treat-ment of osteoporotic features in the United States in 1995: report from the National Osteoporosis Foundation. Jour-nal of Bone and M ineral Research, 12:
24-35.
14. Seeman E (1995). The dilemma of
os-teoporosis in men. American Journal of M edicine, 98 (Suppl 2A): 76S-86S.
15. Looker AC, Orw oll ES, Johnston Jr CC, Lindsay RL, Wahner HW, Dunn WL, Calvo M S, Harris TB & Heyse SP (1997). Preva-lence of low femoral bone density in older US adults from NHANES III. Journal of Bone and M ineral Research, 12: 1761-1768.
16. Ruff CB & Hayes WC (1988). Sex differ-ences in age-related remodeling of the femur and tibia. Journal of Orthopaedic Research, 6: 886-896.
17. M osekilde L & M osekilde L (1990). Sex differences in age-related changes in ver-tebral body size, density and biochemical competence in normal individuals. Bone, 11: 67-73.
18. Donaldson LJ, Cook A & Thomson RG (1990). Incidence of fractures in a geo-graphically defined population. Journal of Epidemiology and Community Health, 44: 241-245.
19. Cooper C, Atkinson EJ, O’Fallon WM & M elton III LJ (1992). Incidence of clinically diagnosed vertebral fractures: a popula-tion-based study in Rochester, M inne-sota, 1985-1989. Journal of Bone and M ineral Research, 7: 221-227.
AJ & Stych B for the Fosamax Interna-tional Trial Study Group (1999). M ultina-tional, placebo-controlled, randomized trial of the effects of alendronate on bone mineral density and fracture risk in post-menopausal w omen w ith low bone mass: results of the FOSIT Study. Osteoporosis International, 9: 461-468.
21. Lunar reference data for normal US/Eu-rope male population (1999). In: Favus M J (Editor), Primer on the M etabolic Bone Diseases and Disorders of M ineral M e-tabolism. 4th edn. Lippincott, Philadel-phia, 483.
22. Pumarino H, Lillo R, Oviedo S & González P (1993). Densidad y contenido mineral óseo en hombres normales: medición por densitometría bifotónica. Revista M edica de Chile, 121: 1006-1011.
23. Orw oll ES, Oviatt SK, M cClung M R, Deftos LJ & Sexton G (1990). The rate of bone mineral loss in normal men and the effects of calcium and cholecalciferol sup-plementation. Annals of Internal M edi-cine, 112: 29-34.
24. M ann T, Oviatt SK, Wilson D, Nelson D & Orw oll ES (1992). Vertebral deformity in men. Journal of Bone and M ineral Re-search, 7: 1259-1265.
25. Bendavid EJ, Shan J & Barrett-Connor E (1996). Factors associated w ith bone min-eral density in middle-aged men. Journal of Bone and M ineral Research, 11: 1185-1190.
26. M azess RB, Barden HS, Drinka PJ, Bauw ens SF, Orw oll ES & Bell NH (1990). Influence of age and body w eight on spine and femur bone mineral density in US w hite men. Journal of Bone and M ineral Research, 5: 645-652.
27. Vega E, Ghiringhelli G, M autalen C, Valzacchi GR, Scaglia H & Zylberstein C (1998). Bone mineral density and bone size in men w ith primary osteoporosis and vertebral fractures. Calcified Tissue Inter-national, 62: 465-469.
28. M eier DE, Orw oll ES & Jones JM (1984). M arked disparity betw een trabecular and cortical bone loss w ith age in healthy men.
Annals of Internal M edicine, 101:
605-612.
29. Cann CE & Genant HK (1982). Cross-sec-tional studies of vertebral mineral using quantitative computed tomography. Jour-nal of Computer Assisted Tomography, 6: 216-217.
30. Finkelstein JS, Cleary RL, Butler JP, Antonelli R, M itlak BH, Deraska DJ, Zamora-Quezada JC & Neer RM (1994). A comparison of lateral versus anterior-pos-terior spine dual energy X-ray absorptio-metry for the diagnosis of osteopenia.
Journal of Clinical Endocrinology and M e-tabolism, 78: 724-730.
31. Nguyen TV, Eism an JA, Kelly PJ & Sambrook PN (1996). Risk factors for os-teoporotic fractures in elderly men. Ameri-can Journal of Epidemiology, 144:
258-261.
32. M ussolino M E, Looker AC, M adans JH, Langlois JÁ & Orw oll ES (1998). Risk fac-tors for hip fracture in w hite men: the NHANES I epidemiologic follow -up study.
Journal of Bone and M ineral Research, 13: 918-924.
33. Riggs BL, Wahner HW, Seeman E, Offord KP, Dunn WL, M azess RB, Johnson KA & M elton III LJ (1982). Changes in bone mineral density of the proximal femur and spine w ith aging: differences betw een the postmenopausal and senile osteoporosis syndromes. Journal of Clinical Investiga-tion, 70: 716-723.
34. M azess RB (1982). On aging bone loss.
Clinical Orthopaedics, 165: 239-252. 35. Hannan M T, Felson DT & Anderson JJ
(1992). Bone mineral density in elderly men and w omen: results from the Fram-ingham Osteoporosis Study. Journal of Bone and M ineral Research, 7: 547-553. 36. Blunt BA, Klauber M R, Barrett-Connor EL
& Edelstein SL (1994). Sex differences in bone mineral density in 1653 men and w omen in the sixth through tenth de-cades of life: The Rancho Bernardo Study.
Journal of Bone and M ineral Research, 9: 1333-1337.