Variability o f Ve rnie r acuity
me asure me nts in untraine d
subje cts o f diffe re nt age s
Departamento de O ftalmologia, O torrinolaringologia e Cabeça e Pescoço, Faculdade de Medicina de Ribeirão Preto, Universidade de São Paulo, Ribeirão Preto, SP, Brasil
C.M.M. Abbud and A.A.V. Cruz
Abstract
The Vernier acuity of 50 normal untrained subjects (20 males and 30 females) was measured by the method of adjustment. Subjects were divided into five age ranges with 10 subjects in each age group: 5-10, 11-20, 21-30, 31-40, and 41-50 years. All subjects had normal visual acuity (20/20) and volunteered to participate in the experiment. Chil-dren were selected from a local school and adults recruited from the technical staff of the Department of Ophthalmology of the School of Medicine. Vernier acuity was higher in adults compared to children. Intraindividual variability was high and it was estimated that for most individuals of all age groups a range of 100 to 700 trials was necessary to obtain a mean with a precision of 10%. These results suggest that Vernier acuity variability is an obstacle to its use in clinical settings. Co rre spo nde nce
A.A.V. Cruz
Departamento de O ftalmologia, O torrinolaringologia e
Cabeça e Pescoço Hospital das Clínicas, FMRP Av. Bandeirantes, 3900 14048-900 Ribeirão Preto, SP Brasil
E-mail: aavecruz@ fmrp.usp.br
Publication supported by FAPESP.
Received November 30, 2000 Accepted December 4, 2001
Ke y words
•Vernier acuity •Variability •Age
Intro ductio n
Vernier acuity is a peculiar type of visual task that involves the ability of the visual system to locate an object relative to another (1). This type of resolution, also called posi-tional acuity, is usually measured in seconds of arc as the smallest detectable misalign-ment between two abutting stimuli such as bars, lines or dots (2).
Like any other visual threshold, Vernier acuity can be measured with a variety of psychophysical methods, e.g., staircase or limits, constant stimuli and adjustment meth-ods (3). The method of adjustment has been successfully used for clinical testing of Ver-nier acuity, especially for untrained and older observers (2,4). Furthermore, this method
facilitates the rapid distinction between Ver-nier accuracy (mean offset error) and preci-sion (standard deviation) (4).
thresh-olds are well known.
The Vernier paradigm is not used fre-quently in ophthalmology. Few investiga-tions have been performed using Vernier acuity to test patients with eye diseases (17). The lack of clinical studies on Vernier acuity is probably related to the strong effect that practice has on the magnitude of the Vernier threshold (1,18,19). In clinical settings, time is a very important factor and extremely long psychophysical examinations are not fea-sible.
The objective of the present study was to investigate the number of Vernier trials nec-essary to obtain a mean value with a preci-sion of 10% in untrained subjects.
Mate rial and Me thods
All tests were performed in a darkened room with subjects located 10.73 m from a flat 17" computer monitor. Two vertical white lines, each 0.5 arc min wide and 5 arc min high, were generated using a microcomputer and presented one above the other on the monitor with a 1-min gap between them. The upper line was stationary in the center of the screen while the position of the bottom line could be moved horizontally using a track ball (method of adjustment).
Before testing began, a series of 10 prac-tice trials was run under binocular condi-tions. This short session, which typically lasted less than 5 min, was performed just to
familiarize the subject with the testing con-ditions and the nature of the measurement. All subjects understood the procedure after just one session. According to the literature, this short number of trials does not induce any training effect on the threshold magni-tude.
Data were collected under monocular viewing conditions (right eye). During mo-nocular testing, the subjects wore orthoptic eye patches (left eye). The test consisted of 10 trials for each subject which typically lasted about 5 min. The distance of the vari-able line from the fixed line was varied at random across trials. Subjects were instructed to move the bottom line so that it was exactly below the upper one. Once they were satis-fied that the lines were exactly aligned, the examiner pressed the enter key on the track ball and the computer measured the location of the bottom line in seconds of arc. The threshold was the arithmetic mean of the offset for the 10 trials. Due to limitations in room space and pixel size (0.26 mm), the smallest misalignment that could be meas-ured was 5 arc s.
We tested the Vernier acuity of 50 sub-jects divided into five age ranges with 10 subjects in each age group: 5-10, 11-20, 21-30, 31-40, and 41-50 years. The mean age of each group was 6.9, 14.9, 26.3, 35.7, and 44.8 years. All subjects had 20/20 visual acuity in each eye optically corrected when necessary with spectacles. All 500 measure-ments were performed using the right eye.
Re sults
The mean Vernier acuity in each age group for 10 trials is presented in Figure 1. One-way analysis of variance (ANOVA) in-dicated that there were significant differ-ences between mean thresholds (F = 5.96, P = 0.0001). Post hoc analysis by the Tukey
test showed that the mean Vernier offset was significantly higher for the younger age groups (5-10 and 11-20 years) and did not
V
e
rn
ie
r
a
c
u
it
y
(
m
e
a
n
o
ff
s
e
t,
a
rc
s
) 30
25
20
15
10
5
1 2 3 4 5
Age group Figure 1. Effect of age on
differ between the other groups. The 95% confidence interval of the mean Vernier value for each age group was: group 1 = 3.64, group 2 = 3.71, group 3 = 2.8, group 4 = 2.9, and group 5 = 3.12.
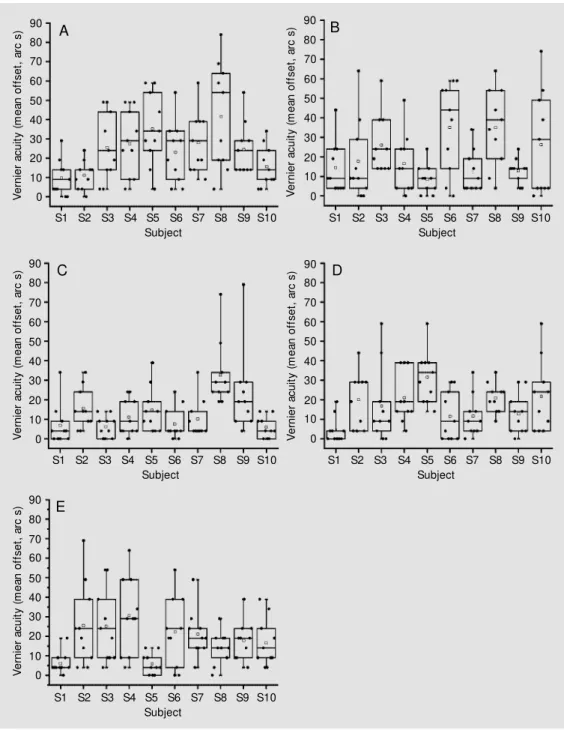
The distribution of the Vernier trials for each subject in each group is presented in Figure 2 where the coefficient of variation (standard deviation/mean) for each subject
ranged from 35.8 to 153.1%.
The number of trials necessary to obtain a mean Vernier value with a precision of 10% is presented in Figure 3 for all subjects. This number was obtained using the formula n = t2 . s2/(d2 . x2),where n is the sample size,
t is the value of the t distribution with n’ - 1 degrees of freedom and with 5% probability, n’ is the sample number of measurements, s2
Figure 2. Vernier acuity trials of individual subjects in differ-ent age groups. A, 5-10 years; B, 11-20 years; C, 21-30 years; D, 31-40 years, and E, 41-50 years. The horizontal lines in the box denote the 25th, 50th and 75th percentiles. The error bars denote the 5th and 95th per-centiles. The tw o symbols be-low the 5th percentile error bar denote the 0th and 1st percen-tiles. The tw o symbols above the 95th percentile error bar de-note the 99th and 100th per-centiles. The square symbol in the box denotes the mean of the column of data.
V e rn ie r a c u it y ( m e a n o ff s e t, a rc s ) 90 80 70 60 50 40 30 20 10 0 90 80 70 60 50 40 30 20 10 0 V e rn ie r a c u it y ( m e a n o ff s e t, a rc s ) V e rn ie r a c u it y ( m e a n o ff s e t, a rc s ) 90 80 70 60 50 40 30 20 10
0 Ve
rn ie r a c u it y ( m e a n o ff s e t, a rc s ) 90 80 70 60 50 40 30 20 10 0 V e rn ie r a c u it y ( m e a n o ff s e t, a rc s ) 90 80 70 60 50 40 30 20 10 0
S1 S2 S3 S4 S5 S6 S7 S8 S9 S10 Subject
S1 S2 S3 S4 S5 S6 S7 S8 S9 S10 Subject
S1 S2 S3 S4 S5 S6 S7 S8 S9 S10 Subject
S1 S2 S3 S4 S5 S6 S7 S8 S9 S10 Subject
S1 S2 S3 S4 S5 S6 S7 S8 S9 S10 Subject
A B
C D
is the variance of the sample measurements, x is the mean of the sample, and d is the desired precision (d = 0.1) (20).
One-way ANOVA showed that there were no differences in the mean number of trials calculated for the various age groups (1 = 230, 2 = 350, 3 = 461, 4 = 421 and 5 = 279; F = 1.91, P = 0.12).
D iscussio n
Since the original description of Vernier acuity in 1892 by Wülfling (7,11), there has been no agreement on the neural mechan-isms underlying this type of discrimination. Several types of neural processing have been proposed to account for the extremely low Vernier thresholds obtained under optimal conditions. Most investigators believe that a central process such as interpolation (2,21,22) is involved in the positional resolution. This feature plus the relative insensitivity of Ver-nier acuity to retinal image degradation (8) explain why Vernier acuity is such a
poten-tially useful test for the visual system. Theo-retically, high order disorders such as am-blyopia would be easily detected with a Ver-nier paradigm. However, the measurement of Vernier acuity has never been part of the clinical arsenal of visual testing.
The reasons for the resistance of clini-cians to use Vernier acuity are not clear. From a pure methodological perspective, the widespread availability of high resolution monitors and computers has eliminated most of the difficulties involved in the generation of Vernier stimuli. The adjustment method, as suggested by some (2,4), is totally appro-priate for clinical use. Our subjects under-stood the nature of the task and were easily tested. The track ball we have used allowed fine variation of the stimulus position and did not offer any difficulty for any subject. Lack of motor coordination was not ob-served in any patient.
We think that the variability of the posi-tional judgments explains why Vernier acu-ity is not routinely measured by ophthal-mologists. Our results show that for all age groups tested, the number of trials required to measure a mean Vernier threshold value with a confidence interval of 10% ranged from 100 to 700. The fact that this number did not differ with age agrees with previous results (4) and indicates that this feature is an intrinsic characteristic of the neural process involved in Vernier acuity. In fact, it is pos-sible that the cognitive ability of our age groups was not the same, with young adults and older subjects being more comfortable than children with a task that requires high levels of attention. Yet, the dispersion of the data was essentially the same for all age groups. An attentional process probably ex-plains why children have higher thresholds than adults, as suggested by some (23,24) and confirmed in the present study.
The variability of the Vernier acuity tri-als is certainly an obstacle to the clinical use of the procedure. It is important to note that in the vast majority of the psychophysical
Figure 3. Calculation of number of trials to provide a mean Vernier acuity w ith a 10% precision. This number ranged from 66 (subject #8 of group 4) to 1068 (subject #1 of group 3). Age groups: 1 = 5-10, 2 = 11-20, 3 = 21-30, 4 = 31-40, and 5 = 41-50 years.
N
u
m
b
e
r
o
f
tr
ia
ls
1400
1200
1000
800
600
400
200
0
1 2 3 4 5 6 7 8 9 10
Subject
Age group
1
2
4 3
studies on Vernier acuity the number of sub-jects tested was small and the time needed for training quite long. In their classical pa-per on the effect of training in Vernier acu-ity, McKee and Westheimer (1) used more
than 2000 responses for each subject. Since then training has become a mandatory pro-cedure for measuring Vernier acuity. Clini-cians simply cannot do that during routine examinations.
Re fe re nce s
1. M cKee SP & Westheimer G (1978). Im-provement in Vernier acuity w ith practice. Perception and Psychophysics, 24: 258-262.
2. Cox JF, Suh S & Leguire LE (1996). Ver-nier acuity in amblyopic and nonamblyopic children. Journal of Pediatric Ophthalmol-ogy and Strabismus, 33: 39-46.
3. Farrell B & Pelli DG (1999). Psychophysi-cal methods, or how to measure a thresh-old, and w hy. In: Carpenter RHS & Robson JG (Editors), Vision Research: A Practical Guide to Laboratory M ethods. Oxford Uni-versity Press, New York, NY, USA, 129-136.
4. Odom JV, Vasquez RJ, Schw artz TL & Linberg JV (1989). Adult Vernier thresh-olds do not increase w ith age; Vernier bias does. Investigative Ophthalmology and Visual Science, 30: 1004-1008. 5. Hirsch J & Curcio CA (1989). The spatial
resolution capacity of human foveal retina. Vision Research, 29: 1095-1101. 6. Curcio CA, Sloan KR, Kalina RE &
Hen-drickson AE(1990). Human photorecep-tor topography. Journal of Comparative Neurology, 292: 497-523.
7. Westheimer G (1975). Visual acuity and hyperacuity. Investigative Ophthalmology and Visual Science, 14: 570-572. 8. Williams RA, Enoch JM & Essock EA
(1984). The resistance of selected hypera-cuity configurations to retinal image deg-radation. Investigative Ophthalmology and Visual Science,25: 389-399.
9. Wilson HR (1986). Responses of spatial mechanisms can explain hyperacuity. Vi-sion Research, 26: 453-469.
10. Stigmar G (1971). Blurred visual stimuli: II. The effect of blurred visual stimuli on Ver-nier and stereo acuity. Acta Ophthalmolo-gica, 49: 364-379.
11. Westheimer G & M cKee SP (1977). Spa-tial configurations for visual hyperacuity. Vision Research, 17: 941-947.
12. Bradley A & Skottun BC (1987). Effects of contrast and spatial frequency on Vernier acuity. Vision Research, 27: 1817-1824. 13. Westheimer G & M cKee SP (1975). Visual
acuity in the presence of retinal-image motion. Journal of the Optical Society of America, 65: 847-850.
14. Whitaker D & M acVeigh D (1991). Interac-tion of spatial frequency and separaInterac-tion in Vernier acuity. Vision Research, 31: 1205-1212.
15. Westheimer G, Shimamura K & M cKee SP (1976). Interference w ith line-orienta-tion sensitivity. Journal of the Optical So-ciety of America, 66: 332-338.
16. Fahle M & Edelman S (1993). Long-term learning in Vernier acuity: effects of
stimu-lus orientation. Vision Research, 33: 397-412.
17. Essock EA, Williams RA, Enoch JM & Raphael S (1984). The effects of image degradation by cataract on Vernier acuity. Investigative Ophthalmology and Visual Science, 25: 1043-1050.
18. Levi DM , Polat U & Hu YS (1997). Im-provement in Vernier acuity in adults w ith amblyopia. Practice makes better. Investi-gative Ophthalmology and Visual Science, 38: 1493-1510.
19. Levi DM & Polat U (1996). Neural plastic-ity in adults w ith amblyopia. Proceedings of the National Academy of Sciences, USA, 93: 6830-6834.
20. Thompson SK (1992). Sampling. John Wiley & Sons Inc., New York, NY, USA. 21. Geisler WS (1984). Physical limits of
acu-ity and hyperacuacu-ity. Journal of the Optical Society of America (Part A), 1: 775-782. 22. Braddick O (1984). Visual hyperacuity.
Na-ture, 308: 228-229.
23. Carkeet A, Levi DM & M anny RE (1997). Development of Vernier acuity in child-hood. Optometry and Vision Science, 74: 741-750.