Hydrochemistry of Cachoeira River (Bahia State, Brazil)
Hidroquímica do Rio Cachoeira (Bahia, Brasil)
Maria Zita Tabosa Pinheiro de Queiroz Lima Lucio, Simone Setúbal dos Santos and Daniela Mariano Lopes da Silva
Departamento de Ciências Biológicas, Universidade Estadual de Santa Cruz – UESC, Rod. Ilhéus/Itabuna, Km 16, Bairro Salobrinho, CEP 45650-000, Ilhéus, BA, Brazil
e-mail: [email protected]; [email protected]; [email protected]
Abstract:Aim: The aim of this study is to evaluate the spatial-temporal changes of chemical elements in the surface waters of the Cachoeira River in order to evaluate the impacts of anthropogenic activities in water quality; Methods: Samples were collected monthly between August 2008 and August 2009 at six collection points along the river. The abiotic parameters dissolved oxygen, pH, electrical conductivity and temperature were performed in the field using portable digital meters; concentration of ions nitrite (NO2–), nitrate (NO
3
–), ammonia (NH 4
+), phosphate (PO 4
–), sodium (Na+), calcium (Ca+2), potassium (K+), chloride (Cl–), magnesium (Mg+2), sulfate (SO
4–2) were determined by ion chromatography and bicarbonate (HCO3–) was calculated by a model of ionic associations originated from alkalinity values; Results: The spatial variations showed that anthropogenic activities and land use changes (cocoa crops and pasture) appear to be the major factors influencing the distribution of nutrients in the Cachoeira River; however, lithology seems to be the factor influencing the major ions; Conclusions: Variations in ion concentrations were directly related to drought and rainy periods, the geological formation, and the various land uses. The lack of treatment of domestic wastes and their incorrect disposal in water bodies has significantly contributed to the aggravation of environmental problems and consequently the health of the population.
Keywords: watershed, hydrogeochemical, Cachoeira River.
Resumo:Objetivo: O objetivo do presente estudo foi avaliar as variações espaço temporais da química das águas superficiais do Rio Cachoeira a fim de estabelecer os impactos das atividades antropogênicas na qualidade da água; Métodos: As coletas foram realizadas mensalmente entre agosto de 2008 e agosto de 2009 em seis pontos de coleta ao longo do rio. Os parâmetros abióticos oxigênio dissolvido, pH, condutividade elétrica e temperatura foram determinados através de medidores portáteis no campo; a concentração dos íons nitrito (NO2–), nitrato (NO3–), amônia (NH4+), fosfato (PO4–), sódio (Na+), cálcio (Ca+2), potássio (K+), cloreto (Cl–), magnésio (Mg+2), sulfato (SO
4
–2) através da cromatografia iônica e o bicarbonato (HCO3–) através da alcalinidade; Resultados: Os resultados referentes a variação espacial no Rio Cachoeira demonstraram que as atividades antropogênicas e os diferentes cultivos ao longo da bacia (cultivo de cacau e pastagem) são os principais fatores que influenciam na distribuição dos nutrientes (N e P). No entanto, a litologia parece ser o principal responsável pelas concentrações dos íons maiores, não havendo diferenças entre os pontos de coleta; Conclusões: As variações das concentrações dos íons foram diretamente relacionadas aos períodos mais secos e mais chuvosos, a formação geológica e aos diversos usos da terra. A ausência do tratamento de resíduos domésticos e seu despejo impróprio nos corpos de água têm contribuído para o agravamento dos problemas ambientais e consequentemente à saúde da população.
Palavras-chave: bacia hidrográfica, hidrogeoquímica, Rio Cachoeira.
1. Introduction
Anthropogenic influences and land use changes in watersheds such as urbanization, agricultural farmland and pasture for livestock promote changes in the water chemistry of rivers (Biggs et al., 2002). These alterations include the input of salts and
nutrients that are released in the drainage basins according to land use or directly discharged into rivers (Martinelli et al., 1999a; Daniel et al., 2002).
Acta Limnologica Brasiliensia
and Colônia Rivers, and it flows through three municipalities, Itapé, Itabuna and Ilhéus.
From the geotectonic point of view, the basin is included inthe southeast edge of the São Francisco Craton, cratonic land unit formed by the end of the Trans-Amazonian Cycle (2.1 - 1.9 billion years).The territory is composed of– in the west-east direction –the Itabuna Belt (Archaean/Inferior Proterozoic), from the Jequié block (West) to the Atlantic Ocean (East) (CPRM, 1997). All the features found in the study area are located in the Coaraci-Itabuna region. The Itabuna Belt consists of rocks pertaining to: the Paraíso River Intrusive Suite, which consists of granite and monzonite; the Intrusive Suite of Itabuna, which primarily consists of syenite; rocks of São José Complex, where tonalite is predominant; and the Ibicaraí - Buerarema Complex and Japu River Unit , composed of gneissic rocks (Dana and Franco, 1976).Tertiary sediments of Grupo Barreiras are predominant in the extreme southeast region of the basin – close to the coast.Mangrove and coastal sands are present in the mouth of the Cachoeira River (Quaternary) (Barbosa and Dominguez, 1996).
Relief is the main determinant of rainfall variations. The gradual elevation of the ground in an east-west direction constitutes an orographic barrier that,in relation to the unit, stimulates the development of various climate zones (Nacif et al., 2003).
According to the classification of Köeppen, it is possible to distinguish three climatic areas along the basin:a hot and humid tractnear the coast (Af weather), with precipitation exceeding 2000 mm annually and distributed throughout the year, while the average annual temperature is 23.3 °C; a transition range (Am climate), characterized by the occurrence of the dry season in August and September, compensated by high rainfall totals and the average annual temperature of 22.7 °C; finally, a typical range of semi-tropical humid climate (Aw climate), with annual rainfall of 800 mm and average annual temperature of 23.6 °C (Schiavetti et al., 2005). The annual relative humidity of the basin decreases from the Atlantic Ocean towards the interior of the continent. The cities near the coastal strip have humidity above 85%, falling to 84.2% in the age of transition, and reaching 76.3% in the inland (Bahia, 1995).
2.2. Field methodology
Samples were collected monthly at 6 sites along the Cachoeira River according to land use and such as climate (temperature, humidity, wind,
precipitation), rock types, vegetation, groundwater contribution, rainwater, and flow rate variations (Fritzsons et al., 2003).
Rock weatheringin the watershed allows understanding the chemical weathering in the drainage basin because differencesinthe parent rocks increase the cations and anions dissolved inthe solution.
As water can drain different types of soils and chemical compositions resulting from the local geology, there are complex chemical interactions peculiar to each watershed. The changes provoked by human activities also contribute to chemical changes in natural waters: removal of vegetation, different soil treatments, industrial and agricultural dumping (Tundisi and Matsumura-Tundisi, 2008).
Due to deforestation, the bare soil is exposed to surface and deep leaching; such processes result in soil depletion, whereas the soil resources are moved to lower areas, usually concentrated inrivers and lakes, - thus virtually causing an increased use of fertilizers and imbalancingthe content of nutrients in the soil and exposing it to chemical contamination (Chapman et al., 2000).
The use of organic fertilizers and minerals in agricultural systems can result in an excess of important nutrients in the soil, which can reach streams and rivers by means of processes such as leaching, runoff and soil erosion (Corriveau et al., 2009).
Thus, the objective of this study is to evaluate the spatial-temporal changes of chemical elements in the surface waters of the Cachoeira River in order to evaluate the impacts ofanthropogenic activities in water quality. It is expected a decrease in water quality with theincrease of human alterations.
2. Material and Methods
2.1. Study area
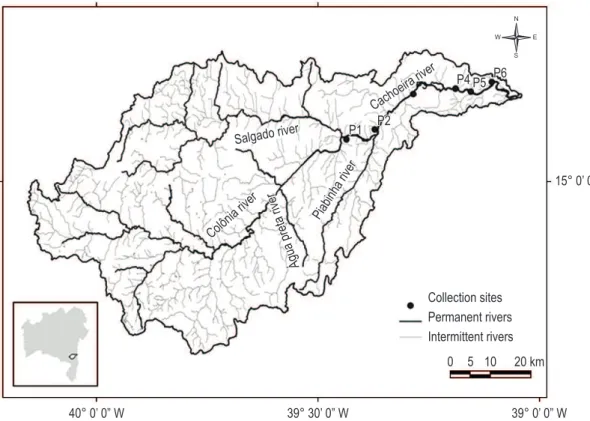
The samples were collected in the middle of the river upstream to downstream. One sample per sitewas collected directly in the middle of the river in P1, P2, P4, P5 and P6 in high-density polyethylene bottles previously washed with 1:1 HCl and distilled accessibility (Figure 1 and 2, Table 1 and 2) between
August 2008 and August 2009. Due to the high level of the river waters in September and November, no access was allowed to the sampled points, hence preventing the completion of collections.
Figure 1. Hydrographic map of the Cachoeira River Basin and location of the collection sites.
Acta Limnologica Brasiliensia
(p < 0.05) was employed. The analysis of variance (Kruskal Wallis) was used to assess the possible significant differences between the variables and the collection points, and also among the sampling months, followed by the posteriori Tukey HSD test. A Principal Component Analysis (PCA) was performed from correlation matrices to ordinate the samples collected along the Cachoeira River in the dry (August and October/2008, February, March and June/2009) and rainy (December/2008, January, April, May, July and August/2009) seasons (software PAST 1.91).
3. Results
The results observed in this study showed that Cachoeira river water quality varies according human influence and river flow. The conductivity values did not vary throughout the collection sites, and the higher values were found in P6 with means of 759.0 ± 1246.7 µS.cm–1 (Table 3).
The higher temperature, pH and dissolved oxygen values were observed in P1. The lowest pH values were observed at point 5 (6.4 ± 0.5), whosevalues were close to neutral showing significant differences with P1 (KW-H = 13,3; p = 0.02).
Dissolved oxygen concentrations were lower in P3 and P4 compared to P1 and P2 (KW-H = 25,4; p = 0.0001), with values of 4.1 ± 2.3 and 4.8 ± 1.4 mg.L–1 and saturation percentages of
51.5 ± 29.7 and 60.2 ± 20.8%, respectively. Dissolved inorganic nitrogen (NO2–, NO
3 –,
NH4+) and phosphorus (PO 4
–) concentrations
showed statistical differences for nitrite (NO2–),
water, and kept in a Styrofoam cooler with ice during transport to the laboratory. In P4 the samples were collected with a cord and a bucket over a high bridge.Samples were filtered using 47 mm glass fiber filters, type GF/F (0.7 µm) previously calcined at 450 °C for subsequent analysis of the filtered sample (dissolved). The temperature, conductivity, pH and dissolved oxygen measurements were performed in the field using portable digital meters (pH/Cond 3401 WTW). The material for analysis of alkalinity was collected separately in syringes previously poisoned with mercury chloride (HgCl2)
2.3. Analytical procedures
The concentrations of cations and anions (Ca+2,
Mg+2, K+, Na+, Cl–, NH
4+, NO2–, NO3–, PO4–,
SO4–2) were determined by ion chromatography
using DIONEX ICS 1000 in filtered samples. Alkalinity was determined by titration with 0.01N HCl potentiometric tritration using a simplified Gran´s function (Carmouze, 1994). The concentration of bicarbonate (HCO3–) was
calculated by a model of ionic associations using phosphorus, silicate, temperature, alkalinity and pH with the aid of the software CO2SYS.EXE(Lewis and Wallace, 1998)with the dissociation constants K1 and K2 from Merhbach et al. (1973).
Silicate was analyzed using the method described by Carmouze (1994), which consists of a reduction in the Silicomolybdic complex by ascorbic acid.
2.4. Statistical analysis
The parametric test ANOVA was used for all the variables and a significance level of 5%
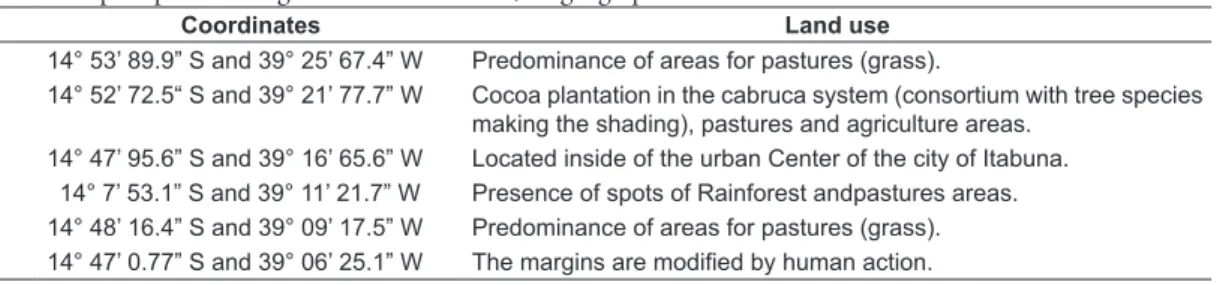
Table 1. Sampled points along the Cachoeira River, its geographical coordinates and land use.
Coordinates Land use
P1 14° 53’ 89.9” S and 39° 25’ 67.4” W Predominance of areas for pastures (grass).
P2 14° 52’ 72.5“ S and 39° 21’ 77.7” W Cocoa plantation in the cabruca system (consortium with tree species making the shading), pastures and agriculture areas.
P3 14° 47’ 95.6” S and 39° 16’ 65.6” W Located inside of the urban Center of the city of Itabuna. P4 14° 7’ 53.1” S and 39° 11’ 21.7” W Presence of spots of Rainforest andpastures areas. P5 14° 48’ 16.4” S and 39° 09’ 17.5” W Predominance of areas for pastures (grass). P6 14° 47’ 0.77” S and 39° 06’ 25.1” W The margins are modified by human action.
Table 2. Study area description.
Sites Localization (cities) Land use Lat/long
P1 Itapé Urbanization/Pasture 14° 53’ 89,0” S and 39° 25’ 67,4” W
P2 Itabuna Pasture/Secondary Forest 14° 52’ 72,5” S and 39° 21’ 77,7” W
P3 Itabuna Urbanization 14° 47’ 95,6” S and 39° 16’ 65,6” W
P4 Ilhéus Dense forest/Cocoa crop 14° 47’ 53,1” S and 39° 11’ 21,7” W
P5 Ilhéus Dense forest/Cocoa crop 14° 48’ 16,4” S and 39° 09’ 17,5” W
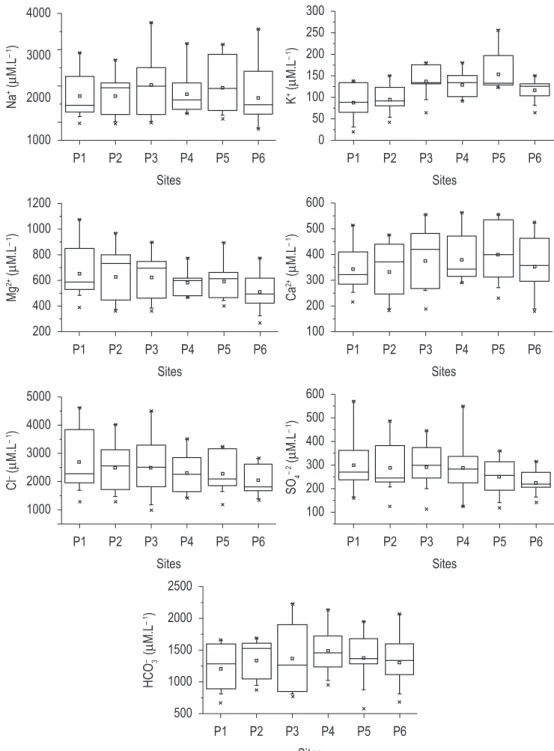
Calcium (Ca+2) showed no variation between the
collection points. The values of this ion ranged from 332.3 ± 114.0 to 398.7 ± 131.0 µM.L–1. Bicarbonate
(HCO3–) had an increase in concentrations
between the points 1 and 4 with values between 1198.7 ± 375.0 and 1485.2 ± 376.6 µM.L–1,
respectively. Despite human influence mainly in P3 and P4, no differences were observed in major ion concentrations.
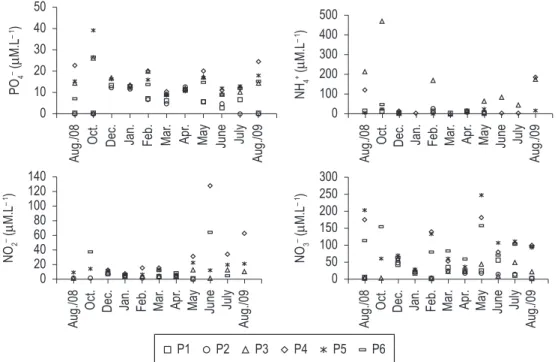
The highest PO4– and NH
4+ concentrations
occurred in October and August/08, with values of 39.1 and 22.9 µM.L–1 for –PO
4 and 470.4 and
215.9 µM.L–1 for NH 4
+, respectively (Figure 6).
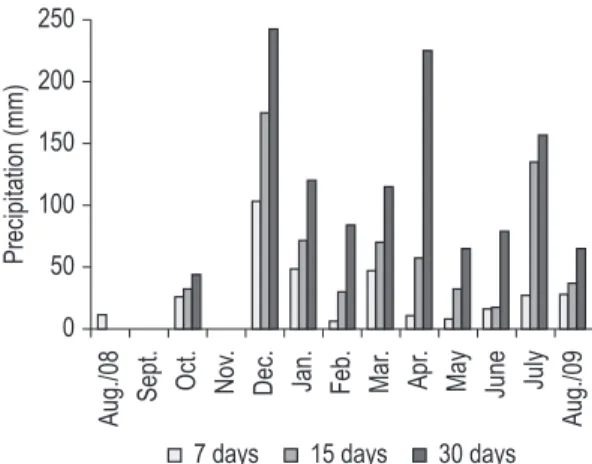
These values coincide with the months of lowest rainfall - October and August/08 – in which precipitation was 34.4 mm and 74.0 mm, respectively (Figure 3). Same trend was found to nitrate that presents the highest values in driest months (May, August and October/08) and after the last month, there was a striking decrease in the ion concentrations. Nitrite presents a slight increase in concentration between June and August/09; thus, the highest value in all the sampling period was found in June.
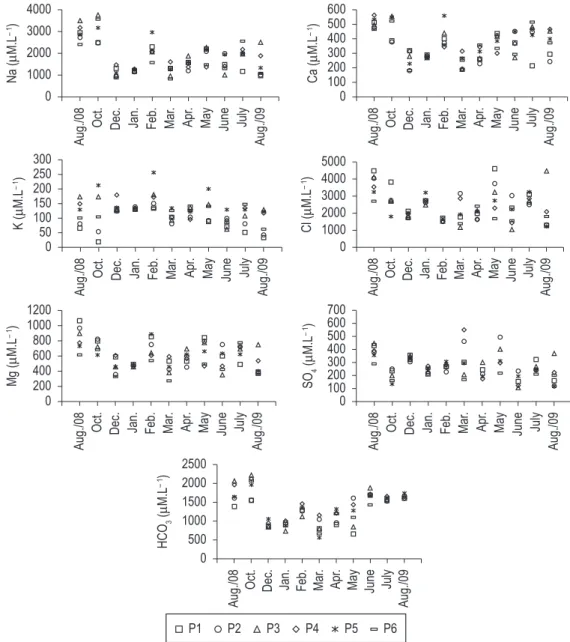
In relation to the temporal variation of the other ions, August and October/2008 had the highest concentrations of then all ; some of these ions were Ca+2, Na+, Mg+2, Cl– and HCO
3–. These months
also had the lowest rainfall: 74.0 mm in August and 34.4 mm in October. A slight increase in the concentration of these ions and K+ in February was
also verified, except for Cl– (Figure 7).
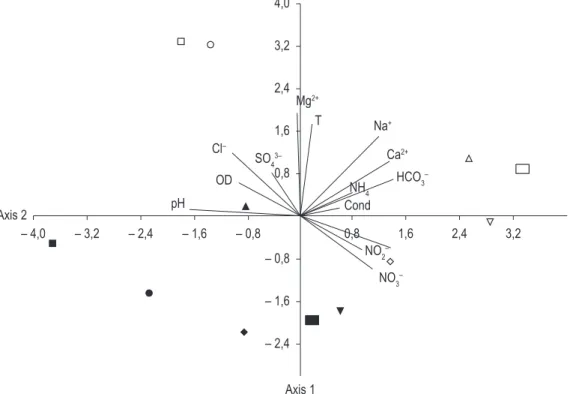
The principal component analysis shows that the first axis was directly correlated with electrical conductivity, NO2–, NO
3–, HCO3– and Ca2+ and
inversely correlated with pH, OD and Cl– (36.34%
of total variance), whereas the secondary axis was directly correlated with Mg and temperature (24.97% of total variance).
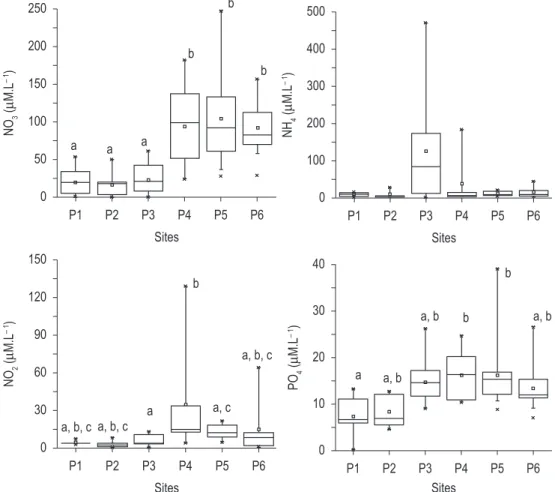
The PCA allowed distinguishing dry and rainy periods of the Cachoeira River. Samples collected in the rainy season were positively correlated with both in which different values were found among P2,
P3 and P4(KW-H = 21,9; p = 0.0005), for nitrate (NO3–), in which two groups were observed - the
first consisting of P1, P2 and P3 that were not statistically different from each other, and the second consisting of P4, P5 and P6 (KW-H = 39,6; p = 0,00001), in which no differences were found among points; in addition, PO4– showed
difference between point P1 and points P4 and P5 (KW-H = 19,1; p = 0,002) (Figure 4).
It was not observed spatial variation of major ions (p > 0.05), chloride (Cl–), sulfate (SO4–2)
and magnesium (Mg+2); however, a decrease can
be observed throughoutthe river from upstream to downstream. The highest values for these ions were found in P1, near the formation of the Cachoeira River, and the lowest values were found in point 6 (Figure 5).
The ions sodium (Na+) and potassium (K+)
presented variations between the sampled points, while an increase was verified in concentrations between P1 and P3. The Na+ values in these
points ranged from 1719.3 ± 647.0 to 2029.2 ± 959.6 µM.L–1, while the K+ values ranged
from 87.7 ± 41.2 to 134.9 ± 39.4 µM.L–1 in points
1 and 3, respectively.
Table 3. Abiotic parameters in the collection sites in the Cachoeira River - mean ± standard deviation. (Different letters mean significant difference at p < 0.05 level).
Conductivity (µS.cm–1) Temperature (°C) pH OD (mg.L–1) OD (%)
P1 457 ± 103a 28.1 ± 1.9 7.22 ± 0.80a 7.7 ± 1.3a 97.8 ± 16.7a
P2 463 ± 101a 27.8 ± 2.0 6.98 ± 0.76a,b 6.8 ± 1.5a 86.6 ± 20a
P3 501 ± 148a 27.3 ± 1.9 6.66 ± 0.34a,b 4.1 ± 2.3b 51.5 ± 29.7b
P4 483 ± 109a 26.9 ± 1.7 6.52 ± 0.38a,b 4.8 ± 1.4b 60.2 ± 20.8b
P5 442 ± 108a 27.4 ± 1.6 6.45 ± 0.54b 6.2 ± 1.6a,b 75.0 ± 18.8a,b
P6 759 ± 1247b 27.5 ± 1.3 6.79 ± 0.46a,b 6.8 ± 1.3a,b 85.9 ± 17.4a,b
Acta Limnologica Brasiliensia
of ammonium and phosphate were found in point 3 followed by points 4, 5 and 6.
Higher PO4– concentrations have been reported
in several studies conducted on the watershed of the Cachoeira River (Pinho, 2001; Klumpp et al., 2002; Lima, 2006). The presence of this ion is associated with organic waste dumping; therefore, it is expected that there is a greater PO43– concentrationas a
consequence of industrial and domestic effluents. The same pattern was observed for the nitrogen compounds; NH4+ was the predominant form in
point 3, while NO3– was the main form in points 4,
5 and 6. It is possible that the increase of dissolved oxygen from point 4 has facilitated the nitrification processes by increasing the availability of NO3- in the most downstream points of the river.
Compared to other studies, the NO2– and
NO3– found in the Cachoeira River were higher
than those found in the Ditinho River- SC (5.4 and 0.1 µM L–1) (Dorigon et al., 2008) and
the Piracicaba River - SP (Salomão, 2004) with concentrations of 10 and 50 µM L–1, respectively.
axes whereas samples collected in the dry season were negatively correlated with both axes (Figure 8).
4. Discussion
Anthropic activities and land use changes appear to be the major factors influencing the distribution of nutrients in the Cachoeira River; however, lithology seems to be the factor influencing the major ions.The higher NH4+ and PO
4 3–
concentrations in points 3 and 4 could be explained by the fact that point 3 is located in an urban center in which domestic sewage directly discharges into the river; in point 4, the contribution of upstream sewage as well as the influx of agricultural tributaries (pasture) should also be noted.
Agricultural practices can provide major changes in the composition of runoff waters: the use of fertilizers increases the amount of nitrates, phosphates and therefore, contributes tothe eutrophication of water systems (Todeschini, 2005). In the Cachoeira River, the highest concentrations
weathering in the drainage basin, ranging from the parent rock weathering to different combinations of cations and anions dissolved in the solution (Biggs et al., 2002).The highest values were found at point 1, which represents the nearest site of the Cachoeira River formation, in the confluence of Salgado and Colônia Rivers, and the lowest values were found at point 6. This is probably due to the geological formation of the Salgado River, which However, the NH4+ concentration showed lower
values compared to these studies due to these watersheds present the effects of agricultural activities and the influence of urban centers.
Although the nutrient concentration varies according to land use changes, major ions vary according to the geological formation. A decline in Cl–, SO
4–2 and Mg+2 concentrations was
observedalong the river. The main rock chemistry domains provide an overview ofthe chemical
Acta Limnologica Brasiliensia
which is located in a polluted area; and by Souza and Tundisi (2003), in a river of the Tietê/Jacaré sub-basin (Jaú River), which presents discretesource pollution and small riparian vegetation (Table 4).
Potassium presented the lowest concentration at point 1, showing an increase travelling upstream to downstream with the highest concentration found in point 5. The increase along the river is probably due to growing deforestation for crops and pasture, as this ion is a major constituent of mineral has high concentrations of several ions, such as Cl–,
Mg+2, Na+, K+ and Ca+2 (Santos, 2005).
Williams et al. (2001) and Martinelli et al. (2005) have found Cl–, SO
4–2, Mg+2, Na+ and
Ca+2 concentrations similar to those found in this
work inthe Piracicaba River watershed, which is characterized by a highly dense population, large pasture areas, sugar cane farms, and industries. Similar trends were found by Ometto et al. (2000), in a tributary of the Piracicaba River (Pisca River),
Figure 6. Temporal variation of phosphorus (PO4–), ammonium (NH4+), nitrite (NO2–) and nitrate (NO3–) in Cachoeira River. Concentration in µM.L–1.
Table 4. Comparison of the concentrations of major ions found in this study with other studies conducted in lotic environments.Values in µM.L–1. Area in km2.
Land use
Area of
the basinPopulation Cl SO4 Mg
+2 Na+ Ca2+ Reference
Salgado River (BA) Pastures 1020 4600 9938.0 71.5 1865.3 5136.9 2173.3 Santos (2005)
Piracicaba River (SP) Sugar cane culture and pastures
12600 3400000 197.5 289.5 218.1 466.0 267.0 Williams et al. (2001)
Piracicaba River (SP) Sugar cane culture and pastures
12600 3400000 627.0 349.0 85.0 1354.0 231.0 Martinelli et al.(2005)
Pisca River (SP) Sugar cane
culture and pastures
130.0 − 143.7 191.8 305.0 766.2 398.1 Omettoet al. (2000)
Jaú River (SP) Sugar cane
culture, pastures and ciliary vegetation
745.0 173420 − − 169.9 346.9 200.7 Souza and
Tundisi (2003)
Cachoeira River (BA) Cocoa culture and pastures
concentrations in deforestation areas were observed during the dry season.
Similar to nutrient concentration, the highest values of Mg+2, Ca+2 e Na+ were also found in the
driest periods (August and October/2008).This pattern could be confirmed with PCA where a clear correlation was observed between samples collected in dry season and ions such as Ca+2, Na+, HCO
3– and
Mg+2 that were positively correlated with axis 2 as
soon as P1 and P2 (Figure 8).
In a study ofthe Salgado River, Santos (2005) also found the highest Na+, Ca+2 and Mg+2
concentrations at the end of the rainy season. During the lowest rainfall period in the study developed by Martinelli et al. (1999b) on the fertilizers (Biggs et al., 2002). K+ was at its highest
concentration in February, at the end of the rainy season, while its lowest concentration was found in October, with the lowest monthly precipitation. Based on this information, it is possible to deduce that K+ originates from the use of mineral fertilizers
and its concentration in the water body is influenced by the amount of surface runoff.
The temporal variation showed differences between the dry and rainy season with the higher concentrations found in the driest months. August and October/08 presented the higher NH4+ and
PO4– concentrations, which coincides with the
months of lower precipitation.The same pattern was observed by Neill et al. (2001) in two watersheds located in Rondônia State, where the highest
Acta Limnologica Brasiliensia
sewage (Todeschini, 2005). This fact can be observed in this study, since the Cachoeira River directly undergoes the effects of the release of untreated sewage and water originating from surface runoff increasing the nitrogen and phosphorus concentration.
5. Conclusion
The environmental degradation resulting from the replacement of native vegetation by agricultural crops - mainly cocoa monoculture - and thereafter transformed into livestock areas has provoked deterioration of the water resources of the Cachoeira River. This damage caused to the drainage basin was worsenedby deforestation (lack of riparian vegetation) and the inadequate use of soil, which causes increased runoff, the contribution of untreated effluents from cities, and agricultural and industrial activities. This condition is enhanced by the low river discharge in the dry months. Variations in ion concentrations were directly related to drought and rainy periods, the geological formation, and the various land uses.The lack of treatment of such residues and their incorrect disposal has significantly contributed to the aggravation of environmental problems and the health of the population.The proper handling of surface waters Piracicaba River, the highest values of these ions
were also found.
Salomão (2004) has observed a correlation between flow and ion concentration; during the lower flow periods, Na+ and Ca+2 concentrations
were the highest in all the basins studied. The same trend was observed in the Cachoeira River, in which higher concentrations were observed in low flow periods. Likewise Smith (1999) has found the highest Na+ concentrations at the lower
portion of the Paraiba do Sul River, in the low-flow period; still, such temporal variation is related to the temporal dilution of base flow and anthropogenic sources. The dilution caused by the increased influence of surface and subsurface runoff during the flood period can dilute the anthropogenic sources (sewage).
The effective contribution of Ca+2 in surface
waters is explained by the geological predominance and climate. Likewise, Mg+2, Ca+2 are very sensitive
to leaching; drainage water is, therefore, the main contributor to the influxof such elements to waterways in rainy periods (Boyer et al., 2002).
Besides the contribution of lithology and soil, aquatic environments also receive contributions from vegetation, climate, living organisms and human activities. Among the latter contributions, we highlight: domestic, industrial and agricultural
DANA, JD. and FRANCO, RR. 1976. Manual de Mineralogia. Rio de Janeiro: ao livro técnico e científico. vol. 2, 642 p.
DANIEL, MHB., MONTEBELO, AA., BERNARDES, MC., OMETTO, J., CAMARGO, PB., KRUSCHE, AV., BALLESTER, MV., VICTORIA, RL. and MARTINELLI, LA. 2002. Effects of urban sewage on dissolved oxygen, dissolved inorganic and organic carbon, and electrical conductivity of small streams along a gradient of urbanization in the Piracicaba River basin. Water, Air and Soil Pollution, vol.136, no. 1-4, p. 189-206.
DORIGON, EB., STOLBERG, J. and PERDOMO, CC. 2008. Qualidade da água em uma microbacia de uso agrícola e urbano em Xanxerê – SC. Revista de Ciências Ambientais, vol. 2, no. 2, p. 105-120. FRITZSONS, E., HINDI, EC., MANTOVANI, LE.
and RIZZI, NE. 2003. Conseqüências da alteração da vazão sobre alguns parâmetros de qualidade de água fluvial. Revista Floresta, vol. 33, no. 2, p. 201-214. KLUMPP, A., BAUER, K., FRANZ-GERSTEIN, C.
and MENEZES, M. 2002. Variation of nutrient and metal concentrations in aquatic macrophytes along the Rio Cachoeira in Bahia (Brazil). Environment International, vol. 28, no. 3, p. 165-171. http:// dx.doi.org/10.1016/S0160-4120(02)00026-0 LEWIS, E. and WALLACE, DWR. 1998. Program
Developed for CO2 System Calculations. Oak Ridge: Department of Energy. 38 p. ORNL/CDIAC-105. Carbon Dioxide Information Analysis Center, Oak Ridge National Laboratory, U. S.
LIMA, MC. 2006. Dinâmica dos nutrientes inorgânicos dissolvidos no Rio Cachoeira. Ilhéus: UESC. 17 p. Relatório final, PIBIC.
MARTINELLI, LA., BALLESTER, MV., KRUSCHE, AV., VICTORIA, RL., CAMARGO, PB., BERNARDES, M. and OMETTO, J. 1999a. Landcover changes and delta C-13 composition of riverine particulate organic matter in the Piracicaba River Basin (southeast region of Brazil). Limnology and Oceanography, vol. 44, no. 7, p. 1826-1833. http://dx.doi.org/10.4319/lo.1999.44.7.1826 MARTINELLI, LA., PICCOLO, MC., TOWNSEND,
AR., VITOUSEK, PM., CUEVAS, E., McDOWELL, WH., ROBERTSON, GP., SANTOS, OC. and TRESEDER, K. 1999b. Nitrogen stable isotopic composition of leaves and soil: tropical versus temperate forests. Biogeochemistry, vol. 46, no. 1-3, p. 45-65. http://dx.doi.org/10.1007/BF01007573 MARTINELLI, LA., FERRAZ, ESB. and SILVA, DML.,
org. 2005. Caderno de Bacias Hidrográficas do Estado de São Paulo. São Paulo. 140 p.
NACIF, PGS., COSTA, LM., SAADI, A., FERNADES-FILHO, EI., KER, JC., COSTA, OV. and MOREAU, MS. 2003. Ambientes naturais da bacia hidrográfica in this area requires that effluents becollected and
treated before being discharged into water bodies.
Acknowledgements
This study was supported by CNPq (CT-HIDRO/MCT/CNPq nº 14/2005) and UESC. Lucio, MZTPQL was partially supported by CAPES. We thanks to UESC for the logistical support and to all that contributed during land field work. We also thanks to Jim Hesson for the english corrections on the manuscript.
References
Bahia. Secretaria de Recursos Hídricos – SRH. 1995. Plano diretor dos recursos hídricos da bacia do leste. Salvador. 198 p.
Bahia. Secretaria de Recursos Hídricos – SRH. 2001. Programa de recuperação das bacias hidrográficas dos Rios Cachoeira e Almada -Diagnóstico Regional: Caracterização Hidrológica. Ilhéus. vol. 1, tomo 4, 293 p.
BARBOSA, JSF. and DOMINGUES, JML. 1996. Mapa geológico do estado da Bahia – Texto explicativo. Salvador: Universidade Federal da Bahia, Governo do estado da Bahia. 382 p.
BIGGS, TW., DUNNE, T., DOMINGUES, TF. and MARTINELLI, LA. 2002. Relative influence of natural watershed properties and human disturbance on stream solute concentrations in the southwestern Brazilian Amazon basin. Water Resourses Research, vol. 38, no. 8, p. 1-16.
BOYER, EW., GOODALE, CL., JAWORSKI, NA. and HOWART, RN. 2002. Anthropogenic nitrogen soucersan relationships to riverine nitrogen export in the northeastern USA. Biogeochemistry, vol. 57-58, no. 1, p. 137-169.
CARMOUZE, JP. 1994. O metabolismo dos ecossistemas aquáticos. São Paulo: Edgar Blücher. 254 p.
CHAPMAN, PJ., EDWARDS, AC. and CRESSER, MS. 2001. The nitrogen composition of streams in upland Scotland: some regional and seasonal differences. Science of the Total Environment, vol. 265, p. 265-283. http://dx.doi.org/10.1016%2 FS0048-9697%2800%2900650-1
C o m p a n h i a d e P e s q u i s a d e R e c u r s o s Minerais - CPRM. 1997. Programa Levantamentos G e o l ó g i c o s B á s i c o s d o B r a s i l. B r a s í l i a : CPRM. 276 p. Itabuna. Folha SD. 24-Y-B-VI. CORRIVEAU, J., VAN BOCHOVE, E., SAVARD,
Acta Limnologica Brasiliensia
apresentando diferentes características de ocupação de solo. Piracicaba: Centro de Energia Nuclear na Agricultura. 117 p. [Tese de Doutorado em Ciências]. SCHIAVETTI, A., SCHILLING, AC. and OLIVEIRA,
HT. 2005. Caracterização sócio-ambiental da bacia hidrográfica do Rio Cachoeira, sul da Bahia, Brasil. In SCHIAVETTI, A. and CAMARGO, AFM., eds. Conceito de bacias hidrográficas: teorias e aplicações. Ilhéus: Editus Editora. p. 141-161.
S O U Z A , A D G . a n d T U N D I S I , J G . 2 0 0 3 . Hidrogeochemical comparative study of the Jaú and Jacaré-Guaçu river watersheds, São Paulo, Brazil. Revista Brasileira de Biologia, vol. 60, no. 4, p. 563-570.
TODESCHINI, ML. 2005. Dinâmica espacial e temporal das características físicas e químicas do Rio Cubatão e distribuição espacial da bacia hidrográfica – litoral do Paraná. Curitiba: Universidade Federal do Paraná. 144 p. [Dissertação de Mestrado em Geologia Ambiental].
TUNDISI, JG and MATSUMURA-TUNDISI, T. 2008. Limnologia. São Paulo: Ed. Oficina de Textos. 631 p. WILLIAMS, MR., FILOSO, S., MARTINELLI,
LA., LARA, LB. and CAMARGO, PB. 2001. Precipitation and River Water Chemistry of the Piracicaba River Basin, Southeast Brazil. Journal of Environmental Quality, vol. 30, no. 3, p. 967-981. http://dx.doi.org/10.2134/jeq2001.303967x
Received: 05 December 2010 Accepted: 24 September 2012 do Rio Cachoeira. Viçosa: Universidade Federal de
Viçosa. [Tese de Doutorado em Solo].
NEILL, C., DEEGAN, LA., THOMAS, SM. and CERRI, CC. 2001. Deforestation for pasture alters nitrogen and phosphorus in small amazonian streams. Ecological Applications, vol. 11, no. 6, p. 1817-1828. http://dx.doi.org/10.1890/1051-0761(2001)011[1817:DFPANA]2.0.CO;2 OMETTO, JPHB., MARTINELLI, LA., BALLESTER,
MV., GESSNER, A., KRUSCHE, AV., VICTORIA, RL. and WILLIAMS, M. 2000. Effects of land use on water chemistry and macroinvertebrates in two streams of the Piracicaba river basin, south-east Brazil. Freshwater Biology, vol. 44, no. 2, p. 327-337. http:// dx.doi.org/10.1046/j.1365-2427.2000.00557.x PINHO, AG. 2001. Estudo da qualidade das águas do Rio
Cachoeira – Região Sul da Bahia. Ilhéus: Universidade Estadual de Santa Cruz. 133 p. [Dissertação de Mestrado em Desenvolvimento Regional e Meio Ambiente].
SANTOS, JW. 2005. Fácies hidrogeoquímicas da bacia do Rio Salgado – Sul da Bahia. Ilhéus: Universidade Estadual de Santa Cruz. 133 p. [Dissertação de Mestrado em Desenvolvimento Regional e Meio Ambiente].