1Centro Polar e Climático, Universidade Federal do Rio Grande do Sul – Porto Alegre (RS), Brazil. E-mails: [email protected], [email protected],
2Climate Change Institute, Sawyer Environmental Research Center, University of Maine – Orono, Maine, United States.
E-mail: [email protected] *Corresponding author.
Manuscript ID: 20180037. Received on: 03/31/2018. Approved on: 08/27/2018.
ABSTRACT: The study of atmospheric aerosols through polar ice cores is one of the most common and robust tools for the investigation of past changes in the circulation and chemistry of the atmosphere. Only a few subannual resolution records are available for the development of paleochemical and environmental interpretations. Here, we report the ionic content record for the period of 1882–2008 A.D. in an ice core recovered at the ice divide of the West Antarctic Ice Sheet. The ion concentrations found in the core were determined by ion chromatography on more than 2,000 samples and the basic statistics were calculated for major inorganic and organic ions. The dating of the core layers was based on the seasonality of SO4
2‑, NO 3
‑, and Na+, checked by the identification of the Krakatau (1883), Agung (1963) and Pinatubo/Hudson (1991) volcanic eruption signals. Significant aerosol input events were identified and grouped considering the ions present, their provenance and the season. The ionic balance, together with the decomposition of some origin indicators, showed that 36% of the ionic charge is derived from sea salt aerosols, 13% from mineral dust, and 17% from biogenic marine activity, while 34% are mainly products of chemical reactivity in the atmosphere.
KEYWORDS: aerosols; ice core; West Antarctic Ice Sheet; trace analysis; ion chromatography.
Ionic content in an ice core from the
West Antarctic Ice Sheet: 1882–2008 A.D.
Isaías Ullmann Thoen1* , Jefferson Cardia Simões1,2 ,
Filipe Gaudie Ley Lindau1, Sharon Buchanan Sneed2
ARTICLE
INTRODUCTION
The chemical investigation of polar ice cores is an excel-lent tool in paleoclimatology, especially due to its wide envi-ronmental representation when compared to other existing paleoclimatic techniques. An ice core is a reliable local record of past atmospheric conditions that may be representative for a region. Moreover, it can be especially useful for regions with limited instrumental records. While glaciochemical information for central West Antarctica remains scarce (Steig
et al. 2009), some reports suggest that in recent decades this portion of the continent has been experiencing important regional climate changes such as increased precipitation and warming (Kaspari et al. 2004, Bromwich et al. 2012). Furthermore, there is a lack of long-term records useful for improvement of climate models and for assessment within, at least, the time scale of the last two centuries.
The ionic content in snow is widely used to study atmo-spheric aerosols. The characterization of most ionic vari-ability profiles obtained provides the first understanding to investigate and assess atmospheric aerosols, which in turn are
proxies linked with long transport pathways, environmental conditions of source regions, and chemical kinetics in the past atmosphere. Thus, with other trace chemical species, the contents of the main ions found in ice cores are used to provide co-registered paleochemical records.
A part of a high-resolution paleochemical record for the Mount Johns region was obtained from an ice core located near the ice divide of the Pine Island Glacier drainage basin in the West Antarctic Ice Sheet (WAIS). We present in this study the ion chromatography (IC) analytical results from the upper 45.8 m of the ice core, which represent the period from 1882 to 2008 A.D. This core is a contribution of the International Trans-Antarctic Scientific Expedition (ITASE) programme (Mayewski et al. 2005), an initiative with the goal of collecting data from the last two centuries in Antarctica.
MATERIALS AND METHODS
WAIS central sector near the Pine Island Glacier drainage basin divide (Fig. 1). Due to the low ice flow rate (approxi-mately 14 m yr-1; Rignot et al. 2011), reduced deformation of stratigraphic layers is expected for this site. Annual snow accumulation rates are usually higher than 0.08 m w.e.), enough to ensure a seasonal stratigraphic resolution (Steig
et al. 2005, Kaspari et al. 2004). The core comes from a region that has an interesting pattern of atmospheric cir-culation caused by the confluence of air masses originat-ing from the Weddell, Amundsen and Belloriginat-ingshausen Seas (Parish & Bromwich 2007). These were decisive factors in the choice of the core-drilling site indicated in Figure 1 (map of Antarctica).
Sampling
The Mount Johns core was recovered by a Brazilian team from Centro Polar e Climático in the 2008/2009 austral summer. The core was 92 m of firn and ice in 94 sections of approximately 1 m length and 8.5 cm diameter. During the drilling and extraction, the visual stratigraphy was described. The methodology for the core collection, processing, and a description of the visual stratigraphy found, as well as the density profile, are described in Schwanck et al. (2016b). All sections were packed in polyethylene bags and placed in Styrofoam boxes for transport at temperatures below -15ºC from the field to the Climate Change Institute at the University of Maine, Orono, USA, to be processed according to the continuous melting with discrete sampling (CMDS) methodology described by Osterberg et al. (2006).
The ice core processing consists of preparation, followed by melting and collection of discrete sections, as analysable aliquots. Cutting, thinning, decontaminating and hold-ing the sections in polymethyl methacrylate melter sup-ports followed a stratigraphic and cleaning protocol control (ISO 14644-1) under class 5 laminar airflow hoods in an environment below -20ºC. The melting and sub-sampling occurred entirely within a class 7 clean room equipped with class 5 laminar airflow hoods where sit the collectors (auto samplers) used to separate the co-registered samples for inductively coupled plasma mass spectrometry (ICP-MS) and IC analysis. These samples come from the internal and uncontaminated part of the freshly melted ice core. Melting occurs by contact with a modified Wagenbach-style Ni270 controlled heating plate, while drainage tubes extract water by peristaltic pumping (Osterberg et al. 2006). The external portion of the ice core was co-sampled in the same way for determination of the stable isotope ratios (δD and δ18O) by the cavity ring-down spectroscopy (CRDS) technique.
The core was fully melted and sub-sampled with a mean stratigraphic resolution of 2.1 cm. ICP-MS and CRDS results have been published elsewhere (Schwanck et al. 2016a,
2016b). The samples and blanks in polypropylene vials were stored below -15ºC in a cold room, packed for thermic transport and sent ready to be analysed at the Centro Polar e Climático laboratory in Porto Alegre (Brazil), by an ion exchange chromatography (IEC) system described below.
Analysis by ion chromatography
Anions and cations were here analysed using two Dionex™ conductivity measuring instruments (ICS-2000 and ICS-2100) scaled according a 2-mm column diame-ter size, coupled on simultaneous injection mode with an auto-sampler. The separation of analytes was performed using gradient concentrations of the eluents passing through their respective columns. We set fixed loops of 250 µL for direct sample injections, considering the load of the expected ionic matrix. To improve detection limits and signal-to-noise ratios, we placed an electrochemical ion suppressor compartment. The obtained background conductivity was always below 1 µS cm-1.
Quality control
The laboratory activities conformed to normative cri-teria of quality (ASTM D4453), care and control of sam-ple contamination. The lab water reagent (ASTM D1193) must have low and, ideally, constant levels of contaminants. Thus, type I water was always used (>18.0 MΩ cm at 25ºC). The lab materials were defined according to chemical stability tables and internal reproducibility tests at typical working conditions. Materials and tools were previously decontam-inated following an internal cleaning protocol. Any direct sample handling was performed under a class 5 laminar-air-flow hood installed in a class 7 clean room. The same room conditions were used for the operation of the instruments.
Figure 1. Geographic location of the Mount Johns ice core in (A) and (B). Note other nearby core sites from the ITASE programme and the basin drainage limits detailed in (C).Sources: Cartographic databases from Steig et al.
for all inorganic ions, especially Ca2+, indicating some degree of overestimation on quantification, while negative devia-tions found for most of the organic ions were associated with losses by chemical degradation, especially for HCOO-. Blanks from sub-sampling steps were also analysed, and their replicate means were calculated for subtraction from the analytical datasets.
As dataset treatment, analytical results were tabulated in stratigraphic order, and basic statistical parameters were calculated. Some outliers were identified and disregarded, using as the cut-off criterion the median plus 10σ. The use
of medians, instead of means, was considered a preferable central tendency measure due to normality test rejections at α< 0.05 level for all profiles, which implies skewed
data. Furthermore, medians are less susceptible to influ-ence by outliers.
RESULTS
Schwanck et al. (2016a, 2016b) published information on the stratigraphy, physical properties and ICP-MS results for the Mount Johns ice core. Here, we provide co-registered data from the ion chromatography analysis. The main ana-lytes, at trace concentrations in the core matrix, are the major ions Na+, K+, NH
4
+, Mg2+, Ca2+, Cl-, SO 4
2-, and NO 3
- and,
additionally, the minor organic acid ions H3CSO3-, HCOO-, H3CCOO- and C
2O4
2. We report the results of the upper
2,164 samples. Basic statistics calculated for each ion data-set are shown in Table 1.
The ionic median concentrations represent each contri-bution to the bulk ions in the studied period (1882–2008), as a fraction on the mean ion balance. Their sum provides an estimate of the total ionic load average (4.99 µeq L-1). The carboxylic groups HCOO-, H
3CCOO
- and C 2O4
2-
rep-resent less than 5% of the total anionic content estimated, while the major anions compose more than 92%, includ-ing Cl- (38%), NO
3
- (33%) and SO 4
2- (22%). The cation
content is essentially acid, with approximately 40% of cal-culated free acidity, followed by Na+ (29%), NH
4
+ (13%),
Mg2+ (12%), Ca2+ (4%) and K+ (1%). The global analytical uncertainty of the total bulk ionic concentration, calculated using a combination of uncertainties from 12 analytes, is estimated at approximately 1.6%. The calcium median (by ICP-MS), extracted from co-registered data in Schwanck
et al. (2016b), was chosen to represent this fraction over the ionic balance estimation instead of the Ca2+ median (by IEC), due to the difference between their analytical consistencies.
Dating
We performed the dating of the record by visual count-ing of the annual layers (summer-winter variations) in some
Table 1. Basic statistics of ionic profiles from the Mount Johns ice core (central West Antarctica). Amounts in µg L-1 (except for H+, in µeq L-1).
Variable Minimum Maximum Mean Median
(Md) ± σ (Md + 2σ)Cutoff
Sample numbers
(N)
Na+ 0.2 330.9 24.2 16.6 28.2 72.9 2,157
Mg2+ 0.1 28.5 4.8 3.7 3.7 11.2 2,161
Cl- 3.4 390.1 46.3 33.3 43.7 120.7 2,157
SO42- 7.5 189.3 30.2 25.9 17.7 61.2 2,161
nssSO42- 1.2 134.3 24.6 20.5 16.5 53.4 2,123
Ca2+ 0.4 23.7 6.1 5.4 3.4 12.1 2,149
K+ 0.4 65.8 2.2 1.3 3.7 8.6 2,138
NO3- 15.4 148.7 53.1 50.8 18.5 87.8 2,161
NH4+ 0.5 53.2 6.1 5.8 4.7 15.2 1,861
H3CSO3- 0.6 50.1 8.4 7.1 5.4 18.0 2,153
H3CCOO- 0.3 50.6 4.6 3.4 4.7 12.9 1,861
HCOO- 0.4 28.7 2.2 1.7 2.5 6.7 1,860
C2O42- 0.5 24.3 1.4 1.1 1.8 4.8 1,861
H+
ionic profiles, especially in non-sea salt sulphate (nssSO42-) and NO3- with summer peaks, in antiphase with Na+ (win-ter peaks), and absolute dating by identifying known vol-canic eruption signals that also appear in other Antarctic ice cores (Tab. 2).
The nssSO42- was calculated by the difference in amount between the measured SO42- and its fraction from sea salt (ssSO42-), which in turn was calculated considering the pro-portionality of salts found in mean seawater following the methodology in Dixon et al. (2004) and Steig et al. (2005). The dating based on the nssSO42- stratigraphy profile is illus-trated in Figure 2. Note the clear increase in winter minima next to volcanic events. The period covered (1882–2008 A.D.) has relative precision of approximately 1 month and absolute dating less than 2 years, in agreement with results obtained by Steig et al. (2005) with a similar methodology for sampling and analysis.
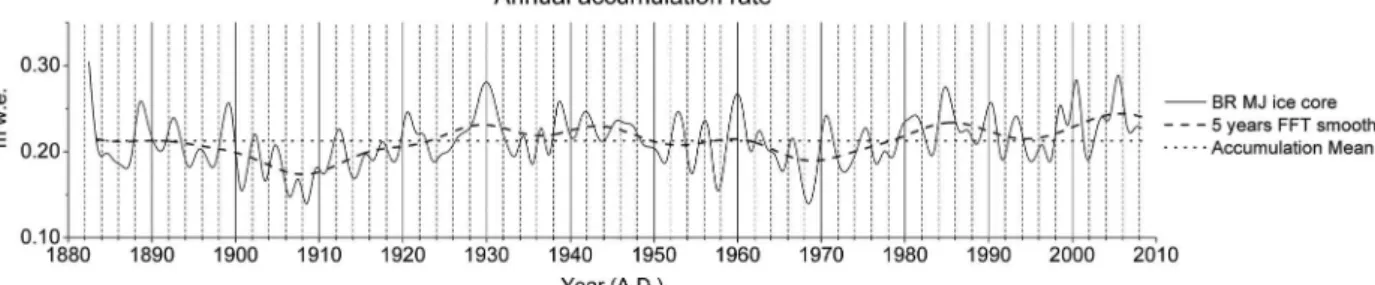
The dating of the layer provides the annual accumulation rate profile, after real depth conversion to water equivalent
depth (m w.e.) by multiplying the firn/ice stratigraphy den-sity profile. For this 127-year period, the annual accumu-lation rate varies from 0.11 to 0.34 m w.e., with a mean of 0.21 ± 0.04 (1σ) m w.e. (see Fig. 3). The analysis of variance
shows no significant trend at the α< 0.05level. The variability
softened by a 5-year fast Fourier transform (FFT) filtered at a 0.1 cut-off shows 2 clear periods of 20 years of accumula-tion rates below the mean (1900–1920 and 1960–1980), in contrast with the clearly above-the-mean periods 1920–1950 and before 1900 and after 2000 A.D.
Time series of ion variability are shown in Figures 4 and 5. The ionic profiles have been smoothed by 3 adjacent sample averages, except for the Ca2+ series, with two passes to reduce noise, as the concentration was determined with a lower precision.
Significant events
An assessment of the ion profiles permits the identifica-tion of the highest concentraidentifica-tion peaks and their duraidentifica-tions.
Table 2. Volcanic SO42- signals identified for the period 1882–2008 A.D.
Eruption Latitude Event Signal found
VEI* Start date Start date Delay Duration Intensity
Krakatoa 6°S 6 08/1883 1884.7 1.0 yr. 3.0 yr. Strong
Santa Maria 15°N 6 10/1902 1903.9 1.1 yr. 2.1 yr. Moderate
Agung 8°S 4 03/1963 1964.2 0.9 yr. 2.3 yr. Moderate
El Chichón** 17°N 5 04/1982 1983,3 1.0 yr. 1.0 yr. Weak
Pinatubo 15°N 6 06/1991
1992,1
0.6 yr.
2.9 yr. Moderate
Cerro Hudson 46°S 5 08/1991 0.4 yr.
*VEI: Volcanic Explosivity Index that compares themagnitude of different volcanic eruptions considering factors such as plume height, bulk of material
emitted and eruption duration;**refers to signal not confirmed in other profiles.
Figure 2. Dating over the non-sea salt sulphate (nssSO42-) concentrations in the stratigraphy profile obtained
They are interpreted as important events of ionic load inputs associated with exceptional climatic conditions. These extreme events are identified using as selection criteria values higher than the median plus 2σ in each profile. Events are
con-sidered significant if the signals are found at least in three different ion profiles, and they are grouped by types consid-ering the main ions affected, the season and the associated provenance (see Tab. 3).
DISCUSSION
Ionic concentration time series
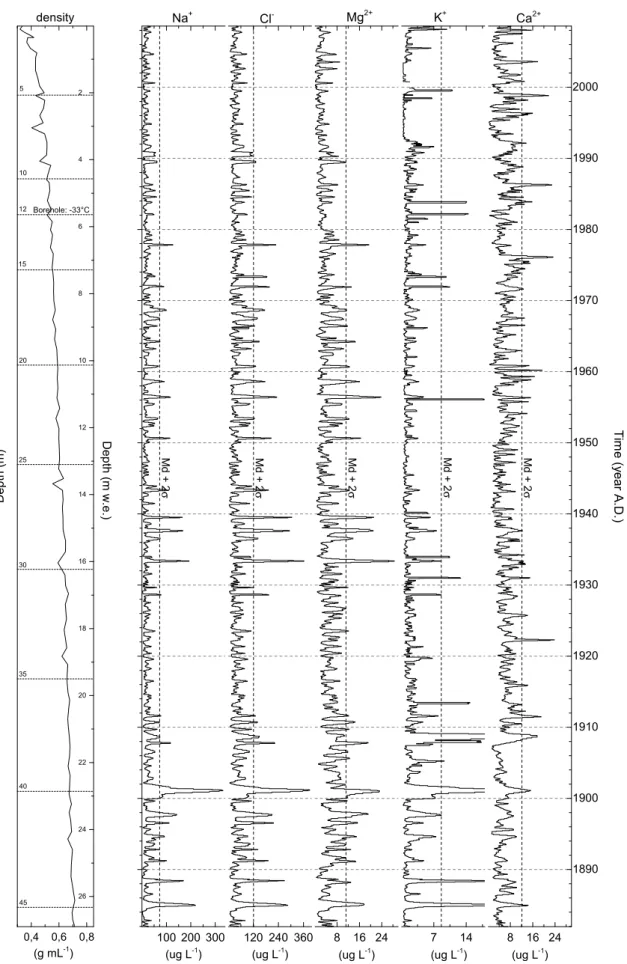
The basic statistical results in Table 1 are similar to others already published for West Antarctica with similar method-ology (i.e.,Bertler et al. 2005, Dixon et al. 2011). Spearman’s correlation between Na+ and Cl- is 0.96 and between Mg2+ and Cl- is 0.81 at the α < 0.05 level. These strong correla-tions indicate that they have essentially the same source (sea salt), also observed in significant events such as the 1901 and 1933 A.D. winter peaks, especially of Na+, Mg2+ and Cl-, and probably from advective air masses coming from the Weddell, Amundsen and Bellingshausen Seas. The lower proportions of Ca2+ and K+ in sea salt aerosols also contribute to lower correlations, such as Na+ with Ca2+ (0.23, α < 0.05) and Na+ with K+ (0.65, α < 0.05), or Mg2+ with Ca2+ (0.21,
α < 0.05) and with K+ (0.60, α < 0.05). The low correlations with Ca2+ are, in part, due to excessive data noise; however, they could also imply another main source, as indicated by the Ca2+ correlation with K+, with a relatively higher result (0.36, α < 0.05), suggesting dust mineral aerosols as a
com-mon source of Ca2+ and K+.
Mineral dust intake during SE1-type events (Tab. 3) is evident in the Cl-/Na+ profile. Ratios lower than the sea salt one (1.8) indicate an excess of non-sea salt Na+ (nssNa+). These low ratios coincide with peaks of Ca2+, K+, NH
4 + and
negative values of calculated acidity, all indicative of a con-tribution from mineral dust. Furthermore, these low ratios
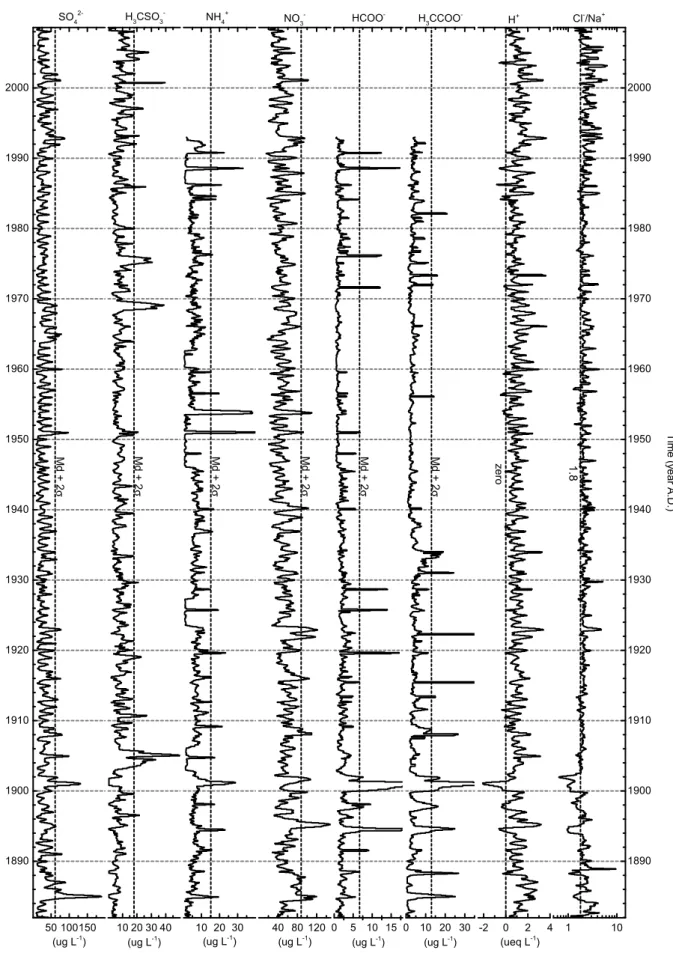
also coincide with peaks of sea salt ions, highlighting that the decrease in the Cl-/Na+ ratio is not due to Cl- depletion for these specific events. The Cl-/Na+ median ratio is 2.0, slightly higher than the expected 1.8 when mostly sea salt is present, reflecting an excess of Cl- during summers (probably as HCl), while the Cl-/Na+ profile is approximately 1.8 in winter. The acidity profile has summer maxima confirmed with the negative correlations (at α < 0.05) with sea salt and
mineral dust indicators, such as Na+(-0.33), K+ (-0.29), Mg2+ (-0.37) and Ca2+ (-0.37), which, in turn, increase in winter.
The high correlation between SO42- and its nssSO 4
2-fraction (0.92 at α < 0.05) is due to the prevalence of the
latter fraction over the total content. However, ssSO42- is also clearly present on the SO42- profile, with higher values in significant events of sea salt inputs. Both profiles show clear seasonality with summer maxima, and likewise for NH4+ and H
3CSO3
-, indicating an association with marine
biogenic sources.
Due to the exclusive production of methane sulphonic acid (H3CSO3H) from biogenic marine sources, the presence of intense H3CSO3- peaks with low temporal correspondence with nssSO42- suggests other occasional geographic sources of the former, probably from lower latitudes with more active biogenic production. The nssSO42- correlations with NO
3
-(0.54 at α < 0.05) and H+ (0.74 at α < 0.05) indicate that there is also a positive nssSO42- association with the oxida-tive capacity of the atmosphere, essentially photochemistry, recognized by Wolff (2013) as the main source of NO3- in the Antarctic atmosphere. This can be explained by the vari-ation of solar energy inputs that affects both marine bio-genic activity and atmospheric photochemistry. Comparing NO3- and nssSO
4
2-, some periods observed have a short delay
on NO3- signals (approximately 0.2 years), possibly due to post-depositional effects of NO3- remobilization within the firn, according Wolff’s (2013) hypothesis.
The NH4+ profile has low seasonal amplitude (approxi-mately 5 µg L-1) with summer maximum in comparison to its total variability (52.7 µg L-1), which highlights two dif-ferent sources, one biogenic and other terrestrial, as observed
7 14
K+
(ug L-1)
M
d
+
2
σ
8 16 24
Mg2+
(ug L-1)
M
d
+
2
σ
120 240 360
Cl
-(ug L-1
)
M
d
+
2
σ
100 200 300
Na+
(ug L-1
)
M
d
+
2
σ
2
4
6
8
10
12
14
16
18
20
22
24
26
0,4 0,6 0,8
D
e
p
th
(m
w
.e
.)
density
(g mL-1
)
D
e
p
th
(m
)
5
15 10
20
25
30
35
40
45
12 Borehole: -33°C
1890 1900 1910 1920 1930 1940 1950 1960 1970 1980 1990 2000
8 16 24
Ca2+
T
im
e
(y
e
a
r
A
.D
.)
(ug L-1)
M
d
+
2
σ
Figure 4. Density, Na+, Cl-, Mg2+, K+ and Ca2+ profiles for the upper 45.8 m depth (26.9 m w.e.) of the Mount Johns
-2 0 2 4 H+
(ueq L-1 )
z
e
ro
0 10 20 30 H3CCOO
-(ug L-1 )
M
d
+
2
σ
40 80 120 NO3
-(ug L-1 )
M
d
+
2
σ
10 20 30 NH4+
(ug L-1 )
M
d
+
2
σ
10 20 30 40 H3CSO3
-(ug L-1)
M
d
+
2
σ
1890 1900 1910 1920 1930 1940 1950 1960 1970 1980 1990 2000
50 100150 SO4
2-(ug L-1 )
T
im
e
(y
e
a
r
A
.D
.)
M
d
+
2
σ
1890 1900 1910 1920 1930 1940 1950 1960 1970 1980 1990 2000
1 10
Cl -/Na+
T
im
e
(y
e
a
r
A
.D
.)
1
.8
0 5 10 15 HCOO
-(ug L-1 )
M
d
+
2
σ
Figure 5. SO42-, H
3CSO3-, NH4 +, NO
3-, H3CCOO-, HCOO-, the calculated free H+ and Cl-/Na+ ratio profiles for the upper
Table 3. Main events identified in the Mount Johns record (grouped in types of classes). SE stands for “Significant Event”.
Type Dates Main ions Main characteristics
SE1
1888.5; 1891.3; 1894.7; 1897.7; 1901.1; 1956.4
Na+, Cl-, Mg2+, Ca2+,NH 4
+, K+,
HCOO-, H
3CCOO
-Sea salt and mineral dust inputs, associated with low acidity and low marine biogenic activity, in winter.
SE2
1896.5; 1933.4; 1943.4; 1950.8; 1968.8; 1971.8
H3CSO3-, Na+, Cl-, Mg2+, K+, HCOO- H
3CCOO
-, Ca2+
Sea salt inputs, associated with high marine biogenic activity from lower latitudes, in winter. Low correlation between H3CSO3- and nssSO
4
2- indicates other geographical sources of H3CSO3-.
SE3 1908.0; 1978.0
H3CSO3-, Na+, Cl-, Mg2+, K+, HCOO- H
3CCOO
-, Ca2+,
nssSO42-, SO 4
2-.
Sea salt inputs, associated with high marine biogenic activity, in winter.
SE4 1905.0; 1975.0; 1976.0
H3CSO3-, nssSO 4
2-, SO
4
2-,
NH4+
Exceptionally high marine biogenic activity, without sea salt inputs, in summer.
SE5 1885.0; 1964.2; 1992.1
nssSO42-, SO 4
2-, NO
3
-and
H3CSO3- with negative correlation
Volcanic signal moderate to strong, marked for a duration of 1 to 3 years with increases in winter minima
and gradual decreases in intensity.
SE6 1959.4; 1986.3;
1988.6; 2003.6 Ca2+,K+, NH4 +
Significant inputs of mineral dust, low acidity and low marine biogenic activity, in winter. Lower magnitude events in relation to type SE1. in several higher NH4+ peaks that correspond with HCOO-,
Ca2+ and K+ and conversely with acidity. The background concentrations of NH4+ suffered significant reductions in some periods (see Fig. 5), to amounts close to the method detection limit, and are unexplained to date.
Organic carboxylic acids such as H3CCOO-, HCOO -and C2O42- do not exhibit significant seasonality, although they are essentially products of photochemical activity. The random variability suggests a higher complexity of formation processes in the atmosphere, also considered by Keene and Galloway (1988). The correspondence of the highest peaks is visible between these three profiles; they have different response sensitivities, but, apparently, concentration decreases with increasing molecular chain. They are well marked in SE1-type events; H3CCOO- and HCOO- are especially important for SE2-type events; and SE6-type events are mainly marked by HCOO-. They are products of photochemical activity in the atmosphere in gaseous form and in aerosols, largely found in clouds and precipitation. Their sources within Antarctica are mainly hydrocarbons (basically CH4) in the gas phase and in trace amounts (Legrand & De Angelis 1995, Legrand & Saigne 1988). Profiles with low seasonal sensitivity, such as these carboxylic acids, can be useful to study time series anoma-lies of precursor molecules and help to distinguish extreme climatic events.
Ionic content provenance
Quantitative criteria were used to decompose the ions in estimated major source fractions.Na+, Mg2+, K+, Ca2+,
Cl- and SO 4
2- were first decomposed according the same
common source: sea salt aerosol, following the Dickson and Goyet (1994) ion proportions in the calculation of “ss” (sea salt) fractions. Sea salt Na+ was used as the quantification parameter, because this source is implied in almost 100% of Na+ found in polar ice cores and because of its conserva-tive properties, according to Kreutz and Koffmann (2013). In this work, we estimate ssNa+, which represents approxi-mately 96% of the total Na+ measured, by discounting the samples from the measured Na+ profile that have lower rates than 1.8 in the Cl-/Na+ time profile, assuming from other correlations (e.g., Mg2+/Na+ and Cl-/K+) that these samples contain significant amounts of Na+ from different sources during strong input events.
The results indicate that approximately 51% of Mg2+ content, 27% of Ca2+, 47% of K+, 86% of Cl- and 15% of SO42- measured are from sea salt aerosols, which represents approximately 36% of the total ionic load present during the 1882–2008 A.D. period. In winter, sea salt aerosols are mainly formed by suspension of brine and frost flowers parti-cles over the sea ice cover. Frost flowers are delicate ice crystals rich in salts from precipitation of supersaturated water vapor, with gradual cooling, salinity and crystallization increase. Covering extensive parts of the sea surface, it is a signifi-cant source of bulk saline to the atmosphere (Alvarez-Aviles
The calculated non-sea-salt fractions of Mg2+ (49%), Ca2+ (73%) and K+ (53%) contents are associated with mineral dust sources, which probably have as counter ions a mixture of oxy-hydroxides, aluminosilicates and carbonates, consid-ering that none of the dissolved mineral dust aerosols con-sist of irregular particles containing clay minerals, quartz, carbonates, feldspars, sulphates and oxides (Cwiertny et al. 2008). We also observe a high correspondence between SE1- or SE6-type events and high NH4+ peaks, which suggests terrestrial dust as an important source of exNH4+ (compo-nent of non-seasonal NH4+ variation).
Dust particles play an important role as modifiers of the chemical composition of the atmosphere, through water adsorption mechanisms and the formation of deliquescent layers around them, thereby creating in clouds a humid and reactive environment for trace acid gases, mainly H2SO4 and HNO3 (Cwiertny et al. 2008). Regarding the insoluble fraction, Cataldo et al. (2013) show that 53% of the total identified particles found within an ice core collected at the same site have Si, Al, Fe and Ti as main components and diameters between 1 and 3 µm, compatible with particle sizes transported for long distances. According to Li et al. (2008), the main sources of mineral dust deposited in the Austral Ocean and Antarctica are quantitatively Australia and South America. Modelling realized by Li et al. (2010) reveals that the origin of dust transport from South America to West Antarctica is mainly the Patagonian semi-desert domain. The meridional fluxes of air masses tend to enter the Antarctic continent, from the west, by travelling over the Antarctic Peninsula and the Ellsworth Lands and, from the east, between Dronning Maud Land andPrincess Elizabeth Land. Therefore, Mount Johns receives air-mass incursions from west and east, according to the flow lines proposed by Parish and Bromwich (2007).
For time series that show clear summer maxima (NH4+, nssSO42- and NO
3
-), we adopted an empirical and practical
criterion to decompose them into two ion sources. The stan-dard deviation (σ) in the period (Tab. 1) was considered
as representative of the mean seasonal variability and was directly used as an estimation of seasonal contribution for the content of each ion. In this way, the exNH4+ contribution was estimated to be approximately 18% of total NH4+, and, together with nssMg2+, nssCa2+ and nssK+, these mineral dust indicators are responsible for 13% of the total ionic load.
The nssSO42- fraction has a clear seasonal component “s”(sSO42-) that was estimated as 64% of the total SO
4 2-. It is
mainly associated with biogenic marine activity, in acid form, by the production of SO42- as a subproduct of dimethyl sul-phide (DMS). Dimethyl sulphide originates from decompo-sition of dimethyl sulphoniopropionate (DMSP), excreted by living planktonic algae. The regions of the oceans with
higher incidence of light and temperatures have higher DMS emission rates to the atmosphere. DMS also accounts for the entire production of H3CSO3-, and, therefore, H3CSO3- is considered an unambiguous indicator of marine biogenic production (Seinfeld & Pandis 2016). The nssSO42- inputs from volcanic and biogenic sources through the lower strato-sphere and upper tropostrato-sphere (Delmas et al. 1982, Legrand 1997) from extra-polar regions also increase in austral sum-mers (due to the weakening of the polar vortex in spring; Thompson & Solomon 2002). Anthropogenic sources are considered negligible by Shaw (1982) andLegrand and Mayewski (1997), which makes Antarctica a useful environ-ment to observe the natural variation of SO42- (Dixon et al. 2004, Pruett et al. 2004). Among the natural exSO42- sources are volcanic eruptions (direct release of SO2) and secondary aerosols formed by oxidation of precursor gases such as SO2 in the troposphere and the stratosphere (Delmas et al. 1982, Legrand & Mayewski 1997, Dixon et al. 2004). The exSO4 2-is 21% of the total SO42- and represents mainly the back-ground concentration on regional and hemispheric scales.
The natural sources of NO3- in the atmosphere are ter-restrial, basically NH4+ oxidation, biomass burning, soils exhalation and lightning, but Wolff (2013) considers that the main source in polar regions is the formation of sec-ondary aerosols by the photochemical action of NOx gases. Re-evaporation of NO3- and NO
x already stocked on the upper layers of the snowpack makes it difficult to interpret over time, especially in sites with low accumulation rates. Its concentration is a combination of the availability of NOx precursor gases with the atmospheric oxidation capacity. The hydroxyl radical (OH-) is the most active molecule that pro-motes oxidation reactions, which, in turn, influence the resi-dence time of chemical species in trace amounts (Seinfeld & Pandis 2016). Both NO3- components (sNO
3
- and exNO 3
-)
participate actively in secondary aerosol formation and interact with particulate aerosols in the atmosphere; they are subsequently deposited on the snowpack by dry and wet scavenging mechanisms (Wolff 2013).
Median NO3- input is high and corresponds to 32% of the total anionic load. To decompose NO3-, we consider sea salt provenance insignificant (following Dickson & Goyet 1994), and the nature of NO3- sources is not quantified since the formation processes are complex and from multiple sources. However, it is possible to estimate the overall contribution exclusively from seasonal variation (sNO3-), produced by photochemical activity, which represents 36% of all NO3 -quantified and present in the atmosphere mainly in acid, gas and dissolved forms. The excess of NO3- (exNO
3 -) is
in the dechlorinating process of ssCl- (Legrand & Delmas 1988). Cwiertny et al. (2008) point out that mineral dust has a catalytic effect on NO3- production in the atmo-sphere, and the Mount Johns record also shows an asso-ciation between NO3- increases and events of high input of mineral dust, identified as exNH4+ and nssCa2+ in the NH4+ and Ca2+ profiles.
Other sources associated with the formation of second-ary aerosols, which depend on the atmosphere’s oxidative reactivity with the presence of trace gas precursors, consti-tute 34% of the quantified ion load. Figure 6 shows the main ion species measured in this work, their contribution fractions in the ionic balance and some profile components associated with provenance sources.
The free acidity was calculated by the difference between
Σ cations and Σ anions, and presuming electrical neutrality.
It corresponds to a fraction of approximately 40% of the total anionic load (2,49 µeq L-1). This calculated acidity is considered a minimum and is assumed not to exceed 49%. The extra 9% can be attributed to the overall diverse anionic load contribution, especially derived from mineral dust, and is here estimated by nssMg2+ plus nssCa2+ (assuming they are a feasible counter-ion mean of a diverse anionic load contribution). The free acidity was also calculated for each sample, generating an acidity time profile that was correlated with other variables for assessment. The acidity profile has clear summer maxima, explained by summer contributions
of H3CSO3-, sSO 4
2- and sNO 3
-, and slightly attenuated by
biogenic sNH4+ production, with the positive charge com-peting with H+ in the ion balance. The light chain carbox-ylic acids represent 12% of the free acidity, while marine biogenic activity effect (H3CSO3- + sSO
4 2- - sNH
4
+) should
not exceed 16%. Other sources associated with secondary aerosols by photolytic action of trace gases, reactions with ion adsorption in particles, dechlorinating of sea salt aero-sols, re-evaporation of deposits of NOx and NO3-, aerosols transported for long distances in the upper troposphere, or even deposited from the stratosphere, complete the rest of the bulk acidity (72%). They are mostly HNO3, H2SO4 and HCl, already recognized by Delmas and Gravenhorst (1982), Legrand (1987) and others, as the main constitu-ents of the acidity found in Antarctic ice cores.
The participation of CO32- in the ionic balance is not considered in this paper, as its contribution is not signifi-cant. It is a weak acid and therefore suffers variable and par-tial dissociation, which also brings methodological difficul-ties to its evaluation. However, it is feasible to consider the nssCa2+ component as an indicator of the maximum CO
3
2-contribution from mineral dust and to assume that terres-trial sources of CO32- do not exceed the nssCa2+ (3%) over the anionic load. They occur predominantly linked (such as CaCO3nH2O) in mineral structures, for example, as calcite (n=0), monohydrocalcite (n=1) or ikaite (n=6), as suggested by Sala et al. (2008).
Figure 6. Characterization of the ionic content found in the Mount Johns ice core (central West Antarctica). (A) Detailed ionic balance. (B) Ionic decomposition based on sea salt fractions, standard deviations and medians of time series, and major provenance interpretation.
CONCLUSIONS
The basic statistics for our Mount Johns core correspond with values published for West Antarctica by authors, such as Bertler et al. (2005) and Dixon et al. (2011). However, the interpretation approach differs from other papers, whereas we present here a more detailed averaged ionic balance and decomposition of the chemistry species that, in turn, was based on stratigraphic profiles standard deviations for sea-sonality estimation, calculated sea salt fractions and major provenance interpretation according to the literature. We also identify main “significant events” of ionic load input consid-ering the highest concentration peaks and their durations. They were grouped in six types of chemistry and provenance characteristics that were associated with periods of excep-tional climatic conditions, such as: sea salt and mineral dust intake associated with low acidity and low marine biogenic activity in winter (SE1-type); sea salt and high marine bio-genic activity (SE3-type) or from lower latitudes (SE2-type) in winter; exceptionally high marine biogenic activity in summer (SE4-type); volcanic signals (SE5-type); and high inputs of mineral dust (without sea salt) associated with low acidity and low marine biogenic activity in winter.
The understanding of the origin (transport and for-mation) of the aerosols found in the region is the main result of this interpretation work based in ion content. Moreover, it is useful for the improvement of climate modelling on the region in future studies. The use of this past atmosphere chemical information for this purpose is the main future objective in the study of the central WAIS region by our group.
In addition, western Antarctica has been experiencing not negligible climate changes in recent decades. The results here presented are useful as a tool to better understand regional air masses patterns that, in turn, subsidize the future study about regional climate changes.
ACKNOWLEDGEMENTS
This research is part of the Brazilian Antarctic Programme (PROANTAR) and was funded from the Brazilian National Council for Scientific and Technological Development (CNPq), project 407888/2013-6. The authors are grateful for the participation in fieldwork of colleagues Luiz Fernando M. Reis, Francisco Eliseu Aquino and Marcelo Arevalo.
Alvarez-Aviles L., Simpson W.R., Douglas T.A., Sturm M., Perovich D.,
Domine F. 2008. Frost flower chemical composition during growth
and its implications for aerosol production and bromine activation.
Journal of Geophysical Research, 113(D21304):1-10.https://doi.
org/10.1029/2008JD010277
Bamber J.L., Gomez-Dans J.L., Griggs J.A. 2009. Antarctic 1 km Digital
Elevation Model (DEM) from Combined ERS-1 Radar and ICESat Laser
Satellite Altimetry. Version 1. Boulder, Colorado: National Snow and
Ice Data Center. Available at: <http://nsidc.org/data/>. Accessed on: February 6, 2014.
Barwick V.J.(Ed.) 2003. Preparation of Calibration Curves - A Guide to Best Practice. National Measurement System Valid Analytical Measurement (VAM) Programme.
Bertler N., Mayewski P.A., Aristarain A., Barrett P., Becagli S., Bernardo R., Bo S., Xiao C., Curran M., Qin D., Dixon D., Ferron F., Fischer H., Frey M., Frezzotti M., Fundel F., Genthon C., Gragnani R., Hamilton G., Handley M, Hong S., Isaksson E., Kang J., Ren J., Kamiyama K., Kanamori S., Kärkäs E., Karlöf L., Kaspari S., Kreutz K., Kurbatov A., Meyerson E., Ming Y., Zhang M., Motoyama H., Mulvaney R., Oerter H., Osterberg E., Proposito M., Pyne A., Ruth U., Simões J., Smith B., Sneed S., Teinilä K., Traufetter F., Udisti R., Virkkula A., Watanabe O.,
Williamson B., Winther J-G., Li Y., Wolff E., Li Z., Zielinski A. 2005.
Snow chemistry across Antarctica. Annals of Glaciology, 41 (1):167-179.https://doi.org/10.3189/172756405781813320
Bromwich D.H., Nicolas J.P., Monaghan A.J., Lazzara M.A., Keller L.M., Weidner G.A., Wilson A.B. 2012. Central West Antarctica among the most rapidly warming regions on Earth. Nature Geoscience, 6:139-145.https://doi.org/10.1038/ngeo1671
Cataldo M., Evangelista H., Simões J.C., Godoi R.H.M., Simmonds I., Hollanda M.H., Wainer I., Aquino F., Van Grieken R. 2013. Mineral dust variability in central West Antarctica associated with ozone depletion. Atmospheric Chemistry and Physics, 13:2165-2175. https://doi.org/10.5194/acp-13-2165-2013
Cwiertny D.M., Young M.A., Grassian V.H. 2008. Chemistry and
Photochemistry of Mineral Dust Aerosol. Annual Review of
Physical Chemistry, 59:27-51. https://doi.org/10.1146/annurev.
physchem.59.032607.093630
Delmas R., Briat M., Legrand M. 1982. Chemistry of South Polar Snow. Journal of Geophysical Research, 87(C6):4314-4318.https:// doi.org/10.1029/JC087iC06p04314
Delmas R., Gravenhorst G. 1982. Background Precipitation Acidity. In: Beilke S., Elshout A.J. (Eds.), Acid Deposition. Berlin, D. Reidel, p. 82-107.
Dickson A.G., Goyet C. (Eds.). 1994. DOE Handbook of methods for the analysis of the various parameters of the carbon dioxide system
in sea water.United States: U. S. Department of Energy: ORNL/
CDIAC-74, p.1-22.
Dixon D., Mayewski P.A., Kaspari S., Sneed S., Handley M. 2004. A 200 year sub-annual record of sulfate in West Antarctica from 16 ice cores. Annals of Glaciology, 39(1):545-556.https://doi. org/10.3189/172756404781814113
Dixon D.A., Mayewski P.A., Korotkikh E., Sneed S.B., Handley M.J., Introne D.S., Scambos T.A. 2011. A spatial framework for assessing current conditions and monitoring future change in the chemistry of the Antarctic atmosphere. The Cryosphere Discussions, 5:885-950. https://doi.org/10.5194/tcd-5-885-2011
Jacob D.J, Andreae M.O., Bigg E.K., Duce R.A., Fung I., Hidy G.M., Legrand M., Prospero J.M., Raes F., Warren S.G., Wiedensohler A.
1995. Group report: what factors influence atmospheric aerosols,
how have they changed in the past, and how might they change in the future. In: Charlson R.J., Heintzenberg J. (Eds.), Aerosol forcing of
climate. New York, Wiley, p.183-195.
Kaspari S., Mayewski P.A., Dixon D.A., Spikes V.B., Sneed S.B., Handley M.J., Hamilton G.S. 2004. Climate variability in West Antarctica derived from annual accumulation-rate records from
ITASE firn/ice cores. Annals of Glaciology, 39:585-594.https://doi. org/10.3189/172756404781814447
Keene W.C., Galloway J.N. 1988. The biogeochemical cycling of formic and acetic acids through the troposphere: an overview
of current understanding. Tellus,40(B):322-334.https://doi.
org/10.1111/j.1600-0889.1988.tb00106.x
Kreutz K.J., Koffman B.G. 2013. Glaciochemistry. In: Elias S.A. (Ed.).
Encyclopedia of Quaternary Science, 2. Amsterdam, Elsevier, p. 326-333.
Legrand M. 1987. Chemistry of Antarctic snow and ice. Journal de
Physique, 48(3):C1-77–C1-86.https://doi.org/10.1051/jphyscol:1987111
Legrand M. 1997. Ice-core records of atmospheric sulphur.
Philosophical Transactions of the Royal Society B,
352(1350):241-250. https://doi.org/10.1098/rstb.1997.0019
Legrand M., De Angelis M. 1995. Origins and variations
of light carboxylic acids in polar precipitation. Journal of
Geophysical Research: Atmospheres, 100(D1):1445-62. https://
doi.org/10.1029/94JD02614
Legrand M., Delmas R.J. 1988. Formation of HCl in the Antarctic Atmosphere. Journal of Geophysical Research, 93(D6):7153-7168. https://doi.org/10.1029/JD093iD06p07153
Legrand M., Mayweski P. 1997. Glaciochemistry of polar ice cores: a review. Reviews of Geophysics, 35(3):219-243.https://doi. org/10.1029/96RG03527
Legrand M., Saigne C. 1988. formate, acetate and methanesulfonate measurements in Antarctic ice: Some Geochemical Implications.
Atmospheric Environment, 22(5):1011-1017.https://doi.
org/10.1016/0004-6981(88)90278-8
Li F., Ginoux P., Ramaswamy V. 2008. Distribution, transport, and deposition of mineral dust in the Southern Ocean and Antarctica: Contribution of major sources. Journal of Geophysical Research,
113(D10):1-15.https://doi.org/10.1029/2007JD009190
Li F., Ginoux P., Ramaswamy V. 2010. Transport of Patagonian dust to Antarctica. Journal of Geophysical Research, 115(D18):1-9.https:// doi.org/10.1029/2009JD012356
Mayewski P., Frezzotti M., Bertler N., Van Ommen T., Hamilton G., Jacka T.H., Welch B., Frey M., Qin D., Ren J., Simões J.C., Fily M., Oerter H., Nishio F., Isaksson E., Mulvaney R., Holmund P., Lipenkov
V., Goodwin I. 2005. The International Trans-Antarctic Scientific
Expedition (ITASE): an overview. Annals of Glaciology,41(1):180-185. https://doi.org/10.3189/172756405781813159
Osterberg E.C., Handley M.J., Sneed S.B., Mayewski P.A., Kreutz K.J. 2006. Continuous ice core melter system with discrete sampling for major ion, trace element, and stable isotope analyses. Environmental Science
and Technology, 40(10):3355-3361.https://doi.org/10.1021/es052536w
Parish T.R., Bromwich D.H. 2007. Re-examination of the
Near-Surface Airflow over the Antarctic Continent and Implications on
Atmospheric Circulations at High Southern Latitudes. American
Meteorological Society, 135(5):1961-1973. https://doi.org/10.1175/
MWR3374.1
Pruett L.E., Kreutz K.J, Wadleigh M., Mayewski P.A., Kurbatov A. 2004. Sulfur isotopic measurements from a West Antarctic ice core: implications for sulphate source and transport. Annals of Glaciology,
39:161-168.https://doi.org/10.3189/172756404781814339
Rignot E., Mouginot J., Scheuchl B. 2011. Ice Flow of the Antarctic Ice Sheet. Science, 333(6048):1427-1430. https://doi.org/10.1126/ science.1208336
Sala M., Delmonte B., Frezzotti M., Proposito M., Scarchilli C., Maggi V., Artioli G., Dapiaggi M., Marino F., Ricci P.C., De Giudici G. 2008. Evidence of calcium carbonates in coastal (Talos Dome and
Ross Sea area) East Antarctica snow and firn: Environmental and
climatic implications. Earth and Planetary Science Letters, 271:43-52. http://ib.adnxs.com/seg?add=1&redir=http%3A%2F%2Fdx.doi. org%2F10.1016%2Fj.epsl.2008.03.045
Schwanck F., Simões J.C., Handley M., Mayewski P.A., Bernardo R.T., Aquino F.E. 2016a. Anomalously high arsenic concentration in a West Antarctic ice core and its relationship to copper mining in Chile. Atmospheric Environment, 125(A):257-264.https://doi. org/10.1016/j.atmosenv.2015.11.027
Schwanck F., Simões J.C., Handley M., Mayewski P.A., Bernardo R.T.,
Aquino F.E. 2016b. Drilling, processing and first results for Mount Johns
ice core in West Antarctica Ice Sheet. Brazilian Journal of Geology,
46(1):29-40. http://dx.doi.org/10.1590/2317-4889201620150035
Scientific Committee on Antarctic Research (SCAR). Antarctic Digital
Database (ADD). Available at: <http://www.scar.org/data-products/
add>. Accessed on: August 7, 2012.
Seinfeld J.H., Pandis S.N. 2016. Atmospheric Chemistry and Physics:
From Air Pollution to Climate Change. New York, Wiley, 1120 p.
Shaw G.E. 1982. On the residence time of the Antarctic ice sheet sulfate aerosol. Journal of Geophysical Research, 87(C6):4309-4313. https://doi.org/10.1029/JC087iC06p04309
Steig E.J., Mayewski P.A., Dixon D.A., Kaspari S.D., Frey M.M., Schneider D.P., Arcone S.A., Hamilton G.S., Spikes V.B., Albert M., Meese D., Gow A.J., Shuman C.A., White J.W.C., Sneed S., Joseph F., Wunkes M. 2005. High-resolution ice cores from US ITASE (West Antarctica): development and validation of chronologies and determination of precision and accuracy. Annals of Glaciology, 41:77-84.https://doi. org/10.3189/172756405781813311
Steig E.J., Schneider D.P., Rutherford S.D., Mann M.E., Comiso J.C., Shindell D.T. 2009. Warming of the Antarctic ice-sheet surface since
the 1957 International Geophysical Year. Nature, 457:459-462.
https://doi.org/10.1038/nature07669
Thompson D.W.J., Solomon S. 2002. Interpretation of recent Southern Hemisphere climate change, Science, 296:895-899.https:// doi.org/10.1126/science.1069270
Wolff E.W. 2013. Ice sheets and nitrogen. Philosophical
Transactions of the Royal Society B, 368:1-9.https://doi.
org/10.1098/rstb.2013.0127