iii
Junho, 2018
Ana Filipa Mendes Cristóvão
Licenciatura em Ciências de Engenharia Biomédica
3D Printing of Biocompatible Materials for
Biomedical Applications
Dissertação para obtenção do Grau de Mestre em Engenharia Biomédica
Orientador: Isabel Ferreira, Professora Associada, DCM-FCT/UNL
Coorientador: Ana Baptista, Investigadora Pós-Doutoramento, DCM-FCT/UNL
Júri:
Presidente: Prof. Doutora Carla Maria Quintão Pereira, Professora Auxiliar, FCT/UNL
Arguentes: Prof. Doutor Carlos Baleizão, Professor Auxiliar, DEQ – IST/UL
3D Printing of Biocompatible Materials for Biomedical Applications
Copyright © Ana Filipa Mendes Cristóvão, Faculdade de Ciências e Tecnologia, Universidade Nova de Lisboa.
v
vii
Acknowledgements
Gostaria, em primeiro lugar, de agradecer profundamente à minha orientadora, Professora Doutora Isabel Ferreira pela disponibilidade e incentivo durante todo o período da dissertação.
Agradeço também à minha coorientadora, Doutora Ana Baptista, pela disponibilidade, ca-rinho e apoio disponibilizado a todo o momento.
À Professora Célia Henriques e ao Professor Alexandre Velhinho, por terem ajudado a valorizar este trabalho. O vosso contributo e conhecimento foi essencial.
Aos colegas de laboratório, sem os quais teria sido impossível desenvolver este trabalho. Pelo conhecimento partilhado, a entreajuda, as ideias brilhantes e a capacidade de resolver todo e qualquer problema.
Aos meus pais, pela motivação e por todas as oportunidades que me deram ao longo da vida. Pelo apoio incondicional e a confiança nas minhas capacidades.
Ao Rômulo, pelo amor incondicional, por me ajudar a ver a luz ao fundo do túnel e por toda a felicidade que me trouxe. Obrigada por teres dado o primeiro passo.
À minha Avó que, apesar de já não estar entre nós, continua no meu coração. Penso sempre no quanto gostava que pudesses ver o quanto cresci. Espero que estejas orgulhosa.
Aos amigos da faculdade, à Tabby por me ter trazido a melhor pessoa da minha vida, sem ti seria uma criança infeliz; às miguitas de sempre e para sempre: Anayza; Joana; Dalila; Daniela e Jéssica. Todo o vosso apoio e encorajamento é precioso.
ix
Abstract
In this work, we develop and test materials to be used in a 3D printed prosthesis, made
according to each patients’ anatomy. These must be biocompatible, flexible and maintain airway
permeability. Different polymeric materials based on PEGDA (polymer) and B2VT (photoinitia-tor) were studied, each with either PVA or SA and CaSO4. These hydrogels were crosslinked with UV light, one while printing by extrusion and the other after being deposited in casts.
A systematic study was performed on the influence of laser power in in-situ reticulation and 3D printing of an SA and PEGDA/B2VT mixture, by testing their compression mechanical properties. This study was compared to samples with PVA, reticulated with UV light after 3D printing and the difference in terms of mechanical properties is enormous. First shows Young’s Modulus in the range of 4-6 MPa and the second in the range of 0.8-1 MPa.
The results lead to the conclusion that higher percentages of PVA and B2VT increase the value of E and that the use of Alginate creates a material with a compression curve typical of foams.
xi
Resumo
Neste trabalho desenvolvemos e testámos materiais a ser usados numa prótese tridimensi-onal, impressa de acordo com a anatomia de cada paciente. Estes devem ser biocompatíveis, fle-xíveis e manter a permeabilidade das vias aéreas. Foram estudados dois tipos materiais poliméri-cos diferentes com base no polímero PEGDA e no fotoiniciador B2VT, utilizando PVA ou SA com CaSO4. Estes hidrogéis foram reticulados com luz UV, um aquando da impressão tridimen-sional por extrusão e o outro depois de depositado em moldes.
Foi realizado um estudo sistemático sobre a influência da potência do laser aquando da impressão 3D e reticulação in-situ de uma mistura com SA e PEGDA/B2VT, recorrendo a testes de compressão para obter as propriedades mecânicas do material. Este estudo foi comparado com amostras com PVA, reticuladas com luz UV após impressão 3D. A diferença em termos de pro-priedades mecânicas é significativa, tendo o primeiro material um Módulo de Young num inter-valo de 4 a 6 MPa e o segundo entre 0,8 e 1 MPa.
Os resultados obtidos mostram que maiores percentagens de PVA e B2VT aumentam o valor de E e que o uso de Alginato cria um material com uma curva de compressão típica de espumas.
xiii
CONTENTS
AKNOWLEGMENTS ... VII
ABSTRACT ... IX
RESUMO ... XI
LIST OF FIGURES ... XV
LIST OF TABLES ... XIX
LIST OF ABBREVIATIONS, ACRONYMS AND SYMBOLS ... XXI
1
INTRODUCTION ... 1
2
STATE OF THE ART ... 3
3
MATERIALS AND METHODS ... 13
4
RESULT ANALYSIS AND DISCUSSION ... 23
5
CONCLUSIONS ... 49
BIBLIOGRAPHY ... 51
xv
List of Figures
FIGURE 1.1–SILICONE AIRWAY STENTS:(A)MONTGOMERY’S T-TUBE STENT;(B)Y-TUBE STENT; AND (C)DUMON TYPE STENT [6] ... 4 FIGURE 1.2–SELF-EXPANDING STENTS:(A)METALLIC UNCOATED STENT (ULTRAFLEX);(B)METALLIC COATED
STENT (ULTRAFLEX); AND (C)REINFORCED SILICONE STENT (POLYFLEX)[7] ... 4
FIGURE 3.1–EXAMPLE OF A PVA REACTION WHERE THE TEMPERATURE, POWER, AND PRESSURE ARE SHOWN
DURING THE REACTION PERIOD 14
FIGURE 3.2-EMISSION SPECTRA OF UV LAMP USED TO RETICULATE D TYPE SAMPLES 15 FIGURE 3.3-3D MODELS IN .STL FORMAT BASED ON THE PATIENT'S CT SCAN:(A) INITIAL MODEL RECEIVED;(B)
MODEL AFTER SOME MODIFICATIONS;(C) MODEL READY TO PRINT 16 FIGURE 3.4-3D MODELS IN .GCODE FORMAT WITH INTERCALATED LASER LAYERS:(A) VIEW FROM THE RIGHT;(B)
FRONT VIEW;(C) TOP VIEW 16
FIGURE 3.5–STRESS-STRAIN DIAGRAM [34]RETRIEVED 2APRIL 2018 18 FIGURE 3.6-TYPICAL COMPRESSION CURVE FOR FOAMS [35](LEFT) AND FOR POLYMERS [36](RIGHT)
RETRIEVED 2JUNE 2018 18
FIGURE 3.7– A)PVA BASED SAMPLES AFTER UV RETICULATION; B)RETICULATED PELLETS OF 21CB AND 21CD
MIXTURES; C)RETICULATED FILMS OF (C1)21CC1;(C2)21CC2 AND (C3)21E; D)RETICULATED FILMS OF 21DD AND 21DB(1) BEFORE AND (2) AFTER BEING SUBMERGED IN PBS 32
FIGURE 4.1–TESTING PLMC/PS SHAPE MEMORY PROPERTIES:(A)INITIAL SHAPE;(B)DEFORMED SHAPE;(C)
RECOVERED SHAPE 24
FIGURE 4.2–SAMPLES WITH DIFFERENT CONCENTRATIONS OF CASO4, 24 HOURS AFTER BEING 3D PRINTED – TOP VIEW:(A)0.06M,(B)0.08M AND (C)0.1M 25
FIGURE 4.3-EXAMPLES OF SOME OF THE SAMPLES PRINTED INCLUDING (A) SAMPLE 14,(B) SAMPLE 13,(C)
SAMPLE 5 AND (D) SAMPLE 1 27
xvi
FIGURE 4.5–HANDPRINTED SAMPLES C1A,C2A.C3A,C4A, AND C5A BEFORE (A) AND AFTER (B)UV
RETICULATION 28
FIGURE 4.6–3D PRINTED AND UV RETICULATED C5 SAMPLES PRINTED WITH 1,2,3 AND 4 LAYERS 29 FIGURE 4.7–EXAMPLES OF PRINTED SAMPLES FOR (A) COMPRESSION TESTING (10 X 10 X 10 MM) AND (B)(C)
TENSILE TESTING (10 X 30 X 2 MM) 30
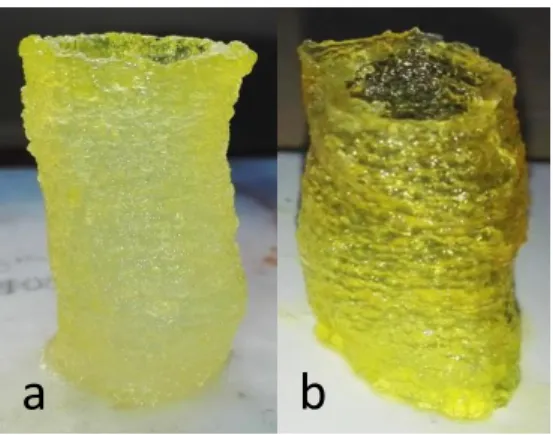
FIGURE 4.8-TRACHEAL SECTION 3D PRINTED WITH SIMULTANEOUS UV RETICULATION:(A) RIGHT AFTER
PRINTING (HEIGHT =38.5 MM, WIDTH =19.24 MM, THICKNESS =0.5 MM) AND (B) AFTER 72 HOURS 31 FIGURE 4.9–TRACHEAL SECTION 3D PRINTED AND IMMEDIATELY COATED WITH PVA 31 FIGURE 4.10–SAMPLES D5A(THICKNESS OF 1 MM);D5B(THICKNESS OF 7.5 MM), AND D5C(THICKNESS OF 4
MM) AFTER UV RETICULATION 34
FIGURE 4.11–EXAMPLES OF D3STRESS-STRAIN CURVES –TRACTION 35
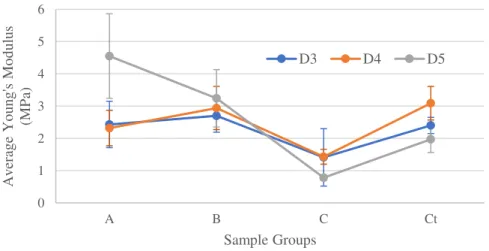
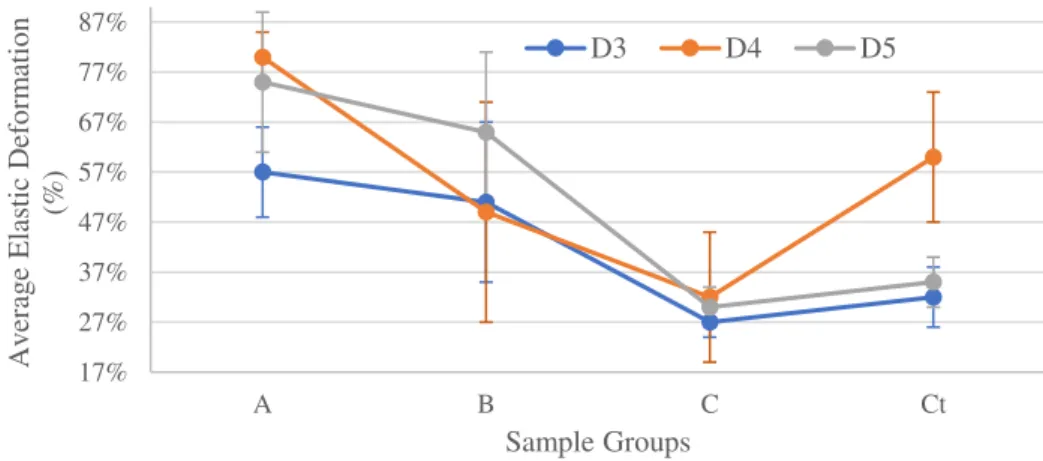
FIGURE 4.12–EXAMPLES OF D5STRESS-STRAIN CURVES –TRACTION 35 FIGURE 4.13-AVERAGE YOUNG’S MODULUS (MPA) FOR DSAMPLES -TRACTION 36 FIGURE 4.14-AVERAGE ELASTIC DEFORMATION (%) OF DSAMPLES –TRACTION 37 FIGURE 4.15-STRESS-STRAIN CURVES FOR PARALLEL COMPRESSION TESTS OF CUBES RETICULATED AT 941 MW
– FIRST SLOPE FOR EACH CURVE ON THE LEFT AXIS AND ORIGINAL CURVE FOR EACH SAMPLE ON THE RIGHT
AXIS 38
FIGURE 4.16–VARIATION OF: A)MAXIMUM FORCE (KG), B)MAXIMUM STRESS (MPA), C)YOUNG’S MODULUS
(MPA) AND D)SECOND SLOPE (MP) FOR PARALLEL AND PERPENDICULAR COMPRESSION TESTS FOR ALL
CUBES RETICULATED WITH UV LASER 40
FIGURE 4.17-AVERAGE MEASUREMENTS AFTER PERPENDICULAR COMPRESSION (%) OF EACH SAMPLE TYPE 41 FIGURE 4.18-AVERAGE MEASUREMENTS AFTER PARALLEL COMPRESSION (%) OF EACH SAMPLE TYPE 42 FIGURE 4.19-D5CC STRESS-STRAIN CURVES -COMPRESSION 42 FIGURE 4.20-D5CC SAMPLES WITH TWO PHASES AFTER UV RETICULATION 43 FIGURE 4.21-FTIR SPECTRA OF DLLA,TMC, AND PLMC 44 FIGURE 4.22-FTIR SPECTRA OF PVA,BAPO AND PEGDA/BAPO/PVA 45 FIGURE 4.23-UV-VIS ABSORPTION SPECTRA FOR PEGDA AND FOR THE MIXTURE PEGDA/SA 46 FIGURE 4.24-UV-VIS ABSORPTION SPECTRA FOR THE MIXTURES PEGDA/B2VT AND PEGDA/SA/B2VT 46 FIGURE 4.25-RELATIVE CELL VIABILITY OF SAMPLES C5B AND D5A 47 FIGURE 4.26-RELATIVE CELL VIABILITY OF SAMPLES C5A AND D5B 47
FIGURE A.1-D3ASTRESS-STRAIN CURVES -TRACTION ... 55
FIGURE 4.2-D3BSTRESS-STRAIN CURVES -TRACTION ... 56
FIGURE A.3-D3CSTRESS-STRAIN CURVES -TRACTION ... 57
FIGURE A.4-D3CT STRESS-STRAIN CURVES -TRACTION ... 58
FIGURE 4.5-D4ASTRESS-STRAIN CURVES -TRACTION ... 60
FIGURE A.6-D4BSTRESS-STRAIN CURVES -TRACTION ... 61
FIGURE A.7-D4CSTRESS-STRAIN CURVES -TRACTION ... 62
FIGURE A.8-D4CT STRESS-STRAIN CURVES -TRACTION ... 63
FIGURE A.9-D5ASTRESS-STRAIN CURVES -TRACTION ... 64
FIGURE A.10-D5BSTRESS-STRAIN CURVES -TRACTION ... 65
FIGURE A.11-D5CSTRESS-STRAIN CURVES –TRACTION ... 66
List of Figures
xvii
FIGURE B.1-STRESS-STRAIN CURVES FOR PERPENDICULAR COMPRESSION TESTS OF CUBES RETICULATED AT 470
MW– FIRST SLOPE FOR EACH CURVE ON THE LEFT AXIS AND ORIGINAL CURVE FOR EACH SAMPLE ON THE RIGHT AXIS ... 69 FIGURE B.2-THICKNESS VARIATION (MM) OF EACH AC30 SAMPLE RETICULATED AT 470 MW AND THEIR
AVERAGE THICKNESS, BEFORE AND AFTER PERPENDICULAR COMPRESSION ... 69 FIGURE B.3-STRESS-STRAIN CURVES FOR PARALLEL COMPRESSION TESTS OF CUBES RETICULATED AT 470 MW–
FIRST SLOPE FOR EACH CURVE ON THE LEFT AXIS AND ORIGINAL CURVE FOR EACH SAMPLE ON THE RIGHT AXIS
... 70 FIGURE B.4-THICKNESS VARIATION (MM) OF EACH AC30 SAMPLE RETICULATED AT 470 MW AND THEIR
AVERAGE THICKNESS, BEFORE AND AFTER PARALLEL COMPRESSION... 70 FIGURE B.5-STRESS-STRAIN CURVES FOR PERPENDICULAR COMPRESSION TESTS OF CUBES RETICULATED AT 627
MW– FIRST SLOPE FOR EACH CURVE ON THE LEFT AXIS AND ORIGINAL CURVE FOR EACH SAMPLE ON THE RIGHT AXIS ... 71 FIGURE B.6-THICKNESS VARIATION (MM) OF EACH AC40 SAMPLE RETICULATED AT 627 MW AND THEIR
AVERAGE THICKNESS, BEFORE AND AFTER PERPENDICULAR COMPRESSION ... 71 FIGURE B.7- STRESS-STRAIN CURVES FOR PARALLEL COMPRESSION TESTS OF CUBES RETICULATED AT 627 MW–
FIRST SLOPE FOR EACH CURVE ON THE LEFT AXIS AND ORIGINAL CURVE FOR EACH SAMPLE ON THE RIGHT AXIS
... 72 FIGURE B.8-THICKNESS VARIATION (MM) OF EACH AC40 SAMPLE RETICULATED AT 627 MW AND THEIR
AVERAGE THICKNESS, BEFORE AND AFTER PARALLEL COMPRESSION... 72
FIGURE B.9-STRESS-STRAIN CURVES FOR PERPENDICULAR COMPRESSION TESTS OF CUBES RETICULATED AT 784
MW– FIRST SLOPE FOR EACH CURVE ON THE LEFT AXIS AND ORIGINAL CURVE FOR EACH SAMPLE ON THE RIGHT AXIS ... 73 FIGURE B.10-THICKNESS VARIATION (MM) OF EACH AC50 SAMPLE RETICULATED AT 784 MW AND THEIR
AVERAGE THICKNESS, BEFORE AND AFTER PERPENDICULAR COMPRESSION ... 73 FIGURE B.11-STRESS-STRAIN CURVES FOR PARALLEL COMPRESSION TESTS OF CUBES RETICULATED AT 784 MW
– FIRST SLOPE FOR EACH CURVE ON THE LEFT AXIS AND ORIGINAL CURVE FOR EACH SAMPLE ON THE RIGHT AXIS ... 74 FIGURE B.12-THICKNESS VARIATION (MM) OF EACH AC50 SAMPLE RETICULATED AT 784 MW AND THEIR
AVERAGE THICKNESS, BEFORE AND AFTER PARALLEL COMPRESSION... 74 FIGURE B.13-STRESS/STRAIN CURVES FOR PERPENDICULAR COMPRESSION TESTS OF CUBES RETICULATED AT
941 MW– FIRST SLOPE FOR EACH CURVE ON THE LEFT AXIS AND ORIGINAL CURVE FOR EACH SAMPLE ON THE RIGHT AXIS ... 75 FIGURE B.14-THICKNESS VARIATION (MM) OF EACH AC60 SAMPLE RETICULATED AT 941 MW AND THEIR
AVERAGE THICKNESS, BEFORE AND AFTER PERPENDICULAR COMPRESSION ... 75 FIGURE B.15-STRESS-STRAIN CURVES FOR PARALLEL COMPRESSION TESTS OF CUBES RETICULATED AT 941 MW
– FIRST SLOPE FOR EACH CURVE ON THE LEFT AXIS AND ORIGINAL CURVE FOR EACH SAMPLE ON THE RIGHT AXIS ... 76 FIGURE B.16-THICKNESS VARIATION (MM) OF EACH AC60 SAMPLE RETICULATED AT 941 MW AND THEIR
AVERAGE THICKNESS, BEFORE AND AFTER PARALLEL COMPRESSION... 76 FIGURE B.17-STRESS-STRAIN CURVES FOR PERPENDICULAR COMPRESSION TESTS OF CUBES RETICULATED AT
xviii
FIGURE B.18-THICKNESS VARIATION (MM) OF EACH AC80 SAMPLE RETICULATED AT 1255 MW AND THEIR
AVERAGE THICKNESS, BEFORE AND AFTER PERPENDICULAR COMPRESSION ... 77 FIGURE B.19-STRESS-STRAIN CURVES FOR PARALLEL COMPRESSION TESTS OF CUBES RETICULATED AT 1255
MW– FIRST SLOPE FOR EACH CURVE ON THE LEFT AXIS AND ORIGINAL CURVE FOR EACH SAMPLE ON THE RIGHT AXIS ... 78 FIGURE B.20-THICKNESS VARIATION (MM) OF EACH AC80 SAMPLE RETICULATED AT 1255 MW AND THEIR
AVERAGE THICKNESS, BEFORE AND AFTER PARALLEL COMPRESSION ... 78 FIGURE B.21-STRESS-STRAIN CURVES FOR PERPENDICULAR COMPRESSION TESTS OF CUBES RETICULATED AT
1569 MW– FIRST SLOPE FOR EACH CURVE ON THE LEFT AXIS AND ORIGINAL CURVE FOR EACH SAMPLE ON THE RIGHT AXIS ... 79 FIGURE B.22-THICKNESS VARIATION (MM) OF EACH AC100 SAMPLE RETICULATED AT 1569 MW AND THEIR
AVERAGE THICKNESS, BEFORE AND AFTER PERPENDICULAR COMPRESSION ... 79 FIGURE B.23-STRESS-STRAIN CURVES FOR PARALLEL COMPRESSION TESTS OF CUBES RETICULATED AT 1569
MW– FIRST SLOPE FOR EACH CURVE ON THE LEFT AXIS AND ORIGINAL CURVE FOR EACH SAMPLE ON THE RIGHT AXIS ... 80
FIGURE B.24-THICKNESS VARIATION (MM) OF EACH AC80 SAMPLE RETICULATED AT 1255 MW AND THEIR
xix
List of Tables
TABLE 3.1-REAGENTS USED IN THE PROTOCOLS PERFORMED AND RESPECTIVE VARIATIONS ... 13
TABLE 3.2–G-CODE VALUES AND CORRESPONDING LASER POWER ... 17
TABLE 3.3- PLATE PREPARATION FOR THE FIRST CYTOTOXICITY TEST ... 22
TABLE 3.4–PLATE PREPARATIONS FOR THE SECOND CYTOTOXICITY TEST ... 22
TABLE 4.1-DIFFERENT CONCENTRATIONS OF BAPO TESTED:2MLPEGDA(28.57%) AND 2MLSA(5%) ... 26
TABLE 4.2–POLYMER MIXTURE B;PARAMETERS VARIED WITH PEGDA34.78%(2.25ML);SA(5%) ... 28
TABLE 4.3–POLYMER MIXTURE B, CHANGE OF COMPONENTS RATIO (CASO4+H2O(ML):0.0108 G +1) ... 29
TABLE 4.4-COMPOSITION OF POLYMERIC MIXTURES C ... 32
TABLE 4.5–COMPOSITION OF POLYMERIC MIXTURES D:2 MLPEGDA(34.78% V/V)... 33
TABLE 4.6-AVERAGE MECHANICAL PROPERTIES OF D SAMPLES ... 36
TABLE 4.7-COMPARING THE AVERAGE VALUES OF YOUNG’S MODULUS FOR PARALLEL AND PERPENDICULAR COMPRESSION TESTS FOR CUBES RETICULATED WITH UV LASER AT DIFFERENT POWERS. ... 39
TABLE 4.8-MECHANICAL PROPERTIES OF EACH D5CC SAMPLE ... 43
TABLE A.1-MECHANICAL PROPERTIES OF EACH D3A SAMPLE ... 56
TABLE A.2-MECHANICAL PROPERTIES OF EACH D3B SAMPLE ... 57
TABLE A.3-MECHANICAL PROPERTIES OF EACH D3C SAMPLE ... 58
TABLE A.4-MECHANICAL PROPERTIES OF EACH D3CT SAMPLE ... 59
TABLE A.5-AVERAGE MECHANICAL PROPERTIES OF D3 SAMPLES ... 59
TABLE A.6-MECHANICAL PROPERTIES OF EACH D4A SAMPLE ... 60
TABLE A.7-MECHANICAL PROPERTIES OF EACH D4B SAMPLE ... 61
TABLE A.8-MECHANICAL PROPERTIES OF EACH D4C SAMPLE ... 62
TABLE 4.9-MECHANICAL PROPERTIES OF EACH D4CT SAMPLE ... 63
TABLE A.10-AVERAGE MECHANICAL PROPERTIES OF D4 SAMPLES ... 64
TABLE A.11-MECHANICAL PROPERTIES OF EACH D5A SAMPLE ... 65
TABLE A.12-MECHANICAL PROPERTIES OF EACH D5B SAMPLE ... 66
TABLE A.13-MECHANICAL PROPERTIES OF EACH D5C SAMPLE ... 67
xxi
List of Abbreviations, Acronyms and Symbols
% Percentage
3D Three-dimensional
A Samples Cross-Section
B2VT RF with TEOHA solution
BAPO Phenylbis (2.4.6-trimethylbenzoyl) phosphine oxide CaSO4 Calcium Sulphate
CMC Cell-Mediated Control
CT Computed Tomography
DLLA D. L-Lactide
DMEM Dulbecco's Modified Eagle’s Medium DMSO Dimethyl Sulfoxide
DSC Differential Scanning Calorimeter
E Young’s Modulus
F Force
FTIR Fourier-Transform Infrared Spectroscopy
g Grams
l0 Initial length
M Molar Concentration
mL Millilitre
mm Millimetre
Mn Molar Number
xxii
mW Milliwatt
Mw Molar Weight
N Newton
NegC Negative Control
nm Nanometre
PBS Phosphate Buffered Saline
PCL Polycaprolactone
PEGDA Poly (ethylene glycol) Diacrylate
PLMC Poly (D. L-lactide-co-trimethylene carbonate) PosC Positive Control
PS Polystyrene
PVA Polyvinyl Alcohol
PVP Polyvinylpyrrolidone RCV Relative Cell Viability
RF Riboflavin
rpm Rotations per minute
Rz Resazurin
SA Sodium Alginate
SBF Simulated Body Fluid
SLA Stereolithography
SMA Shape Memory Alloys
SMP Shape Memory Polymers
STD Standard Deviation
TEOHA Triethanolamine
Tg Glass Transition Temperature TMC Trimethylene Carbonate
UV Ultraviolet
UV-Vis Ultraviolet-Visible Spectrophotometry
v/v Volume/Volume
List of Abbreviations, Acronyms and Symbols
xxiii
Δl Samples Elongation
ε Strain
λabs Absorption Wavelength
λem Emission Wavelength
μL Microliter
1
1
Introduction
1.1
Motivation
This work aims to develop polymeric materials that can be flexible but transform into rigid structures when at body temperature or in the presence of body fluids. To be used in biomedical applications, these materials need to be biocompatible, resistant and durable.
The approach followed here consists in trying to achieve a shape memory polymer with a transition temperature in the body temperature range and in creating a polymeric blend that can be printed in an extrusion 3D (three-dimensional) printer.
The 3D printing process involves the creation of a three-dimensional computational model formed by 2D layers, the extrusion (printing) of the layers through a computerized process and any post-processing techniques needed [1]. Using only lines and points, this process allows for the creation of a complex internal structure, building it up layer by layer. After each layer is completed, an ultraviolet light cures the already printed layers, allowing the object to become a cohesive structure. This process will allow the reproduction of custom prosthesis which is a great advantage compared to the existing prosthesis.
To counter the lack of materials that can be used in these prostheses, the scientific commu-nity is exploring new and biocompatible materials for bone, cartilage, arteries, pulmonary path-ways, tendons, etc. The main motivation of the work was then to contribute to the development of new materials that can be printed and possibly implanted. This offered many challenges since literature is scarce in both the approaches considered; SMP (Shape Memory Polymers) or laser UV (Ultraviolet) curing combined with 3D printing pastes.
2
1.2
Objectives
3
2
State of the Art
2.1
Implants and Prosthetic Devices
Tracheal stenosis is defined as an abnormal narrowing of the trachea, resulting in partial or total obstruction of the airways [2]. It occurs mainly due to complications caused by intuba-tion or tracheostomy, although it may also be due to a congenital problem or caused by tumours. It can occur in multiple locations at once, although it is more common in only one place.
Clinical tracheal repair began in the 19th century and a few tracheal resections were cited at the beginning of the 20th century. After confirming that tracheal resections couldn’t be performed when the excision extended 2 cm, surgeons started investigating the possibility of a prosthetic replacement. In the 1960s, the experimental investigation concluded that approximately half of the adult trachea could be removed surgically and reanastomosis performed [3]. This limit varies according to age, local anatomy, pathology and prior treatment. When a safe removal and reconstruction was not possible, a solid prosthesis was used. These created complications such as strictures, granulation, chronic infection, and dislodgement, which remained a problem with the development of porous prosthesis. The porous structure was developed to allow the connective tissue to grow, incorporating the prosthesis into the tracheal site. The most promising stents were made of silicone, such as the Neville prosthesis [4], although suture line granulomas remained problematic and were treated endoscopically[4][5].
4
years. Other types of silicone prostheses are Y-tubes, characterized by the removal of the exter-nal lateral branch, maintaining only the Y bifurcation. There is also the Dumon Prostheses which has external protrusions on its external surface at 90 º, to prevent displacement.
Figure 1. 1 –Silicone Airway Stents: (a) Montgomery’s T-tube stent; (b) Y-tube stent; and
(c) Dumon type stent [6]
Self-expanding metallic stents, as shown in figure 1.2, are more easily placed; however, their removal may result in serious complications. Usually, these prostheses are made of a nickel and titanium alloy (nitinol) and can be coated with a thin film of silicone. They are an evolution of regular silicone prostheses due to the lower radial force and accommodation to the irregular contours of the trachea. Unfortunately, these types of stents have frequent complications, in-cluding migration, particularly of silicone prostheses, or tissue growth between stent meshes. These can lead to blockage of the airway due to the accumulation of mucus and the consequent development of bacterial plaque. It is therefore obvious the need to create an innovative pros-thesis that is adaptable to the needs of each patient, being able to solve the difficulties encoun-tered.
Figure 1. 2 – Self-expanding Stents: (a) Metallic uncoated stent (Ultraflex); (b) Metallic
coated stent (Ultraflex); and (c) Reinforced Silicone stent (Polyflex) [7]
A recent study has piloted the use of a three-dimensionally printed artificial polycaprolactone tracheal graft coated with stem cells [8]. Studies using pericardium and aortic homografts have been shown to have good outcomes [9]. Another study demonstrated that silicone-stented aortic allografts have no cartilage regeneration [10], leading to proposals of a composite, fascial flap-wrapped allogeneic aortic graft with external cartilage ring support [11]. Homografts and allografts are both transplants of organs or tissues from one individual to
a b
c
State of the Art
5
another of the same species, but the latter specifies that the individuals are of different genotypes. This approach could potentially be used to repair the trachea.
Today, the direct anastomosis is considered the best option [3][12], even though stenting and prosthetic reconstruction remain the primary methodology for larger defects. This direct
approach uses the patient’s own bronchial tissue while an ideal prosthesis made with a foreign
material has not been developed. This ideal prosthesis is airtight, has the adequate consistency to prevent collapse, causes minimal to no inflammatory reaction, allows ingrowth of respiratory epithelium along the lumen and is impervious to fibroblastic and bacterial invasions of the lumen [13].
2.2
Memory Shape Materials
Memory shape can be defined as the property of a material that allows it to retain a tem-porarily altered shape until it is affected by a stimuli or trigger, which makes it return to its original shape. This stimuli or trigger can be temperature, moisture, magnetism, and ultrasound, depending on the sort of material used [14]. In a biomedical context, these materials can be divided between shape memory alloys (SMA) and shape memory polymers (SMP). SMA are out of context of this work so only SMP are described.
SMPs, are characterized by their glass transition temperature (Tg), demonstrate memory shaping properties through a mechanism inherent to their non-crystalline molecular structure, being characterized by a relatively low-temperature transition, within range of body and room temperatures, making them very suitable for biomedical applications [15]. However, to avoid inducing automatic shape change right after implantation, it is possible to use an SMP with transformation and transition temperatures slightly above body temperatures. This would create the possibility to regulate the shape change through a manual, on-demand thermal stimulus [14]. SMPs created through copolymerization of multiple monomers are also advantageous in the biomedical field due to their ability to target multiple complementary properties of interest [16], namely through control of the molar ratio between each monomer [15]
As an example of this, thermoreversible alginate hydrogels that under the effect of mul-tiple simultaneous physical stimuli reverse to a gel form can be combined in order to target their specific mechanical and physical properties [16].
6
Even though SMPs are characterized by good short, medium and long-term biocompat-ibility, issues related to their chemical structure like their chemical stability or the additives used when mass producing each one of them still require further study and assessment before each can be selected for use in biomedical applications [15].
Another example of copolymerization would be the fabrication of scaffolds of biode-gradable poly(D, L-lactide-co-trimethylene carbonate) (denoted as PDLLA-co-TMC, or PLMC) using electrospinning [14]. These scaffolds were expected to behave in a thermoresponsive and biomimetic manner, as this makes them advantageous in tuning the recovery temperature of the material to suit for shape memory applications in the human body. The degradation and me-chanical properties of these scaffolds were found to be controllable through the variation of the molar ratio of DLLA (D. L-Lactide) and TMC (Trimethylene Carbonate) allowing them to vary between a glassy state to flexible and rubber-like elastomer [14].
In this balance between DLLA and TMC, the content of the latter in the PLMC had a large effect on the elasticity and resilience of the materials, with the higher TMC materials showing superior properties. The 56 and 70% TMC polymers showed constant tensile modulus and no plastic deformation after 10 000 continuous mechanical cycles, which is a considerable improvement over other similar materials [18].
Considering the properties of current biomimetic nanofibrous PLMC scaffolds associ-ated with other desired functionalities such as biodegradability, bone forming ability, and shape memory effect in the desired Tg, the scaffolds may possess great potential for achieving very favourable outcomes in the course of scaffold-assisted bone repair and regeneration applica-tions, [14] as it is demonstrated that a general approach to imparting both the shape memory and self-healing properties to chemically cross-linked hydrogels that otherwise do not have such functionalities [19].
The properties of the amorphous phase for the PLMC, namely the mobility of the for-mer, are what determine the ability to deform the polymer’s networks and to then fix the de-formed networks.
The recovery of the macroscopic shape for the PLMC is described as a process where the chains of its networks change from an oriented network in their deformed state to their ran-dom coil conformations when they are reheated to a temperature above Tg [14].
State of the Art
7
2.2.1
Polymers
Hydrogels are cross-linked networks of hydrophilic polymers, usually with the capacity to absorb up to thousands of times their dry weight in water. Although their chemical stability is varied, hydrogels are usually biocompatible and can often be delivered into the body through minimally invasive methods [20]. They can be fabricated through several different methods, from radiating, freeze-thawing, chemical crosslinking or thermal annealing [21].
Although poly (vinyl alcohol) (PVA)’s stability as a gel is very thermally limited on its own, it has its mechanical properties enhanced when crosslinked with glutaraldehyde [15]. This process of ionic cross-linking is the frequently used method to obtain hydrogels from aqueous alginate solutions. It consists in combining ionic cross-linking agents like divalent cations with the alginate solutions [20].
The gel structure is created when, after the blocks of guluronate in the alginate chains are bound to the divalent cations, the former in one polymer chain form junctions with their equals in another polymer chain [20].
Although when it comes to ionic crosslinking alginate, one of the most used agents is calcium chloride (CaCl2), it has the disadvantage of typically leading to gelation due to its high solubility in aqueous solutions.
Phosphate (e.g., sodium hexametaphosphate) is sometimes used to slow and control gelation, as phosphate groups in the buffer compete with carboxylate groups of alginate in the reaction with calcium ions, and slowing gelation.
Another approach includes using calcium sulphate (CaSO4), which due to its lower sol-ubility, can also slow the gelation rate and widen the working time for alginate gels.
When divalent cations are in use, the gel strength and uniformity become harder to con-trol, making the gelation rate a critical factor in their regulation, as slower gelation produces more uniform structures and greater mechanical integrity.
The gelation rates, alongside the resultant mechanical properties of the gel, is affected by the gelation temperature. Crosslinking becomes slower, as the reactivity of the ionic cross-linkers is also reduced when temperatures are low.
Although there is a large variety in the mechanical properties of ionically cross-linked alginate, which varies according to its chemical structure, the resulting crosslinked network demonstrates greater order, leading to enhanced mechanical properties.
8
It is known that alginate is not degradable in the bodies of mammals, due to the lack of the necessary enzyme to cleave the polymer chains. However, using monovalent cations such as sodium ions that affect the cross-linking bonds existing in the gel, causing its dissolution [20]. When alginate is used for wound dressing, it maintains a physiologically moist micro-environment, minimizing bacterial infections at the wound site, consequently facilitating wound healing [20].
Alginate-based gels also show promising results for cell transplantation in tissue engi-neering, as the latter aims to provide man-made tissue and organ replacements to patients who suffer the loss or failure of an organ or tissue [20].
When precipitating alginate, either sodium or calcium chloride is added to the filtrate, resulting in alginic acid by treatment with diluted hydrochloridric acid. After further purification and conversion, water-soluble sodium alginate power is produced [20].
The physical properties of gels resultant from alginate are known to improve with the increase of the latter’s molecular weight. This improvement only happens to an extent, as algi-nate solutions with too high molecular weights become undesirable for production due to their high viscosity [20], and consequent risk to damage the proteins and cells mixed in the solution [1]. However, this issue can be mitigated through the combined use of high and low molecular weight alginate polymers [20].
It is well known that not only could cross-linked polymers keep their original dimen-sions for a longer time during degradation, but that they are normally stable because the net-works are invulnerable to the breakage of a single bond [22]. Considering this, a double-network polymer hydrogel composed of chemically cross-linked poly (ethylene glycol) (PEG) and phys-ically cross-linked poly (vinyl alcohol) (PVA) has been used [19].
Compared to pure PVA hydrogel, with a tensile strength of only 0.17 Mpa at the ulti-mate elongation of 312%, the incorporation of chemically cross-linked PEG improves tensile strength by a large margin, in a gradually more prominent manner with the increasing PEG content [19].
Due to the almost constant elongation observed at the break, it is deduced that in the double-network hydrogel the physical network of PVA determines the limit of extension while the chemical network of PEG influences mostly the mechanical strength [19].
State of the Art
9
2.2.2
UV Reticulation
Photoinitiated polymerizations have several advantages for polymer formation when compared to thermal or redox initiation mechanisms. The primary advantage is the control afforded over the temporal and spatial gelation process. Although simple in form, the polymerization behavior is complex because the propagation and termination rates are highly dependent on the conversion and evolving network structure [23]. Having conversion rates of approximately 100% is very important as low conversions may decrease the mechanical properties of the biomaterial. Not only that, but the non-reactive monomer may have damaging effects on the surrounding tissue.
Hydrogels created from photocrosslinking of hydrophilic PEGDA macromers are char-acterized by their ability to retain a large amount of water without dissolution and better bio-compatibility. However, the use of UV radiation to prepare PEGDA hydrogels causes them to have poor mechanical strength [21].
A possible method to mitigate this weakness is to not only irradiate the components with UV radiation but to also subject them to a high energy electron beam followed by freeze-thawing [21].
PEGDA-based hydrogels prepared in the presence of polyvinyl alcohol (PVA) as a sec-ond component to enhance the mechanical properties of hydrogels, is desirable due to their bi-ocompatibility and UV curability [21].
Due to the hydrophilic nature of PEGDA’smacromers, possessing ―C=C― bonds ex-ist at their chain ends, these are easily used for photo-crosslinking among themselves, as the occurring radical polymerization leads to the formation of a solid network. Covalent bonds can be observed, due to the existence of chemical crosslinking’s between themselves, while the con-nection between PVA and PEGDA is of physical crosslinks via hydrogen bonding [21].
An improvement upon the tensile properties of PEGDA-based hydrogels can be seen when PVA is added alongside irradiation by UV radiation, plus a high energy electron beam followed by freeze-thawing. This process can increase the hydrogel’s crosslinking density and tensile strength when compared to other hydrogels prepared through similar methods [21].
Among the many methods PEGDA can be crosslinked, photopolymerization demon-strates varied applications in tissue-engineering applications. Photopolymerization presents the possibility to control the spatiotemporal parameters of polymerization, allowing the formation of rather complex shapes [24].
10
These substrates, characterized by their excellent biocompatibility, are favourable for the study of the interactions between cells and these substrates under varied conditions, present-ing an improvement over the substrates patterned to date through mechanical methods [24].
The PEG molecule, known for being neutral [24], is considered to be inherently resistant to protein adsorption when crosslinked. Its characteristic mobility and high levels of hydration when in aqueous solutions are also considered to aid in this aspect, allowing PEG-based hydro-gels to act as biologically inert materials [25]. One of these hydrohydro-gels, PEGDA may be useful as a model material for areas such as tissue restoration, wound dressings and vascular graft coatings [25].
Regarding the use of photopolymerization in biomedical applications, photoinitiators also require biocompatibility in order to be used, leading to the use of some molecules already found in biological systems which freely generate radicals.
One approach includes using Phenylbis (2.4.6-trimethyl benzoyl) phosphine oxide (BAPO) as it is a very potent photoinitiator. However, its use is severely limited due to its poor solubility in a variety of monomers and oligomers, as well as the added cytotoxicity associated with its combination with ethanol and acetone where it is soluble. These limitations make BAPO a questionable choice for use in biomedical applications [26].
Riboflavin or vitamin B2 is one of these biological photoinitiators, as flavins are known to be able to undergo reduction-oxidation reactions with rather ease. Riboflavin, excitable by photon absorption, can create either a triplet or a singlet-excited state. Due to riboflavin’s inca-pacity to result in polymerization when alone in its triplet state, triethanolamine (TEOHA) was added to it as a co-initiator in order to mitigate this gap. This solution is viable due to what is believed to be the oxidization of the triplet state riboflavin by the TEOHA, which becomes semi-reduced while forming a semi-oxidized radical of riboflavin. The polymerization is caused by the existence of a neutral amine radical, created by the donation of a proton from the amine to the riboflavin radical [25].
Medical uses of riboflavin include the inactivation of pathogens in platelet concentrates when combined with UV light treatment and a contribution to the treatment of keratoconus through the induction of crosslinking of collagen within the cornea [25]. Its biocompatibility when in high doses or under UV exposure has already been shown, validating riboflavin as a biocompatible photoinitiator.
2.3
3D Printing in Biomedical Engineering
State of the Art
11
surgery, maxillofacial surgery [27], tissue engineering [1], indirect fabrication of medical de-vices [1], cell seeding and culturing [1], cardiac surgery and cranial surgery – where it can be used to directly print the final implant, amongst various other disciplines.
There is also use for 3D-printed in the context of studying more complex, hard to visu-alize cases, as well as teaching students and patients, or even allowing health professionals to practice certain procedures. These opportunities and others for the use of 3D-printed objects arise from the existence of certain surgical procedures which are currently complex enough to require a certain amount of guidance [27], which can be complemented by the fabrication of anatomical models for pre-surgical planning [1]. This is a requirement to avoid causing damage to certain essential parts of the body, considering current guidance requires the use of ionizing radiation in considerable amounts, lengthening the total surgical time.
In order to repair physical damage caused by other sources, namely some anatomical defects, using highly-customized prosthetics, there is a need for 3D printed objects with highly accurate measurements and properties [27].
2.3.1
Extrusion Printing
Extrusion-based 3D printing is an additive manufacturing technique which can be used for processing of paste-like materials into specific, three-dimensional shapes [28]. Hydrogels are a particularly important material and are frequently processed by extrusion-based 3D print-ing [29][30]. When compared to conventional processprint-ing techniques like mouldprint-ing, 3D printprint-ing is better able to create complex objects.
In this type of printing, the material is charged into a reservoir and then pushed contin-uously through a nozzle with the appropriate size. A continuous strand of material is deposited onto the printer’s bed. The object is then formed by the predetermined movements of the nozzle, done in a layer-by-layer method. The material’s rheological properties determine its ability to flow and maintain shape fidelity.
Some of the hydrogels previously identified as suitable for extrusion-based 3D printing are PEGDA and alginate. These materials and others have been used to create aortic valve scaf-folds [30], anatomically shaped cartilage structures like ears [31] and artificial blood vessels [32].
12
2.3.2
UV Laser
After printing, viscoelastic materials are often subjected to post-treatment such as UV curing. This process converts the material into an elastic hydrogel [33] and has been used to create detailed PEGDA based aortic valves. The depletion of the acrylate end groups during radical photo-polymerization has an unknown effect on the bonds between individual layers of the printed object and thus on the mechanical properties of the object [28] [32].
13
3
Materials and Methods
This chapter describes the methods and materials required to prepare polymeric solutions, the techniques used for UV reticulation and 3D printing, as well as those used to characterize the materials. This characterization was mainly focused on mechanical tests and cytotoxicity assays to evaluate the biocompatibility of the materials developed.
3.1
Materials and Methods
Table 3.1 summarizes the reagents used in the polymer mixtures, the variable parameters for each mixture and the protocol followed.
Table 3. 1 - Reagents used in the Protocols Performed and respective Variations
Polymer mixture
Mixture Protocol Variations
A:
PEGDA, BAPO, SA,
CaSO4
10 μL and 20 μL were added at a time to a total volume of 2 mL (1 mL PEGDA at 28.57 % v/v and 1 mL SA at
5 % v/v)
2 % or 1.5 % BAPO in etha-nol (300 - 750 L); 0.07 M
CaSO4 (210 - 630 L) B:
PEGDA, B2VT, SA,
CaSO4
2.5 mL PEGDA 34.78 % w/v and (CaSO0.15 mL to 0.75 mL B2VT 4 + 0.75 mL) from 0.0036 to 0.0081 g
C:
PEGDA, BAPO, PVA
PEGDA 28.57 % v/v and 1 mL PVA at 20 % v/v; CaCl2 150 L at 0.07 M
With or without 150 L BAPO 1.5 % or 0.01, 0.03 g
BAPO dissolved in 2 mL PEGDA
D:
PEGDA, B2VT, PVA
2 mL PVA 5 %, 15 % or 25%; 2 mL
PEGDA 34.78 % w/v 0.3 - 0.5 mL B2VT
14
The mixtures tested are based on PEGDA, a biopolymer soluble in water, BAPO, a photo-sensible polymer which is used to reticulate PEGDA and confers insolubility to water and so, rigidity. To demonstrate that PEGDA can be reticulated, BAPO was first used despite not being biocompatible. It was then replaced by B2VT (B2 Vitamin) when Riboflavin and TEOHA were available in the laboratory. The B2VT is a solution comprised of 4.3 mM of RF (Ribofla-vin) and 4.2 M of TEOHA. This photoinitiator had already been used with PEGDA in previous studies [25].
Preparation of B2VT solution (10 mL solution): 0.0095 g of RF; 3.1290 g of Triethanolamine
(TEOHA); 10 mL of ultrapure water. Carefully weigh the RF and TEOHA in separate contain-ers; 5 mL of ultrapure water was added to each container; A magnetic stirrer was placed in each container and the solutions were kept at room temperature; After 30 minutes of stirring, the two solutions were mixed and stirred for another 30 minutes.
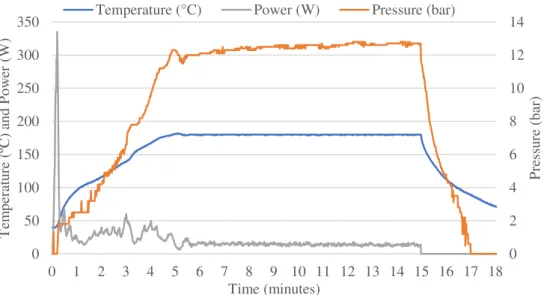
Preparation of PVA solutions: in an Anton Paar Microwave Synthesis Reactor Monowave 400:
the corresponding mass of PVA is placed in the reaction vessel (glass vial G30) along with a magnetic stirrer and 10 mL of purified water. This vessel is then placed inside the microwave where it is heated up to 180 ºC in 5 minutes (850 W, 1200 rpm – rotations per minute); it is maintained at that temperature for 10 minutes and then cooled down to 70 ºC (figure 3.1).
Figure 3. 1 – Example of a PVA reaction where the temperature, power, and pressure are
shown during the reaction period
Preparation of Mixture B: 0.0108 g of CaSO4; 1 mL of ultrapure water; 2.5 mL of 34.78 % w/v PEGDA solution in purified water; 2.5 mL of 5 % v/v Sodium Alginate (SA) solution in purified water; 1 mL of B2VT solution. Carefully weigh the CaSO4, add 1 mL of ultrapure water, add 2.5 mL of the PEGDA solution while constantly stirring with a mixer, add 2.5 mL of the SA solution; keep stirring; finally, add the B2VT solution; the mixed liquid into a 20 cc syringe and
0 2 4 6 8 10 12 14 0 50 100 150 200 250 300 350
0 1 2 3 4 5 6 7 8 9 10 11 12 13 14 15 16 17 18
Pr ess ur e (b ar ) T em per atu re (º C ) an d Po w er ( W ) Time (minutes)
Materials and Methods
15
let it rest in an upright position for at least one hour and up to 12 hours. This allows the liquid to gelify slowly, becoming denser and acquiring the perfect density to extrude.
Reticulation of B Mixtures is done under UV laser (435- 455nm) at several different powers
and between each printed layer in the extrusion 3D printer.
Preparation of Mixture C and D: To achieve a mixture that reticulates well under UV light, the
ingredients (as determined in Table 3.1) must be mixed together at a temperature of approxi-mately 80ºC and maintained at that temperature for the initial stages of reticulation to avoid deposition. Maintaining such temperature becomes more important as the desired thickness of the film increases.
Reticulation of A, C and D Mixtures is done under UV light with the aid of a UV nail lamp
which emission spectra is represented in figure 3.2.
Figure 3. 2 - Emission spectra of UV lamp used to reticulate D type samples
According to previous studies, a mixture of PEGDA/B2VT has two UV-Vis (Ultraviolet-Visible Spectrophotometry) absorption peaks at approximately 350 nm and 450 nm [25] and saturates at wavelengths under 300 nm. This means that the UV lamp used is adequate for the photo reticulation of PEGDA/B2VT based materials.
3.2
3D printing
A 3D model was developed from the patient’s Computed Tomography (CT) scan. The
in-formation retrieved from the scan is rebuilt through the files in DICOM® (Digital Imaging and Communications in Medicine) format and should be saved in .stl format, used for 3D printing, and then G-code, the language that contains all the instructions for the 3D printer.
The original files received included a model of the patient’s upper body as shown in figure 3.3 (a). The file was modified in Blender, a software used for creating 3D models until only a
0.0 0.2 0.4 0.6 0.8 1.0
220 234 248 262 276 290 304 318 332 346 360 374 388
E
m
is
sio
n
(a.
u
.)
16
section of trachea was left (figure 3.3 (c)). This final file was then saved in a .gcode format using Cura 2.4.0.
Figure 3. 3 - 3D models in .stl format based on the patient's CT scan: (a) initial model
re-ceived; (b) model after some modifications; (c) model ready to print
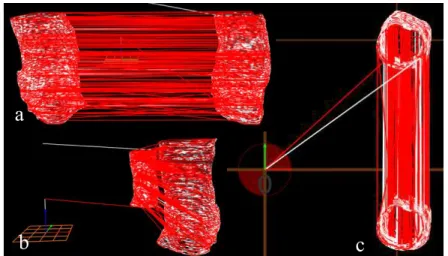
The .gcode file was then altered using a software previously created by former FCT-UNL student Filipe Silvestre, that incorporated a UV laser layer between each printed layer. This results in each new layer being reticulated and vulcanized to the layer beneath it when printing. Two objects are shown in each image in figure 3.4. This is because one corresponds to the printed object (right on image (a)) and the other corresponds to the laser reticulation layers (left on image (a)). The laser has a -70 mm offset on the y-axis due to the way the printers’ head was built.
Figure 3. 4 - 3D models in .gcode format with intercalated laser layers: (a) view from the
right; (b) front view; (c) top view
Other, more simple objects were created using the same methodology to test the materials’ mechanical properties. These .gcode files were saved in a memory card that was placed in the printer's computer. The objects were printed by extrusion and left to dry until completely solid.
a
b
c
a
Materials and Methods
17
The extrusion printer had been previously custom made for the laboratory and can intercalate UV laser reticulation between each printed layer. Due to the use of this ability, the printer’s original bed was replaced with a marble one.
Since the goal was to 3D print an object and since the mixture had to be reticulated with UV light, several laser powers were tested to find the most appropriate. Another important issue was deciding what bed to choose when printing, seeing as the laser could damage the original bed at a higher power. A base of marble was chosen as it does not burn, provides a stable and solid base for printing and absorbs any excess water caused by higher humidity in the room, providing better adhesion for the first printed layer.
The objects printed were designed with Blender and Cura 2.4.0, which creates a G-code file later read by the printer. In this file, the laser power is determined by a number between 0 and 255 which corresponds to 0 mW and 4000 mW, respectively. Table 3.2 shows this corre-spondence. Laser powers will be represented by the corresponding G-code values from here on out. This laser emits in a range between 435 and 455 nm, with a maximum power of 3.8 W, which means it includes one UV-Vis absorption peak of PEGDA/B2VT [25].
Table 3. 2 – G-Code values and corresponding laser power
G-Code 0 1 5 10 15 20 30 40 50 60 70 80 90 100 255 mW 0 16 78 157 235 314 471 627 784 941 1098 1255 1412 1569 4000
3.3
Tension and Compression Tests
Tension and compression tests were performed to understand how influential the different components are to the mechanical properties of the two materials, the impact of increasing PVA percentage in the PEGDA membranes, as well as how the laser power during reticulation affects those properties.
Several samples were subjected to tensile testing to determine an average Young’s Mod-ulus/ Modulus of Elasticity and maximum Elastic Deformation.
Tensile tests were performed on a Rheometric Scientific traction machine, Minimat Firm-ware 3.1, with a load cell of 20 N and speed of 2 mm / min. Compression tests were performed on this same traction machine and on a Shimadzu AG-50kNG mechanical testing machine at 0.5 mm / min.
18
3.3.1
Stress-Strain Curves
A typical tensile curve is shown in figure 3.5, where two different zones are presented. The elastic zone is represented by a straight line while the plastic zone starts after the yield point and is represented by a curve. The Young’s Modulus (E) corresponds to the tangential line of the points belonging to the elastic region and represents the strength of the material against elastic deformation (ε).
Figure 3. 5 – Stress-Strain Diagram [34] Retrieved 2 April 2018
The stress-strain curves resulting from the compression tests are similar to those shown in figure 3.6, in which three main zones are distinguished: elastic zone, collapse plateau, and densification zone. The elastic phase corresponds to the bending of the foam walls, followed by the collapse phase when the cell walls are damaged or fractured. Finally, the densification zone is characterized by increased tension and crushing of the cell walls.
Figure 3. 6 - Typical Compression Curve for Foams [35] (left) and for polymers [36] (right)
Materials and Methods
19
Elasticity Modulus, also known as Young’s Modulus is equal to the longitudinal stress divided by the strain. It measures the materials ability to withstand changes in length when under lengthwise tension or compression. Stress (σ) is calculated by dividing the applied force (F) by the samples cross-section (A) and Strain (ε) is calculated by dividing the samples elongation
(Δl) by the samples initial length (l0).
The strain was calculated considering the continuous changes in each samples length. First, the nominal extension (ext) at any given time was calculated by dividing the current length by the initial length. Then, εwas calculated by applying the natural logarithm to that extension plus one:
𝐥𝐧
(𝟏 + 𝒆𝒙𝒕)The stress at any given time was given by:
(𝟏𝟎𝟎𝟎 × 𝑭𝑨 ) × (𝟏 + 𝒆𝒙𝒕)
where F is the applied force in kN and A is the area of the samples cross-section in mm2. With these values, we could create a stress-strain curve and calculate the value of the first slope for each sample, therefore calculating E. The stress-strain curves presented for each sample are the ones given directly by the tests.
Young’s Modulus (E); Maximum Stress; Maximum Strain; Maximum Force and Initial Distance between claws are presented for each Tensile test. In addition, the Average value and standard deviation (STD) for each type of sample are also presented, as is an Average* and respective STD* when outlier values were removed.
3.4
Fourier-Transform Infrared Spectroscopy
–
FTIR
20
3.5
Ultraviolet-Visible Spectrophotometry
–
UV-Vis
UV-Vis is the application of spectroscopy, regarding either reflectance or absorbance, as is the case in this study, within the spectral region of the ultraviolet-visible. This spectroscopy is performed by irradiating the molecular structures within a specific wavelength range, where certain non-bonding electrons can be excited to higher molecular orbitals through absorption of energy. The resulting wavelength at which an electron is excited depends on how easily this orbital transition can be performed.
3.6
Cytotoxicity
Cytotoxicity was tested using Vero cells: African green monkey kidney epithelial cells. The cell culture was done in 96-well plates in culture medium DMEM (Dulbecco's Modified
Eagle’s Medium, Sigma-Aldrich D5030). Cultures were kept in the incubator (37ºC, 5% CO2,
SANYO CO2 incubator, Model HCO-19AIC (UV)). A Trypan Blue solution (0.4%, Gibco®,
Invitrogen™) was used to facilitate cell count. Resazurin (Alfa Aesar, USA) at 0.2 mg/mL in
PBS (Phosphate Buffered Saline) was used for the colourimetric tests whose absorbances were measured in the microplate reader (Biotek ELX 800 UV). DMSO (Dimethyl Sulfoxide, M = 78.13 g mol-1, MERCK-Schurardt) was added to the positive control wells.
In vitro cytotoxicity tests were performed using the extraction method. This consists of obtaining an extract of the sample by placing it in culture medium and then replacing the me-dium used to grow the cells with this conditioned meme-dium.
The procedure followed in the cytotoxicity tests was as follows:
• In the first test, the samples were sterilized using ethanol. Both samples were submerged in approximately 2 mL of ethanol 70% (v/v) and left there for 48 hours. They were removed and left to air dry in a sterile environment for 24 hours and then irradiated with UV light for 30 minutes. In the second test, the samples were also sterilized using ethanol but were sub-merged for only 5 minutes and left to dry for 24 hours and then irradiated with UV light for 30 minutes.
• In the first test, the medium was added to each sterilized sample to have a 15% w/v ratio. This main solution was then diluted to create 10% and 5% w/v ratios. In the second test, the original solution had a 20% w/v ratio and was diluted to obtain 15%, 10%, and 5% w/v ratio solutions.
Materials and Methods
21
• Cells were then seeded in a 96-well plate with adequate cell density and allowed to multi-plicate for 24 hours in the incubator (37ºC, 5% CO2, SANYO CO2 incubator, Model HCO-19AIC (UV)).
• The culture medium of each well was replaced by the conditioned medium in each concen-tration to be tested. Five replicas were done per concenconcen-tration of each sample as well as per control. Positive, Negative and Cell-Mediated Controls (CMC) were performed on each plate, serving as a reference to calculate viability. The cells were incubated under these conditions for 24 hours.
• The conditioned medium was removed and a Resazurin solution 10% (v/v) was added to the culture medium. To each well were added 120 µL of medium with Resazurin. The cells were incubated for 3 hours, after which the absorbance measurements were done to calculate viability.
The viability of the cells is measured using a colourimetric method based on the colour of the reagent Resazurin, which is blue ( λabs = 604 nm) with no fluorescence and turns pink when reduced to Resorufin ( λabs/λem = 571/585 nm) by living cells. Fluorescence measure-ments allow us to quantify the number of living cells and know the samples toxicity.
Two extraction tests were done for each type of sample (Protocol B and Protocol D) to verify the accuracy of the obtained results since they were different from those expected. This is also why in the second test the samples were not submerged in ethanol. In the first test, CMC was not replicated due to lack of medium. In the first test, the positive control was done once at 10% DMSO while in the second test there were two positive controls, one at 10% DMSO and one at 20% DMSO. This was done to give us a better understanding of the toxicity of the mate-rial when compared to the positive control
22
Table 3. 3 - Plate preparation for the first cytotoxicity test
1 2 3 4 5 6
A Positive Control CMC
B Negative Control
empty
C 15%
Protocol B C5B
D 10%
E 5%
F 15%
Protocol D D5A
G 10%
H 5%
Table 3. 4 – Plate preparations for the second cytotoxicity test
1 2 3 4 5 6 7 8 9 10 11 12
A 20% 15% 10% 5% 20% 15% 10% 5% N
23
4
Result Analysis and Discussion
This chapter shows the main results and includes the discussion of tests related to the development of shape memory polymers, the polymer mixture for 3D printing and their me-chanical and compositional analysis, including cytotoxicity assays.
4.1
Shape memory polymer
A first approach to develop a shape memory polymer was performed with a copolymer seeking the following characteristics: shape memory with glass transition temperature around 37ºC; biocompatibility; possible 3D print; high elasticity/flexibility; possible biodegradability, and anti-bacterial properties.
From the literature, we found a copolymer that could fit these features. PLMC was synthesized with the goal of attaining shape memory effects using DL-Lactide (DLLA) (99%, Alfa Aesar) and Trimethylene Carbonate (TMC) (99.5 %, Mw 102.09, Actu-All Chemicals) according to a report from literature [15]. PLMC is a biocompatible and biodegradable semi-crystalline polymer also known as Poly (D. L-Lactide-co-TMC). It was synthesized at an 8:2 DLLA: TMC ratio using Tin(II) 2-ethyl hexanoate (Stannous Octoate) (92.5 %, Mw 405.12, Sigma-Aldrich) as a catalyst, as suggested in previous studies [14]. Polystyrene (PS) (melt index 2.0 - 4.0 g/10 min, Sigma Aldrich) and Polycaprolactone (PCL) (Mn ~ 80,000, Sigma-Aldrich) were added to PLMC and tested for shape memory properties.
Thermal properties of PLMC have been shown to change according to their DLLA: TMC ratio with only one glass transition having been detected in their DSC (Differential Scanning Calorimeter) curves. It has been shown that for an 8:2 weight ratio, the glass transition temper-ature is 36.7 ºC [14]. The polymerization of PLMC (8:2) was done according to the protocol defined in previous studies [37]. It was performed in a 500 mL single-neck flask with constant
use of a magnetic stirrer. Stannous Octoate (SnOct) 1.5 ‰ (g/g) was used as a catalyst for the
reaction. After placing all elements in the flask, it was filled with nitrogen and degassed in vacuum three times, then sealed. The flask was then immersed in an oil bath at 100 ºC until the reactants melted. The oil bath was then increased to 130 ºC, always under magnetic stirring, and kept at that temperature for 12 hours. This time was determined by trial and error since the
24
original article indicated 5 hours while others indicated 48 hours. The polymer was then re-moved from the flask by dissolution in chloroform, purified by precipitation in methanol and then dried under vacuum.
Several tests were done where PLMC would be submerged in heated water and given a shape, then put in the freezer at approximately 0ºC and finally submerged again in water at the same initial temperature. The best results were obtained at 39.8 ºC when the sample exhibited shape memory properties. Varying the monomer ratio of DLLA: TMC it’s possible to reach a glass transition temperature of 37 ºC. Unfortunately, due to the physical characteristics of the polymer, it could not be used in a 3D printer.
Polystyrene (PS) was added to PLMC and a film was produced which exhibited shape memory properties at 70.8 ºC in water (figure 4.1 (a)); when PCL was added, a film was pro-duced with shape memory properties at 50 ºC.
To better test its shape memory properties, the samples were dissolved in DCM: DMF and alternately dried under vacuum and heated at 60 ºC.
Figure 4. 1 – Testing PLMC/PS shape memory properties: (a) Initial Shape; (b) Deformed
Shape; (c) Recovered Shape
As the results achieved did not present the envisioned phase transition at 37- 40 ºC and since the PLMC synthesis is very expensive, another approach was tested, focusing on the de-velopment of a polymer able to be printed in an extrusion 3D plotter.
PLMC +
PS
Result Analysis and Discussion
25
4.2
Polymers mixtures and 3D printing tests
This section shows the results obtained with different mixtures of polymers with the ob-jective of finding a mixture with good consistency to print, enabling the 3D printing of a com-plex piece.
4.2.1
Polymer mixture A
A mixture of PEGDA, as the base polymer, SA, as a thickener, BAPO and CaSO4 was tested to achieve a printable material that would reticulate under UV light – polymer mixture A.
In a first step, several concentrations of CaSO4 were tested in a mixture with PEGDA (1 mL at 28.57% v/v) and SA (1 mL at 5% v/v), to achieve a printable paste. The best results were
achieved with 120 μL of CaSO4 solution at 0.06 M. The paste did not seem grainy and lines
printed maintained shape and consistency. The use of 130 μL of a solution at 0.08 M also
wielded good results while with 90 μL of a solution at 0.1 M the paste was too dense and grainy
to print properly.
The hand printed structures were left overnight at approximately 10ºC for 12 hours, ap-peared to have shrunk slightly and had lost some water. Elasticity was maintained although they remained too fragile to handle. This was expected since no photoinitiator was added.
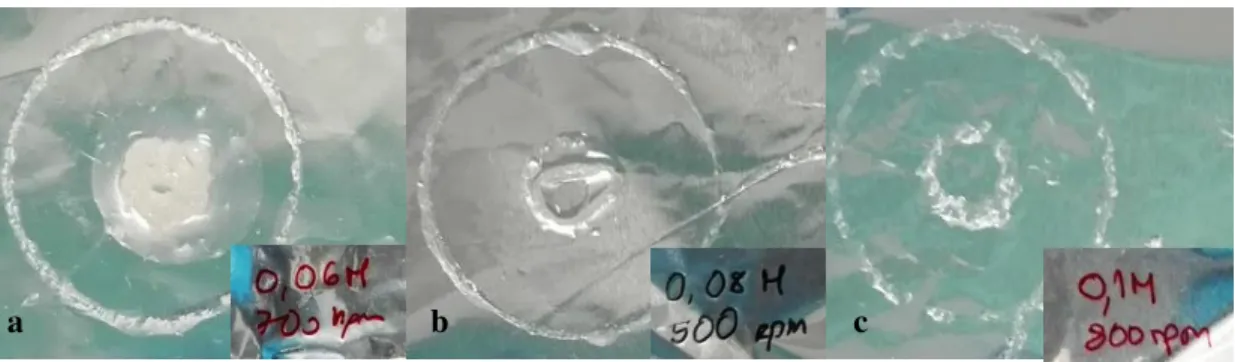
Small tubes were made in an extrusion-based 3D printer and left in the open for 24 h. The 0.06 M sample formed some air pockets in the syringe but the structure printed at 700 rpm maintained its shape, deforming only because of the printer bed instability. The 0.08 M sample was run at 500 rpm and did not seem homogenous. Sample 0.1 M was too dense to print and did not maintain an aggregated structure. In figure 4.2 we can see the results after 24 hours. Sample 0.06 M lost the most amount of water, while sample 0.1 M seemed to not have lost any water.
Sample 0.08 M didn’t lose too much water but had difficulties maintaining stability. Due to
these results during and after printing, it was decided to test different concentrations of the pho-toinitiator with a solution of 0.07 M of CaSO4.
Figure 4.2 – Samples with different concentrations of CaSO4, 24 hours after being 3D
printed – top view: (a) 0.06 M, (b) 0.08 M and (c) 0.1 M
26
In the second step, the photoinitiator was added to the mixture and several concentrations of BAPO and CaSO4 were tested as shown in table 4.1. Between 10 μL and 20 μL of BAPO and CaSO4 were added at a time to a total volume of 2 mL (1 mL PEGDA at 28.57% v/v and 1 mL SA at 5% v/v), until the pre-determined volume was reached in each test sample. These samples were observed to determine the subsequent trials. These observations led to sample 14 being deemed good enough to start printing trials.
When PEGDA was tested with only BAPO (2 mL at 28.57% and 600 μL at 1.5%, respec-tively), the result was too liquid and it lacked elasticity.
Table 4.1 - Different concentrations of BAPO tested: 2mL PEGDA (28.57%) and
2mL SA (5%)
Sample
BAPO in Ethanol
(μL)
CaSO4 (0.07M)
(μL)
BAPO/CaSO4 Result BAPO 2% BAPO 1.5%
3 750 630 1.19 The paste was too dense to print.
4 690 570 1.21 Loses too much water when reticulating. Doesn’t reticulate all the hydrogel.
12 750 600 1.25 Less elastic than sample 9.
13 690 540 1.28 More liquid than expected. Could not maintain printed shape.
2 600 450 1.33 Not fluid enough to print
9 600 450 1.33 Wasn’t fluid enough to print solid particles blocking the needle. may have had 5 450 330 1.36 Printed at 1200 rpm. There were solid pieces already before printing. 7 450 330 1.36 Still losing too much water when reticulat-ing. 8 540 390 1.38 Still losing too much water when
reticulat-ing.
1 300 210 1.43 Needs more CaSO4.
6 300 210 1.43 Is too liquid before printing and so it loses too much water.
14 600 390 1.54
Reticulated after 2.5 hours under UV light; displays some elasticity; has kept the origi-nal shape and size. Prints well on paper af-ter being centrifuged.
15 600 330 1.81 Too elastic. Doesn’t attach itself correctly to the printing bed.
Result Analysis and Discussion
27
Figure 4. 3 - Examples of some of the samples printed including (a) sample 14, (b) sample
13, (c) sample 5 and (d) sample 1
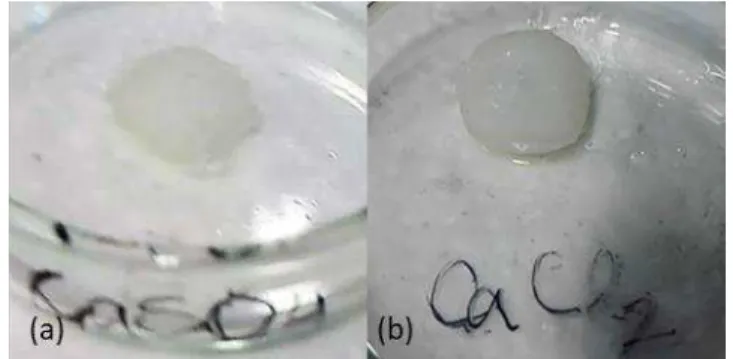
A solution with the same composition of sample 14 was used to print two cubes that were placed in either a solution of CaSO4 dissolved in ethanol or CaCl2 dissolved in H2O. This was done to test if SA would ionically crosslink further when submerged in a solution with high calcium content. Two calcium compounds were used in the solutions to determine if they yielded different results. The first cube (CaSO4 in ethanol) reticulated quickly but shrunk con-siderably despite maintaining its original shape and was fragile (breakable). The second cube did not reticulate as fast as the first but its corners became rounder, changing the original shape completely, figure 4.4.
Figure 4. 4 - 3D Printed cubes of sample 14 after being submerged in (a) CaSO4 or (b) CaCl2
4.2.2
Polymer mixture B
28
Table 4. 2 – Polymer mixture B; Parameters varied with PEGDA 34.78% (2.25mL); SA (5%)
Sample CaSO4 + 0.75 mL H2O
(B2VT: 0.15 mL) Sample
CaSO4 + 0.75 mL H2O (B2VT: 0.3 mL)
C1A 8.1 mg C2A 8.1 mg
C1B 6.6 mg C2B 6.6 mg
C1C 5.1 mg C2C 5.1 mg
C1D 3.6 mg C2D 3.6 mg
Sample
CaSO4 + 0.75 mL H2O (B2VT: 0.45 mL)
Sample
CaSO4 + 0.75 mL H2O (B2VT: 0.6 mL)
Sample
CaSO4 + 0.75 mL H2O (B2VT: 0.75 mL)
C3A 8.1 mg C4A 8.1 mg C5A 8.1 mg
C3B 6.6 mg C4B 6.6 mg C5B 6.6 mg
C3C 5.1 mg C4C 5.1 mg C5C 5.1 mg
C3D 3.6 mg C4D 3.6 mg C5D 3.6 mg
Figure 4. 5 – Handprinted samples C1A, C2A. C3A, C4A, and C5A before (A) and after (B) UV
reticulation
First tests with the 3D plotter were performed and as the UV laser effect on the reticula-tion of polymer mixture B was unknown, preliminary trials with different numbers of printed layers were done. Control pieces were printed with 1, 2, 3 and 4 layers to determine the effect
of UV reticulation and test the material’s printing - figure 4.6. Further improvements were tested
by refining the ratio between components as seen in table 4.3.