Preparation of an Injectable Macroporous α-TCP Cement
Andrés Felipe Vásquez Niñoa*, Luis Alberto Loureiro dos Santosa
aBiomaterials Laboratory, Materials Department, Universidade Federal do Rio Grande do Sul – UFRGS, Porto Alegre, RS, Brazil
Received: March 17, 2016; Revised: June 21, 2016; Accepted: June 24, 2016
One of the most important characteristics of calcium phosphate cements is their resorbability when implanted in the body. However, the in vivo resorption rate is slow due to the lack of intrinsic open porosity. In this study, macroporous structures were obtained by mixing alpha-tricalcium phosphate (α-TCP) cement with a foamed liquid phase containing diferent concentrations of sodium hydrogen phosphate and non-ionic (Lutensol) or anionic (Sodium Lauryl Sulfate) surfactant. The cement paste was prepared by hand mixing in a system of two syringes connected by a polyvinyl chloride (PVC) valve, an environmentally friendly method. Solutions with Lutensol (L110) showed greater foamability than solutions with Sodium Lauryl Sulfate (SLS). Scanning Electron Microscopy characterization helped verify that the prepared samples showed a macroporous interconnected structure, and X-ray difraction analysis evidenced the transformation of α-TCP into calcium deicient hydroxyapatite (CDHA). This study suggests that the calcium phosphate cement samples foamed with Lutensol may be further evaluated as suitable materials for bone illing.
Keywords: Bioceramics, α-TCP, Macroporosity, Bone Cement, Injectable Cement
1. Introduction
The bone can be described as a composite material
formed by an organic phase and a mineral phase,
the latter known as carbonated apatite. Due to the
chemical similarity of calcium orthophosphates to the mineral component of bones, they have been widely studied as suitable materials for bone tissue filling and regeneration. Among these ceramics,
calcium phosphate cements (CPCs) show remarkable
features for such applications, like malleability, injectability, small cavity filling, bioactivity and in situ hardening at room temperature1,2.
Basically, a viscous paste is formed after mixing
a solid phase (cement powder) with a liquid phase (aqueous solution). The paste hardens and the final
product of the setting reaction is obtained, calcium
deficient hydroxyapatite (CDHA) in the case of
apatitic cements, which thanks to its formation at body temperature shows higher chemical and crystallographic similarity to biological apatites and a greater specific surface area than sintered hydroxyapatite3. In addition, calcium phosphate
cements are resorbable materials, this is, they have
the ability to be solubilized and then replaced by
new bone tissue4.
Even though calcium phosphate cements
are microporous and resorbable materials, their
resorption rate is too slow. This can be explained
by the absence of open porosity with diameters
larger than 100mm in bulk material5. Resorption of the CPC is done in two ways: The first, called
passive resorption, is caused by the interaction of the material with organic fluids and depends on the chemical composition of the hardened cement, on its porosity and crystallinity, and on the pH of the interphase between the cement surface and the surrounding tissues6,7. The second, called active
resorption, is caused by the cellular activity of macrophages or osteoclasts, which produce a pH around 5.5, accelerating the dissolution rate of the cement surface8,9. Thus, an interconnected macroporous structure is required to guarantee a
higher resorption rate and to guide the formation of new bone through the cement structure
(osteoconduction). Cell proliferation is aided by
blood vessels formation inside the cement structure, which allows nutrients and oxygen supply, besides protein transport10.
Different methodologies have been reported
to induce macroporosity in calcium phosphate
cements. These procedures are usually the same
used to obtain cellular ceramics. Among these
techniques replica methods11, porogenic agents
sacrifice12, rapid prototyping13 and direct foaming14
are predominant. Among the advantages of the latter are the simplicity of the process and the induction of macroporosity before setting, which allows injectability of the foamed paste.
The objective of this work was the evaluation
of a new and simple methodology to obtain macroporous calcium phosphate cement. In the
study, two types of surfactants –Sodium Lauryl Sulfate and Lutensol ON 110– were used for the foaming of an α-TCP cement.
2. Materials and Methods
The α-TCP used in this work was obtained
through the wet precipitation method, adding a
0.5M (NH4)2(HPO)4 solution (Dinâmica Ltda) into a 0.5M Ca(NO3)2 solution (Sigma Aldrich) previously heated to a temperature of 60°C in a round bottom distillation lask with constant stirring of 200 rpm. The low rate of the phosphate solution was ixed at 14mL/min. The precipitate was iltered and dried in an oven at 100°C for 24 hours. After drying,
the material was manually crushed in a porcelain
mortar. The powder was then thermally treated in an alumina crucible at 1400°C for an hour. Finally,
the material was ground again in the mortar and sieved through a #325 mesh.
Before making the cement samples, the different
concentrations of Na2HPO4 setting accelerant (Synth) and surfactant –Sodium Lauryl Sulfate (Dinâmica Ltda) or Lutensol ON 110 (Basf)– were determined for the liquid phase in order to evaluate its foamability afterwards. For that purpose, a
central composite design 22 was used, with 4 axial
point runs and 3 replicates in central points (11
runs total). The concentrations of Na2HPO4, SLS
and L110 were chosen as independent variables,
these are represented in Table 1.
The experimental design for each surfactant was
obtained with the Statgraphics Centurion XVI software.
Table 2 presents the total number of runs and their
experimental combinations.
The response variable, i.e., the foamability of each
solution, was determined by collecting 2,2mL (Vi)
from the solution with diferent concentrations of of surfactant and Na2HPO4 (Table 2) with a conventional 10mL syringe and then connecting it with a lexible PVC valve to another syringe illed with a ixed air volume (Figure 1a). The solution was injected manually
from one syringe to another and a foamed phase was formed because of the turbulence generated in the
liquid. The piston push frequency was ixed at 160 bpm (2.67 Hz) with the help of a digital metronome
and the mixing time was 30 seconds.
The foam was injected in a 20mL graduated cylinder
to measure its volume (Vf). Then, the foamability (F)
of each solution is deined by:
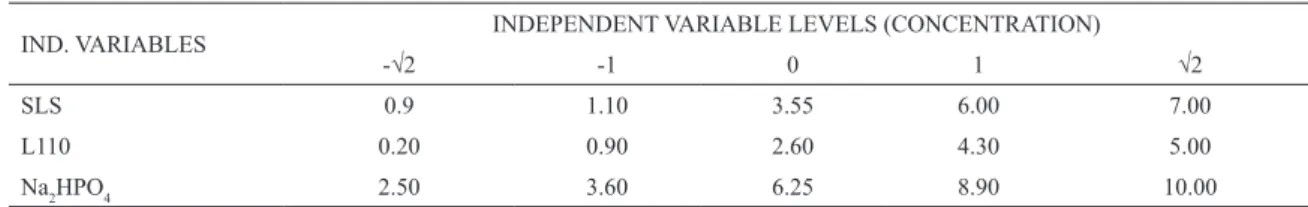
Table 1: Concentrations of independent variables SLS, L110 and Na2HPO4.
IND. VARIABLES INDEPENDENT VARIABLE LEVELS (CONCENTRATION)
-√2 -1 0 1 √2
SLS 0.9 1.10 3.55 6.00 7.00
L110 0.20 0.90 2.60 4.30 5.00
Na2HPO4 2.50 3.60 6.25 8.90 10.00
( )
A
F
V
V
V
100
i
f i
#
=
c
-
m
After evaluating the solutions for their foamability,
six surfactant/Na2HPO4 combinations with the greater foam volume formation were chosen to continue
the experimental procedure. The cement paste was prepared in two stages: Foaming of the liquid phase,
as just described, and mixing of the foam with the cement powder. After foam formation, the foam was
kept completely in one of the syringes to subsequently add 3g of α-TCP cement to the other syringe. Both
phases were then mixed for 15 seconds at 160bpm
(Figure 1b). The cement paste was then injected in
cylindrical silicone molds with 8mm diameter and
2.7mm height. The samples were kept in the molds for 24 hours at 37°C and 100% relative humidity. At
last, the samples were removed from the molds and
immersed in Ringer´s saline solution for 72h at 37°C. The samples were crushed by a mortar and pestle and the powder was structurally characterized by X-ray difraction (XRD) in a Phillips X’pert MPD difractometer over a scan range of 20-40°, with a step size of 0.02° and a nominal time per step of 2 seconds. Then, the macrostructure of the samples’ fracture surface was examined by Scanning Electron Microscopy (SEM) on a JEOL 6060 microscope, after coating them with a thin layer of gold. Pore size
distribution was measured for each micrography with
the ImageJ software. Finally, porosity was calculated by geometric method. Five samples per solution were
evaluated and the average porosity value was calculated.
3. Results and Discussion
Table 2: Experimental combinations of diferent concentrations of Na2HPO4 and surfactant.
Sodium Lauryl Sulfate Lutensol® ON 110
RUN [ ] SLS (wt%) [ ] Na2HPO4 (wt%) RUN [ ] L110 (wt%) [ ] Na2HPO4 (wt%)
S1 3.55 6.25 L1 2.60 6.25
S2 1.10 3.60 L2 0.90 8.90
S3 0.09 6.25 L3 2.60 10.00
S4 6.00 8.90 L4 0.90 3.60
S5 7.00 6.25 L5 5.00 6.25
S6 3.55 6.25 L6 2.60 6.25
S7 6.00 3.60 L7 4.30 8.90
S8 1.10 8.90 L8 2.60 2.50
S9 3.55 2.50 L9 4.30 3.60
S10 3.55 10.00 L10 0.20 6.25
S11 3.55 6.25 L11 2.60 6.25
Figure 1: Foaming system, composed by 2 syringes connected by
a lexible PVC valve. (a) Foaming of the solution. (b) Obtaining
of the foamed cement paste.
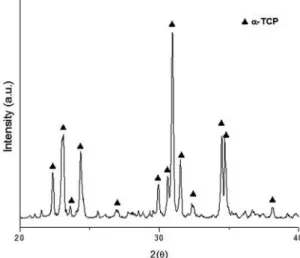
Figure 2: XRD pattern for the powder synthesized through wet
precipitation method and charred at 1400°C for an hour.
as the only phase in the powder after being thermally
treated, when comparing it with the standard ile (JCPDS 9–348). There were no peaks corresponding to other calcium phosphate phases like β-TCP (JCPDS 9–169), HA (JCPDS 9–432) or TTCP (JCPDS 25-1137).
Figure 3 presents the FTIR spectra of the synthesized α-TCP powder. Two broad bands at 531 – 605cm-1 and
944 – 1076cm-1 were observed. The irst one corresponds to the anti-symmetric P–O bending mode (ν4). Shoulders
at 551, 566 e 595cm-1 are superimpose, increasing
Figure 3. FTIR spectra of the α-TCP powder after calcination at
1400°C.
the wide of the band. The second one, composed by
shoulders at 944, 988, 1032 e 1055cm-1, corresponds to the anti-symmetric P–O stretching mode (ν3)
15.
Additionally, bands and shoulders corresponding to OH groups (630 and 3570cm-1) and adsorbed water
(3000 – 3700cm-1) were not found in the spectra. Figure 4 shows the response surfaces for foamability
as a function of surfactant and sodium phosphate
concentrations for the evaluated solutions (Table 2).
As expected, in both cases the surfactant concentration
afects signiicantly (p<0.05) the foamability of the solution. p-values calculated for SLS and L110 were 0.0013 and
0.0001 respectively. Furthermore, on both surfaces it
is evident that foamability increases with surfactant concentration until it reaches a maximum value and then it diminishes slightly as the surfactant concentration
continues to increase. This phenomenon is attributed to the achievement of the critical micelle concentration (CMC)
Figure 4: Response surfaces for foamability of solutions with
diferent concentrations of Na2HPO4 and (a) SLS and (b) L110.
to remain constant16,17. Na
2HPO4 concentration was also statistically signiicant for the foamability of solutions containing SLS (p=0.0018). Clearly, with the increase
of the phosphate salt in the solution its foamability tends
to diminish. On the other hand, adding Na2HPO4 to the solutions containing L110 did not signiicantly inluence
their foamability (p=0.1096). This can be explained by
the interaction of the electrolyte with the micells of the
surfactant. Anionic surfactants (SLS) are more likely than non-ionic (L110) to undergo electrical repulsions between
the polar heads of their amphipathic molecules, causing,
for example, a reduction of CMC18.
Analyzing and comparing the foamability values of solutions with SLS and L110, it can be concluded that the ones containing Lutensol ON 110 showed a much higher volume increase (%) after agitation than the ones containing Sodium Lauryl Sulfate; the lowest
and highest foamability values corresponded to runs
L2 (286.4%) and L9 (400%), respectively. The lowest and highest response variable values for SLS solutions were 45.5% (S3) and 209.1% (S9), respectively. In
other words, the highest foamability value within
the SLS runs was lower than the lowest value within the L110 runs. This result conirms the preference of L110 over SLS to continue the present study. The six
compositions with higher foamability were chosen,
being these L1 (377.3%); L3 (354.5%); L5 (390.9%); L7 (381.8%); L8 (372.7%); and L9 (400%).
Figure 5 shows the XRD pattern for the calcium
phosphate cement sample prepared with L5 solution
(5wt% L110 and 6.25wt% Na2HPO4) after immersion
in Ringer´s solution for 3 days.
The transformation of α-TCP into CDHA after the
immersion in Ringer´s solution is evident. However, low-intensity peaks corresponding to the precursor
Figure 5: XRD pattern for an α-TCP cement sample prepared
with L5 solution.
cement powder appear, indicating an incomplete transformation after 3 days. Ginebra et. al.19 evaluated
the setting reaction of an apatitic cement mixed with
a Na2HPO4 (2.5wt%) liquid phase and reported the complete disappearance of α-TCP peaks after a 15 days immersion in Ringer´s solution. The cement hardening occurs by the hydration reaction of α-TCP in CHDA, according to equation B:
(
)
( )
Ca PO
H O Ca HPO
PO
OH
B
3 4 2 2 9 4
4 5
a
-
+
]
g
]
g
]
g
α-TCP hydrolysis is mainly controlled by two
mechanisms. In the initial stage, the reaction is limited by the surface area of the cement powder in contact
with the liquid, as long as the supericial CDHA layer
formed around the initial powder particles allows a fast
liquid difusion through the layer. For this, the CDHA
layer must be thin, discontinuous or permeable to ion
transport. When the layer covers the particles’ surface completely and becomes thicker, the liquid difusion rate becomes lower than the α-TCP salt dissolution rate, meaning the difusion mechanism controls then
the hydrolysis reaction20.
Table 3 shows the calculated porosities for the
cement samples prepared with the studied solutions. As a reference, the porosity of a control cement sample
(C) was calculated, that is, without any surfactant addition to the liquid phase and with a Na2HPO4 concentration of 2.5wt%.
The decrease of apparent density as well as the
increase of total porosity are evident when comparing the
foamed samples to the control cement. Total porosities
of the macroporous samples appeared in the range of
80 – 90%, which was observed in the cross section SEM micrographs, shown in Figure 6.
SEM characterization revealed the samples’ highly
Table 3: Apparent Density and Total Porosity of foamed CaP cement samples. The standard deviation values are in parentheses.
Apparent Density (g/cm3) Total Porosity (%)
C 1,271 (0,038) 59,71 (1,20)
L1 0,593 (0,038) 81,22 (1,19) L3 0,620 (0,056) 80,36 (1,76) L5 0,351 (0,023) 88,88 (0,73) L7 0,434 (0,020) 86,26 (0,62) L8 0,386 (0,027) 87,77 (0,86) L9 0,269 (0,013) 91,47 (0,41)
Figure 6: SEM micrographs of the foamed cement samples. (a)
L1; (b) L3; (c) L5; (d) L7; (e) L8; (f) L9.
which favors the growth of new bone tissue through the structure of the material and allows the permeation
of body luids like blood and nutrients10. The samples
with lowest apparent density and highest porosity were
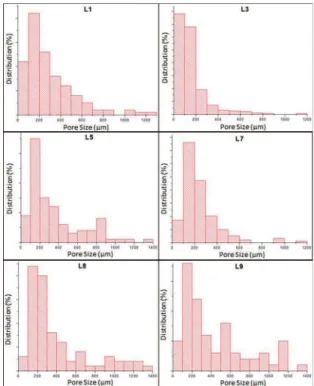
the ones prepared with solutions L5 (Figure 5c) and L9 (Figure 5f), which had the highest surfactant proportions: 5 and 4.30wt%, respectively. The sample with lowest porosity, according to the values in Table 3, was the one prepared with L3 solution. This was conirmed by Figure 5b, which evidences the presence of minor macropores in the structure. Even though the cement prepared with L3 has the same L110 proportion (2.6wt%) as the cements prepared with L1 and L8, the Na2HPO4 proportion is diferent, being 10wt% for L3 and 6.25 and 2.50wt% for L1 and L8, respectively. In other words, the Disodium Hydrogen Phosphate concentration also inluences the cements’ inal macrostructure. Figure 7 shows the pore size distribution for the cement samples.
Although the L3 sample shows some macropores with diameters larger than 200mm, most of the pores
Figure 7: Pore size distribution of the cement samples.
are within the 10 – 100mm range, meaning that besides having the lowest total porosity, it also has the lowest
pore size distribution among all the tested specimens. This is a consequence of the high Na2HPO4 proportion,
which accelerates the setting reaction, avoiding bubble
coalescence in the foamed cement. Foam is an unstable
thermodynamic system because of its large interfacial
area, which increases considerably the system’s free energy. Therefore, after forming the foam, physical
phenomena take place leading to a free energy reduction
and so destabilizing the foam16. This is known as foam
maturation. One of the phenomena involved in the
maturation process is the gas difusion from smaller
to bigger bubbles. As a result, smaller bubbles tend to
disappear while bigger bubbles increase their size16. A
lower setting time means greater opposition to the air
difusion process and consequently to bubble growth. This is why the samples with lower Na2HPO4 proportion show a greater population with pore sizes over 200mm. The minimum pore size required for the use of
cement as a scafold in tissue engineering is 100mm.
Seeing this, all the cement samples prepared here may
be considered as candidates for further evaluation as
suitable materials for bone substitutes. Therefore, the
published, where a similar method to obtain calcium phosphate cement scafolds was suggested.
4. Conclusions
α-TCP macroporous cement samples were prepared
by manually mixing the cement powder with the foamed
liquid phase using a syringe method, a new approach
to obtain macroporous calcium phosphate cements.
The foamability analysis revealed that solutions with diferent Lutensol ON 110 concentrations formed a greater foam volume than solutions with Sodium Lauryl Sulfate. Because of this, the cement samples
were prepared with L110 foam and they showed open
macropores with pore sizes greater than 100mm. The macrostructure of the cement samples was inluenced both by the surfactant and the Na2HPO4 concentrations in the liquid phase. Obtained samples have potential
to be further evaluated as suitable materials for bone
illing and regeneration in non-load-bearing areas.
5. References
1. del Real RP, Ooms E, Wolke JG, Vallet-Regí M, Jansen JA. In vivo
bone response to porous calcium phosphate cement. Journal of Biomedical Materials Research. Part A. 2003;65(1):30-36.
2. dos Santos LA, Carrodéguas RG, Rogero SO, Higa OZ, Boschi AO, de Arruda ACF. Alpha-tricalcium phosphate cement:
“in vitro” cytotoxicity. Biomaterials. 2002;23(9):2035-2042.
3. Almirall A, Larrecq G, Delgado JA, Martínez S, Planell JA, Ginebra MP. Fabrication of low temperature macroporous hydroxyapatite scafolds by foaming and hydrolysis of an α-TCP
paste. Biomaterials. 2004;25(17):3671-3680.
4. Constantz BR, Barr BM, Ison IC, Fulmer MT, Baker J, McKinney
L, et al. Histological, chemical, and crystallographic analysis of
four calcium phosphate cements in diferent rabbit osseous sites. Journal of Biomedical Materials Research. 1998;43(4):451-461. 5. Burg KJL, Porter S, Kellam JF. Biomaterial developments for
bone tissue engineering. Biomaterials. 2000;21(23):2347-2359.
6. LeGeros RZ, Parsons JR, Dalculsi G, Driessens F, Lee D, Liu ST, et al. Signiicance of the porosity and physical chemistry
of calcium phosphate ceramics. Biodegradation - bioresorption.
Annals of the New York Academy of Sciences. 1988;523:268-271.
7. Unosson J, Montufar EB, Engqvist H, Ginebra MP, Persson C. Brushite foams-the efect of Tween® 80 and Pluronic® F-127
on foam porosity and mechanical properties. Journal of Biomedical Materials Research. Part B,AppliedBiomaterials.
2016;104(1):67-77.
8. Shimazaki K, Mooney V. Comparative study of porous
hydroxyapatite and tricalcium phosphate as bone substitute.
Journal of Orthopaedic Research. 1985;3(3):301-310. 9. Dorozhkin SV. Self-Setting Calcium Orthophosphate Formulations.
Journal of Functional Biomaterials. 2013;4(4):209-311. 10. Shepherd JH, Best SM. Calcium phosphate scafolds for bone
repair. JOM The Journal of The Minerals, Metals & Materials
Society (TMS). 2011;63(4):83-92.
11. Miao X, Hu Y, Liu J, Wong AP. Porous calcium phosphate
ceramics prepared by coating polyurethane foams with calcium phosphate cements. Materials Letters. 2004;58(3-4):397-402.
12. Xu HHK, Weir MD, Burguera EF, Fraser AM. Injectable and macroporous calcium phosphate cement scafold. Biomaterials.
2006;27(24):4279-4287.
13. Akkineni AR, Luo Y, Schumacher M, Nies B, Lode A, Gelinsky M. 3D plotting of growth factor loaded calcium phosphate cement scafolds. Acta Biomaterialia. 2015;27:264-274.
14. Montufar EB, Traykova T, Gil C, Harr I, Almirall A, Aguirre A, et al. Foamed surfactant solution as a template for self-setting injectable hydroxyapatite scafolds for bone regeneration. Acta Biomaterialia. 2010;6(3):876-885.
15. Carrodeguas RG, De Aza S. α-Tricalcium phosphate: Synthesis,
properties and biomedical applications. Acta Biomaterialia.
2011;7(10):3536-3546.
16. Schramm LL. Emulsions, Foams, and Suspensions: Fundamentals and Applications. Weinheim: Wiley - VCH Verlag; 2005. 17. Porter MR. Handbook of Surfactants. New York: Springer
Science; 1993.
18. Holmberg K, ed. Handbook of Applied Surface and Colloid Chemistry. Volume 2. New Jersey: Wiley; 2002.
19. Ginebra MP, Fernández E, De Maeyer EA, Verbeeck RM, Boltong MG, Ginebra J, et al. Setting reaction and hardening
of an apatitic calcium phosphate cement. Journal of Dental Research. 1997;76(4):905-912.
20. Ginebra MP, Fernández E, Driessens FCM, Planell JA. Modeling
of the Hydrolysis of α-Tricalcium Phosphate. Journal of the
American Ceramic Society. 1999;82(10):2808-2812. 21. Zhang J, Liu W, Gauthier O, Sourice S, Pilet P, Rethore G,
et al. A simple and efective approach to prepare injectable macroporous calcium phosphate cement for bone repair: