Transient Directional Solidiication of Cast Iron: Microstructure Formation, Columnar to
Equiaxed Transition and Hardness
Thiago Sartorello Spinolaa, José Eduardo Spinellia*
aDepartment of Materials Engineering, Federal University of São Carlos – UFSCar, Washington Luis
Rd, km 235, 13565-905, São Carlos, SP, Brazil
Received: December 19, 2015; Revised: April 28, 2016; Accepted: May 11, 2016
A number of applications may require cast iron. Engine cylinder blocks, lywheels, gearbox cases, machine-tool bases may be manufactured by using grey cast iron while bearing surfaces with white cast iron. Thus, understanding the solidiication behaviour of eutectic cast iron becomes an essential task, with certain points to be accomplished. Transient directional solidiication may provide particular advantages in order to deal with these items, such as the large variation of growth rate (V) and cooling rate (̇) values, which may allow a variety of microstructures and morphologies to be studied. The aim of this work is to examine the macrostructure regions, scale of the dendritic microstructure, proportions of the formed phases and hardness of samples obtained by transient directional solidiication of a eutectic cast iron (Fe-3.5wt%C-2.5wt%Si). It was shown that a CET criterion should be based on a critical V value at the solidiication front of about 0.6 mm/s. The efects of the formed phases, their proportions and λ2 on hardness of the cast alloy are assessed.
Keywords: cast iron, CET, hardness, microstructure, eutectic
1. Introduction
Cast iron is a binary iron-carbon of multicomponent Fe-C-X alloy that is rich in carbon and exhibit a considerable amount of eutectic in the solid state. According to the metastable phase diagram, Fe-Fe3C, the white eutectic or austenitic (γ), iron carbide Fe3C may form. Considering the stable diagram iron-graphite (a signiicant amount of Si is required in this case), the gray eutectic, austenite-graphite (Gr) may grow. According to Polackzek and Santos1 a number
of graphite shapes can solidify as part of the austenite-graphite eutectic as follows: lake (plate) austenite-graphite (FG), compacted (vermicular) graphite (CG), coral graphite and spheroidal (nodular) graphite (SG). The type of morphology obtained depends basically on the chemical composition, the temperature gradient/growth rate ratio (G/V) and the cooling rate (̇). Depending on the equivalent carbon, the primary phase can be either austenite for hypoeutectic cast iron or graphite for hypereutectic cast iron. The literature is scarce on studies stressing to the formation and growth characteristics of austenite dendrites. More attention from investigators has been given to the eutectic cell count and morphology. This is probably because dendrites are not readily discernible in the structure. On the other hand, a lot of research have been done on the relationships between dendritic growth and the solidiication thermal parameters (G, V and ̇) for light alloys2-5.
The usual λ2V=constant relation of regular eutectics
proposed by Jackson and Hunt (J-H)1,6 may not be obeyed
during the growth of austenite-lake graphite eutectic. Diferent experiments proposed other exponents to be adopted instead -1/2. The following λ-V relationships in lake graphite cast
iron were cited in ref 7: λ = 3.8 x 10⁻⁵ V-0.5 cm (experimental); λ = 0.56 x 10⁻⁵ V-0.78 cm (experimental); λ = 7.1 x 10⁻⁵ V-0.57 cm (experimental) and λ = 1.15 x 10⁻⁵ V-0.5 cm (theoretical-JH). There is a limitation on these values since growth rates are generally lower than 10-2 mm/s due to the imposed stationary conditions. Further, there is no agreement in literature concerning the mentioned relationships. Furthermore, data on spacing of the ledeburite eutectic (austenitic (γ), iron carbide Fe3C) for low solidiication velocities showed that the model λ2V does not it the experimental scatter8.
It is well known that cooling rate has a signiicant inluence on the morphology of the γ-Fe3C eutectic. At moderate undercoolings, ledeburite structure is expected. High cooling rates, as obtained in quenching experiments, produce a degenerate eutectic structure dominated by Fe3C
plates1. According to Park and Verhoeven8 the primary efect
of Si addition on the γ-Fe3C structure of ledeburite is to cause the formation of cells and dendrites. Both cells and dendrites of eutectic through alloys form with plate-shaped cross sections. Because of the generated supercooling, the irst stage in the white iron formation was the growth of Fe3C plate dendrites, just as in hypereutectic alloys. Only in the hypoeutectic alloys, the Fe3C dendrites grow around the pre-existing austenite dendrites. Then, in the second stage for both hyper- and hypoeutectic alloys, a cooperative eutectic growth of austenite and Fe3C occurs on the sides of the primary Fe3C plates as the liquid between the plates solidiies.
According to Jacot et al.9, the gray and white iron
eutectic can exhibit either a fully columnar morphology or an entirely equiaxed structure. This would be correlated with the solidiication conditions. Often, both morphologies are observed in the casting, resulting in a transition from
an outer columnar zone to a central equiaxed region. Jacot and co-authors9 observed that the mechanisms associated
with the microstructural transition may be predicted by their model. Further, the columnar front of white iron was stopped or broken up by equiaxed grains of gray iron.
As established by Svidró and Diószegi10 shrinkage
defect is able to be formed in connection with the dendrite coherency. Even though a number of studies have been performed on columnar-to-equiaxed transition (CET), it remains unclear the exact mechanism of shrinkage porosity formation. After illing molten alloy in the mold, dendrites start growing from the mold surface into the melt all-around the mold wall creating a container shaped columnar zone. Inside the melt, nucleation of the equiaxed grains starts on heterogeneous nucleation sites. The moment when the equiaxed and columnar grains ill up the volume is called dendrite coherency or the columnar to equiaxed transition (CET). Shrinkage porosity in lamellar cast iron is most likely to form in connection to the dendrite coherency11. Svidró and
Diószegi10 stated that there are limited known investigation
methods to determine CET in cast iron and consequently there is no information on how metallurgical parameters are afecting its occurrence. Investigations on vertically upward directional solidiication of Al–Cu, Al–Si and Sn–Pb alloys have proposed a CET criteria based on critical cooling rates of about 0.2 K/s, 0.17 K/s and 0.014 K/s, respectively, with the columnar growth prevailing throughout the casting for cooling rates higher than these critical values12-14. The application of such criterion based on a critical solidiication thermal parameter has never been veriied considering data from solidiication of cast iron.
The scope of this paper is to comprehend the microstructure formation of a directionally solidiied cast iron under transient heat low conditions. The primary and eutectic dendrites are examined and characterized by the secondary
dendritic arm spacing, λ2, and its dependence on the growth
rate (V). Experimental correlations between hardness and λ2 and between hardness and the proportion of phases and
constituents are envisaged along the length of the casting. Finally, experimental CET data under diferent solidiication conditions are examined with a view to determine if the CET for cast iron occurs at a critical solidiication thermal
parameter.
2. Experimental procedure
A directional solidiication setup was used so that heat was directionally extracted only through a water-cooled bottom. In order to vary the metal/mold interface conditions, either low carbon steel or graphite bottom parts were used so that the efects of mold material could be noted. Graphite was chosen since it is used as die material under water-cooled
regime during industrial continuous casting of cast iron,
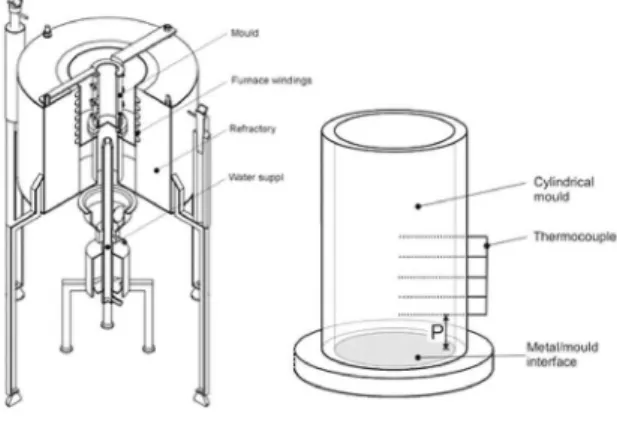
making possible the production of bars with ine-grained as cast structure. Details about the solidiication system and the mold used in the present investigation can be seen in Figure 1. The cast iron was melted in an induction furnace until molten reached a predetermined temperature. After that, molten alloy was poured into the mold with water supply already initiated. Three experiments were carried out according
Figure 1: Schematic vertical upward directional solidiication casting assembly and mold details (right side).
with diferent solidiication conditions for CET analysis as follows: G1: bottom part of the mold in graphite; ΔT~40K; S1: bottom part of the mold in low carbon steel; ΔT~80K and
S2: bottom part of the mold in low carbon steel; ΔT=160K. ΔT is the maximum melt superheating level above eutectic temperature acquired by the irst thermocouple closer to the cooled surface of the casting.
Continuous temperature measurements in the casting were performed during solidiication by ine type K thermocouples (0.2 mm diameter wire sheathed in 1.0mm outside diameter stainless steel tubes) placed along the castings length.
The Nital’s reagent (98ml of ethanol and 2ml of HNO3) and etching times of 2 min and 5s were used to reveal the macrostructures and the microstructures, respectively. The CET, if any, was measured along a vertical central section and from the bottom of the casting. The intercept method was adopted on longitudinal samples from the experiment G1 in order to determine the secondary dendrite arm spacing (λ2)
15. Image processing
systems were used to measure the cited spacings and their distribution ranges. At least 30 measurements were performed for each selected position along the first 20mm of the castings length, region where features of white cast iron were detected.
Area fractions of Fe3C carbides, graphite and pearlite were determined by counting the relative areas proportions of each phase/constituent using image processing software (Image J). At least 10 images were examined to yield the average value corresponding to each phase/constituent on each position to be considered.
The samples used for segregation analysis were extracted from diferent positions along the length of the DS casting from the G1experiment. Such analyzes were performed
by optical emission spectrometry, applying electrical
position was the average of at least 10 measurements on each cast iron sample.
3. Results and discussion
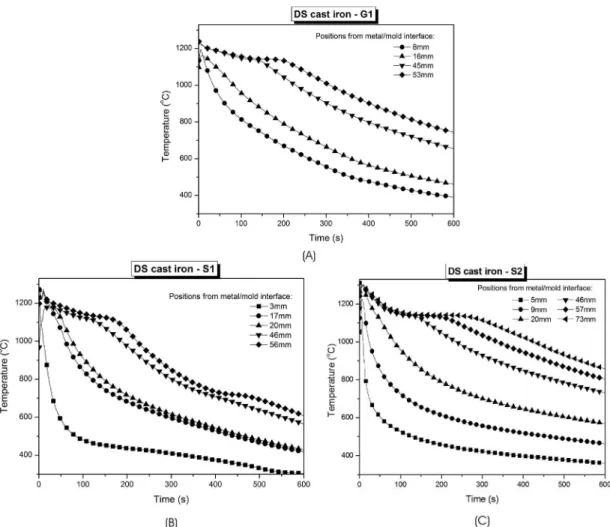
The evolution of temperature along the casting length, as a function of time, was acquired during growth of the aforementioned G1, S1 and S2 experiments, as shown in Figure 2. The experimental cooling curves refer to thermocouples located at speciic distances from the cooled surface. The thermal readings have been used to provide a plot of position from the metal/mold interface and the corresponding time of the eutectic front passing by each thermocouple. The derivative of this function with respect to time gave values for the growth rate (V), as shown in Figure 3a. The experimental tip cooling rate (̇) along the casting length is shown in Figure 3b. The experimental tendencies inserted in Figure 3 demonstrate that a large range of cooling rate was obtained while a smaller range of growth rate values can be seen. The reason why the eutectic front displaced faster in the case of bottom part in steel is probably due to the higher thermal conductivity of this material compared with graphite. Thus, higher growth rates can be observed concerning the solidiication of cast iron
against low carbon steel bottom part of the mold16. Similarly,
experimental cooling rates obtained during the experiments adopting low carbon steel (S1, S2) were higher than those associated with G1 experiment.
The resultant directionally solidiied macrostructures are shown in Figure 4. Despite transitions being located very close to the bottom of the casting, the basic feature of the CET shown by these macrostructures is that the transition is sharp. Very ine columnar grains may be observed with no presence of entrapped equiaxed grains. The CET is dependent on solidiication thermal parameters which vary with time and position during transient solidiication. In order to determine more accurately these parameters regarding the position of the CET more thermocouples were positioned near the cooled surface of the casting than in the farther positions. Thus, more
accurate interpolations are provided.
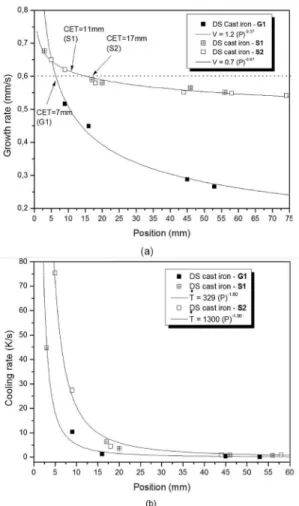
The resultant solidiication thermal parameters associated with the CET transition (V and ̇) have been experimentally determined as can be seen in Table 1. According to this list in table 1, it seems that cooling rate is not sensitive to the position of the CET. On the other hand, the response of
Figure 3: (a) Growth rate and (b) Cooling rate as a function of position from the cooled surface of the DS cast iron.
Figure 4: Longitudinal macrostructures of the DS cast iron for the three examined solidiication conditions.
growth rate values against CET is quite diferent from that of cooling rate, with very similar values of V found for the diferent CET positions in the three experiments performed with cast iron.
Table 1: CET positions and solidiication thermal parameters for the tested directionally solidiied cast iron conditions.
Experiment CET (mm) V (mm/s) ̇ (K/s)
G1 7.0 0.58 9.9
S1 11.0 0.61 4.4
S2 17.0 0.59 7.9
Average 0.59 7.40
The thermal CET criteria are recognized as very good indicative for the macrostructural transition as reported
in several articles12-14,17,18. However, none previous study
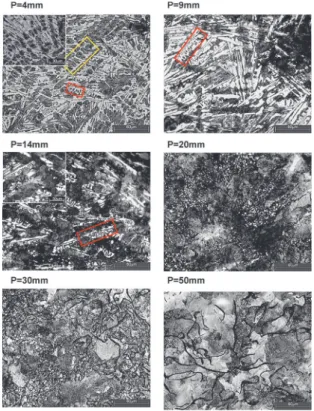
has been found on determining the solidiication thermal parameters associated with the CET of cast iron. In the case of Sn-based12,13,19 and Al-based14,17,18 alloys investigations have been addressed to single-phase and hypoeutectic alloys. In these cases, critical cooling rate was established as a realistic criterion, since cooling rate (̇) encompasses growth rate (V) and temperature gradient (G), i.e., =G x v. The present investigation deals with a eutectic alloy and in this case it appears that a critical growth rate of about 0.6mm/s is adequate criteria for cast iron. This CET criterion for cast iron does not depend on either mold material or superheat. Typical microstructures of the G1 experiment were chosen along the directionally solidiied cast iron with a view to represent not only the scale of the microstructure but also the diferent formed phases and morphologies. Such optical microstructures are depicted in Figure 5. A dendritic array is observed in the irst three positions (P) closer to the cooled surface of the casting, i.e., P=4mm, P=9mm and P=14mm, which are associated with cooling rate values of 27.1, 6.3 and 2.8K/s, respectively. Two ranges of dendritic array sizes may be observed. It appears that coarser dendrites (yellow rectangle) refer to the growth of austenite phase while iner structures (red rectangle) are dendrites of eutectic, which grow around the pre-existing austenite dendrites8. The presence of Fe
3C carbides is observed up to 20mm from the bottom of the casting. Entrapped graphite (white arrow) may be observed for P=9mm. As cooling rate diminishes, nucleation and growth of graphite start to prevail with a typical FG cast iron microstructure being seen for the P=30mm, featured by graphite plates distributed within a pearlitic matrix. Larger graphite lakes have grown for farther positions as in the case of P=50mm, which is due to slow cooling conditions, i.e., =0.3K/s.
Two experimental laws are adopted to represent the evolutions of the λ2 with v as shown in Figure 6. The exponent
-1/2 recommended by Jackson and Hunt6 encompasses
the dendritic growth of eutectic while the exponent -1.0 represents the austenite dendritic growth. The ranges of spacing sizes were from 11.0 to 28.0 µm and from 3.5 to 5.5 µm for austenite and Fe3C dendrites, respectively. The
experimental laws λ2= 3.1 x (V)
-1/2 / λ
2= 6.3 x (̇)
-1/4 (eutectic)
and λ2= 9.4 x (V)-1.0 / λ2= 46.5 x (̇)-1/2 (primary growth)
are able to represent the evolutions of the microstructural spacings for white cast iron.
Figure 5: Typical microstructures of the directionally solidiied cast iron from a number of diferent positions (P) along the length of the casting. P is the position from metal/mold interface. The inset images emphasize the occurrence of the eutectic dendrites.
Figure 6: Primary and eutectic secondary dendritic spacing (λ2) as a function of (a) growth rate and (b) cooling rate for the directionally solidiied cast iron. R2 is the coeicient of determination.
Figure 7: Carbon (C) and silicon (Si) proiles along the length of the DS casting.
macrosegregation proile has the typical trend of a positive segregation distribution for a solute redistribution coeicient (k0) higher than unity
20. This means that iron (solvent) is
rejected with the progress of solidiication. In contrast, a normal macrosegregation proile is observed for the carbon (C). Since austenite is enriched in Si, C segregation depends on Si presence. Si probably decreases solubility of C in Fe, which stimulates C to be rejected to the liquid immediately ahead of the solidiication front. In spite of the higher silicon content and lower C content of the positions closer to the bottom of casting (P < 20mm), a predominance of white cast iron (see top microstructures in Figure 5) is guaranteed by the higher cooling rates at these regions.
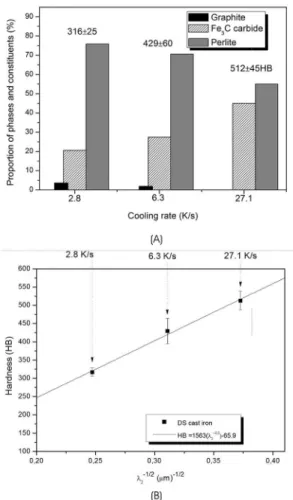
Figure 8 shows the prevalence of phases as a function of the cooling rate level experienced by the DS cast iron. Due to the formation of white cast iron closer to the casting cooled surface, a considerable amount of Fe3C carbides is observed for cooling rates higher than 1.5K/s. For lower cooling rates (< 1.5K/s), graphite and pearlite start to prevail with rather increase in proportions with slower cooling condition. Brinell harness values were inserted inside the graph so that contributions of the formed phases and their proportions on hardness are highlighted.
While Hall-Petch type formulae (HBx=HB0+keλ2
-1/2) have been proposed to relate hardness and the microstructural scale of Al-Fe and Zn-Cu alloys21,22, relations like that were not found
in literature of cast iron. Hence, the efect of λ2 on Brinell hardness of the cast iron can be seen in Figure 9 through the purpose of a Hall-Petch itting with the present experimental scatter. It seems to be appropriate. This λ2 value is the average
between coarse and ine spacing. Although hardness is shown to increase with the decrease in λ2, the contributions of the phases
and their proportions may not be neglected. For instance, for hardness of 512HB the associated fraction of the hard Fe3C carbide is 45% with λ2 of 7µm while for 316HB around 20%
Figure 8: Cooling rate and hardness (HB) experimental relations with the proportions of phases and constituents in the directionally solidiied cast iron.
Figure 9: Efects of magnitude of average λ2 on Brinell hardness along the length of the DS cast iron. The fractions of phases vs.
cooling rate complete de analysis.
is responsible for better distribution of the harder Fe3C phase. The combined efects of these features cooperate with the inal hardness evolution obtained in DS cast iron.
4. Conclusions
The following can be drawn from the present experimental
study:
• It was shown that a criterion for CET of cast iron
(Fe-3.5wt%C-2.5wt%Si) should be based on a critical growth rate of about 0.6 mm/s, which maintains realistic for a variety of superheats and materials of the mold.
• Experimental growth laws were proposed relating
the iner and coarser secondary dendrite arm spacings of the cast iron with the experimental thermal parameters v and ̇. Power functions having -1/2 /-1/4 and -1.0/-1/2 exponents were shown to represent the evolutions of the eutectic and austenite
dendrites, respectively.
• A Hall-Petch type equation has been proposed
relating hardness (HB) to λ2: the smaller λ2, the
higher HB. The hardness was shown to increase signiicantly with the combined increase in the area fraction of the Fe3C carbide and decrease in λ2.
5. Acknowledgements
The authors acknowledge the inancial support provided by FAPESP (The Scientiic Research Foundation of the State of São Paulo, Brazil) and CNPq (The Brazilian Research Council). In addition, we would like to thank engineer Anderson José Tomaz, from the Department of Products and Process Engineering at Tupy S.A – Mauá, São Paulo, Brazil for providing chemical analysis results.
6. References
1. Polackzek AB, Santos D. Solidiication of eutectic alloys - cast
iron. In: ASM Handbook, volume 15: Casting. Materials Park:
ASM International: 2008. p.317-329.
2. Verma A, Kumar S, Grant PS, O’Reilly KAQ. Inluence of cooling rate on the Fe intermetallic formation in an AA6063 Al alloy.
Journal of Alloys and Compounds. 2013;555:274-282.
3. Fei WD, Kang SB. Efects of cooling rate on solidiication process in Al-Mg-Si alloy. Journal of Materials Science Letters.
1995;14(24):1795-1797.
4. Quaresma JMV, Santos CA, Garcia A. Correlation between unsteady-state solidiication conditions, dendrite spacings,
and mechanical properties of Al-Cu alloys. Metallurgical and
Materials Transactions A. 2000;31(12):3167-3178.
5. Goulart PR, Spinelli JE, Osório WR, Garcia A. Mechanical properties as a function of microstructure and solidiication
thermal variables of Al–Si castings. Materials Science and
Engineering: A. 2006;421(1-2):245-253.
6. Jackson KA, Hunt JD. Lamellar and rod eutectic growth. Transactions
of the Metallurgical Society of AIME. 1966;236:1129-1142.
7. Minkof I. The Physical Metallurgy of Cast Iron. New Jersey:
John Wiley & Sons; 1983. 318p.
8. Park JS, Verhoeven JD. Directional solidiication of white cast iron.
9. Jacot A, Maijer D, Cockcroft SL. A two-dimensional model for the description of the columnar-to-equiaxed transition in competing gray and white iron eutectics and its application to
calender rolls. Metallurgical and Materials Transactions A.
2000;31(8):2059-2068.
10. Svidró P, Diószegi A. Determination of the columnar to equiaxed
transition in hypoeutectic lamellar cast iron. Transactions of
the Iron and Steel Institute of Japan. 2014;54(2):460-465.
11. Elmquist L, Diószegi A. Shrinkage porosity and its relation to solidiication structure of grey cast iron parts. International
Journal of Cast Metal Research. 2010;23(1):44-50.
12. Siqueira CA, Cheung N, Garcia A. The columnar to equiaxed
transition during solidiication of Sn-Pb alloys. Journal of
Alloys and Compounds. 2003;351(1-2):126-134.
13. Siqueira CA, Cheung N, Garcia A. Solidiication thermal parameters afecting the columnar-to-equiaxed transition. Metallurgical and
Materials Transactions A. 2002;33(7):2107-2118.
14. Peres MD, Siqueira CA, Garcia A. Macrostructural and microstructural development in Al-Si alloys directionally
solidiied under unsteady-state conditions. Journal of Alloys
and Compounds. 2004;381(1-2):168-181.
15. Gündüz M, Çadirli E. Directional solidiication of
aluminium-copper alloys. Materials Science and Engineering: A.
2002;327(2):167-185.
16. MATWEB. Materials Properties Data, Graphite, Carbon, C
and AISI 1020 Steel, cold rolled. Available from: <http://www.
matweb.com>. Access in: 02/02/2015.
17. Gomes CHU, Kikuchi RHL, Barros AS, Silva JNS, Silva MAPS, Moreira ALS, et al. On the Natural Convection in the Columnar to Equiaxed Transition in Directionally Solidiied
Aluminum-based Binary and Multicomponent Alloys. Materials Research.
2015;18(6):1362-1371.
18. Rocha OL, Gomes LG, Moutinho DJC, Ferreira IL, Garcia A. The columnar to equiaxed transition in the directional solidiication
of aluminum based multicomponent alloys. REM: Revista
Escola de Minas. 2015;68(1):85-90.
19. Spinelli JE, Ferreira IL, Garcia A. Inluence of melt convection on the columnar to equiaxed transition and microstructure of downward unsteady-state directionally solidiied Sn-Pb alloys.
Journal of Alloys and Compounds. 2004;384(1-2):217-226.
20. Jiyang Z. Colour Metallography of Cast Iron. China Foundry.
2010;7(4):470-478.
21. Silva BL, Garcia A, Spinelli JE. The efects of microstructure and intermetallic phases of directionally solidiied Al-Fe alloys
on microhardness. Materials Letters. 2012;89:291-295.
22. Brito C, Siqueira CA, Spinelli JE, Garcia A. Efects of cell morphology and macrosegregation of directionally solidiied
Zn-rich Zn-Cu alloys on the resulting microhardness. Materials