*e-mail: [email protected]
Introduction
The nitriding process is one of the most important thermochemical treatment processes in metallurgy for the production of case-hardened surface layers in low-alloy steel. The diffusion of nitrogen into steel leads to the formation of a nitride layer, which comprises a thin outer compound layer (white layer) and thick inner diffusion layer. The compound layer consists of the epsilon phase (ε) and the gamma prime phase (γʹ). The diffusion layer is composed of interstitial solid solution of nitrogen dissolved in the ferrite lattice (α) 1. The improvement of corrosion and wear properties can be attributed to the construct of compound layer. Therefore, it is beneicial to predict the nitrogen concentration proile and phase composition of the compound layer in the nitriding process.
To further understanding the nitriding process, numerical simulations have been employed to calculate the nitride layer growth and the nitrogen concentration proiles since 1990s 2-13. Sun and Bell 2 developed a mathematical model to simulate the plasma nitriding process of low alloy steel. Their model considered the diffusion of nitrogen in ferrite and development of iron nitride layer on the surface simultaneously. Then, Goune et al., 3 and Belmont et al., 4 constructed a realistic diffusion-precipitation model to describe the volume diffusion of nitrogen in ferrite and the simultaneous precipitation of ine scale alloying element nitrides in the diffusion zone. Furthermore, Kamminga, Janssen 8,9 presented a model for
the calculation of nitrogen depth proiles in nitrided steel
based on precipitation and trapping, and the calculations agreed well with experimental nitrogen depth proiles for nitrided Fe–Mn (1.62 wt.% Mn) and Fe–V (0.55 wt.% V) alloy. Keddam 10 and Cavaliere et al., 11 modeled the nitriding process by coupling the kinetics data of nitrogen in α, γʹand ε phases to the thermodynamic description of the iron-nitrogen (Fe-N) phase diagram respectively. Recently, Yang et al., 12,13 presented a nitriding process model including the kinetics of compound layer growth and the determination of the nitrogen diffusivity in the diffusion zone. However, the prediction of Fe-N phase composition and the hardness in the nitride layer have received less attention.
The main purpose of this paper is to simulate the nitrogen concentration, (Fe-N) phase composition and hardness in the nitriding process of low alloy steel. A diffusion/transformation coupled model is developed to predict the phase compositions at the thinner compound layer by considering simultaneous the thermodynamic data and kinetics theory in the nitriding process. The simulated results are compared with the experimental ones and theoretical descriptions.
2. Model description
The knowledge of both thermodynamic and kinetics data is required in modeling the nitriding process. A large number of thermodynamic and diffusion kinetics data can be found in 14-20. Iron-nitrogen (Fe-N) binary phase diagrams are the base to understand the phase evolution during the nitriding process. In the past decades, the iron-nitrogen phase diagram
Prediction of Phase Composition and Nitrogen Concentration During
the Nitriding Process in Low-Alloy Steel
Xiaohu Denga*, Dongying Jub
aTianjin Key Laboratory of high speed cutting and precision machining, Tianjin University
of Technology and Education – TUTE, Tianjin, 300222, China
bDepartment of Mechanical Engineering, Saitama Institute of Technology – SIT,
Saitama, 369-0293, Japan
Received: February 26, 2015; November 26, 2016, 2015; Accepted: December 21, 2015
A diffusion/transformation coupled model has been developed which combines inite difference (FD) model with a phenomenological model. The composition of the different iron-nitrogen(Fe-N) hardening phase can be regard as a function of nitriding time and nitrogen concentration. The diffusion model and transformation model are linked by the limiting nitrogen solubilities and the effective diffusion coeficients. The effect of alloy elements (Cr, Mo, Mn, V, Ni etc.) is considered by introducing an alloy coeficient for limiting nitrogen solubilities and diffusion coeficient. The diffusion/transformation model can predict nitrogen concentration, phase composition and hardness distribution. The model is employed to simulate the nitriding process of SCr420H low-alloy steels. The simulated nitrogen concentration and hardness proiles are consistent with the measured ones. In addition, the predicted depth distributions of iron-nitrogen phase agree well with the available experimental results. Therefore, the comparison shows the reliability of the coupled model. It can be applied to improve the nitriding process parameters.
and Fe-N system has been investigated extensively 14,15. Moreover, Lakhtin 16 reviewed the diffusion foundations of the nitriding process in carbon steel and alloy steel. Because the bonding energy in α-phase is lower than that in the lattice of γʹ and ε-phases, the coeficient of nitrogen diffusion in α-phase should exceed the coeficients in the γʹ and ε by many times 17. Furthermore, the phase composition of a compound
zone and growth kinetics of a diffusion zone during the nitriding of steel was investigated quantitatively 18,19. Recently, Somers 20 reviewed the development of the compound layer during gaseous nitriding of Fe-based materials.
In the development of the nitriding model, in order to simplify model, the following assumptions are made:
Firstly, the diffusion process follows Fick’s second law in a semi-ininite medium;
Secondly, the surface nitrogen concentration does not vary with the nitriding time;
Thirdly, a uniform temperature is assumed throughout the sample;
Lastly, local thermodynamic equilibrium is reached quickly at every point in the material.
2.1. Nitrogen diffusion model
The diffusion of nitrogen into ferrite phase is considered to obey Fick’s second law 21.
2 2 ( ) N N N D t x ∂ = ∂
∂ ∂ (1)
where, Nis nitrogen concentration, χ is the depth, t is nitriding time, Dn denotes the effective diffusion coeficient
of nitrogen.
The numerical method is applied to solve the diffusion equation. In the present model, an alternating-direction-implicit (ADI) inite-difference formulation is used to solve equation (1).
1 1
1 1 1 1
1
(0.5 ( )
)
t 1 t t t t t t
i i i i i i i
t t
i i
Cn Cn F Cn Cn Cn Cn
Cn Cn + + + − + − + + = + ∗ ∗ + + + − − (2)
where, Ft i = D
t
i * Dt / DX 2, Dt
i is the diffusion coeficient
of location i at time t, Dt is time step, Cnt
iis the nitrogen
concentration of location i at time t.
The boundary conditions is the following
0
( , ) |x NS
C x t = =C (3)
where, CS
Nis the surface nitrogen concentration.
2.2. Fe-N phase composition predicted model
By employing the Fe-N phase diagram (Fig. 1 (a)) 14,15, it is feasible to predict the different Fe-N phases according to the limit solubility values 10,11. In Fig. 1 (b), it is presented the composition of the different Fe-N phase as a function of nitriding time and nitrogen concentration. Based on the lever rule, a phenomenological model is developed to calculate the volume fraction of iron-nitrogen phase. The nitriding parameters are connected with the mechanisms of the
nitriding process. The volume fraction of iron-nitrogen phases is deined as
, / , /
/ / , / / ,
i t i t
N N N N
N N N N
C C C C
C C C C
1
α γ γ ε
γ γ α α γ ε γ ε γ γ ε
α γ ε
ξ ξ ξ
ξ ξ ξ
′ ′ ′ ′ ′ ′ ′ ′ ′ − − = = ⋅ − − = − − (4)
where, Ci,t
N is nitrogen concentration, C α/γʹ N , C
γʹ/α N, C
γʹ/ε N, C
ε/γʹ N are
the limiting nitrogen solubilities in Fe-N phase, as a function of temperature can be calculated by 10,11, 16
2341.67 3476.67 / / ( 1.925) / ( 2.455)
/ 2 5 2
4575
exp( 3) 10
25.08
4.25 10 25.08
4.25 10
(3.01 (1.79 10 T) (1.54 10 T )) 10
AE T T AE N N N N C T C C C γ α γ γ α γ ε γ ε γ ′ ′ − − ′ − − ′ − − = − + ⋅ = + = + = + ⋅ − ⋅ ⋅ (5)
where, γAE is the activity coeficient of nitrogen, which can
be calculated by 22
0.9
0.35
-(0.054 - 0.127 0.047
0.083 0.027 - 0.011 )
AE Cmo Ccr
Cmn Cw Cni Cal
γ = × × + ×
+ × + × × (6)
where, Ci is the wt.% of i element.
2.3. Hardness regression model
The hardness could be calculated by the experimental regression equation 5,7
1 2 3
1 1 1
n n n
st x x y cy z nz
x y z
HV HV a C bξ cξ
===
= +∑ +∑ +∑ (7)
where, HV is the Vickers Hardness, HVst is the Vickers Hardness of the substrate, Cx is the chemical compositions, ξcy is the iron-carbon phase compositions, ξnz is the
Fe-N phase compositions, and ax(x = Si, Mn, Ni and Cr),
by(y = M, B, A and F), cZ (z = ε, γʹ) are the corresponding weighting coeficients, which obtained by literature 23-25
and experimental data. The values of coeficients are listed in Table 1.
2.4. Diffusion/Transformation coupled program
The diffusion equation and transformation equation were linked by the effective diffusional coeficients, which could be given by the mixture law 5,6
i
N N i
D =∑D ξ (8)
where, for each single phase, i = 1(ε), 2(γʹ), 3(α), Di N is
diffusivity in various Fe-N phases, ξi is volume fraction
of various Fe-N phase. The diffusivity of nitrogen in different Fe-N phase could be approximately expressed in an Arrhenius form 10,11,16,17
(
)
(
)
(
)
7 9 86.6 10 exp 77820
1.675 10 exp 64000
2.1 10 exp 93517
N al N al N al D RT D RT D RT α α γ γ ε ε η η η − ′ ′ − − = × − = × − = × − (9)
where, ηα al, η
γʹ al and η
ε
al are the alloy coeficients, which can
be determined by the formula 16
[
]
exp (% )n Ti
al Bi AE
η = ∑ (10)
where (%AE) is the concentration of the alloying element in the steel, Bi and ni, are coeficients determined on the
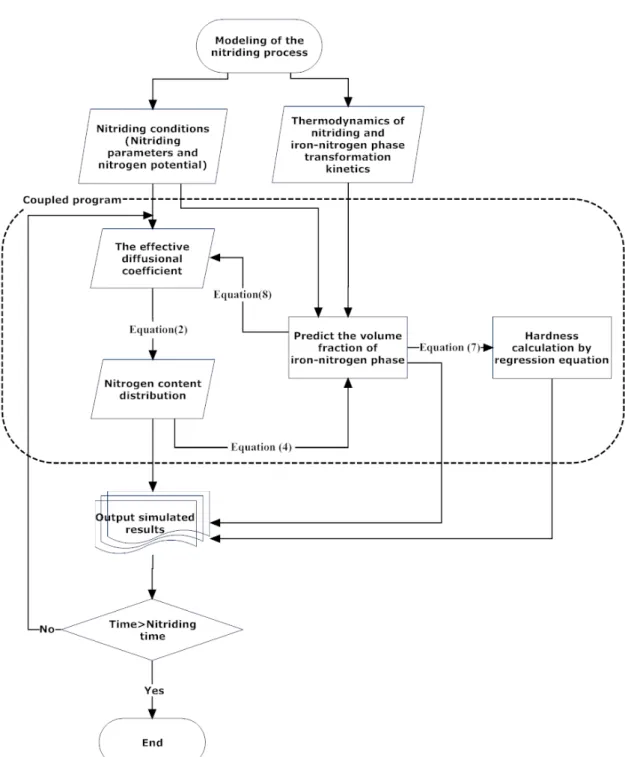
basis of experimental data on the thickness of the nitrided layer in binary alloys. The lowchart of coupled program is shown in Fig. 2. In the present program, the diffusion and transformation are calculated respectively. On the one hand, the effective diffusion coeficients are changed with the iron-nitrogen phase fraction by equation (8); On the other hand, the iron-nitrogen fraction can be recalculated by equation (4).
3. Results and discussions
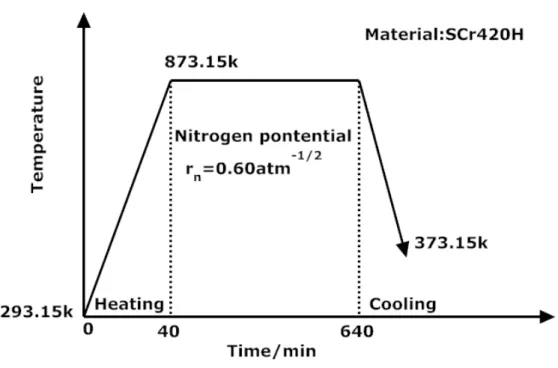
In order to validate model, the diffusion/transformation coupled model is applied to predict the nitriding process of SCr420H steel. The chemical compositions of specimens are listed in Table 2. The nitriding process parameters are shown in Fig. 3. Hardness measurements on cross sections and the surfaces of nitrided specimens were carried out with a Vickers hardness tester. For the determination of nitrogen contents, Electron Probe X-ray Microanalysis (EPMA) was performed on cross-sections of the specimens.
Fig. 4 depicts the evolutions of the nitrogen concentration proiles versus depth for nitriding of SCr420H steel. The proiles show the comparison between the simulated and experimental data. Although there are detailed discrepancies, it can be seen that good agreement is achieved between the numerical results and Wavelength Dispersive (WDS) measured results. It appears that the nitrogen concentration of diffusion layer is underestimated. In the present model, the distributions of nitrogen concentration depend on the effective diffusional coeficients, which are relevant to the concentration of the alloying element (equation (9) and (10)). Therefore, the assumption that the chemical elements are uniform distribution may result in inaccurate diffusional coeficient and nitrogen concentration distribution. It is found that the nitrogen concentration gradient adjacent to the surface is very steep, while away from the surface is lat. It is indicated the diffusivity of nitrogen greatly change in different depth of sample.
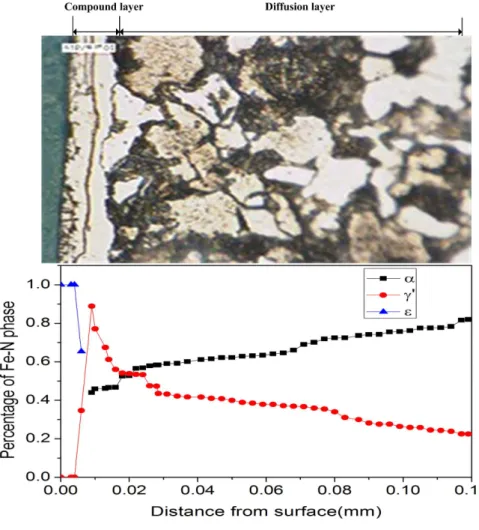
In Fig. 5, the volume fractions of the different hardening phase are shown in SCr420H steel. It can be seen that the nitride layer is composed of the thinner compound layer (γʹ + ε) and inner diffusion layer (α + γʹ). The simulated depth distributions of γʹ and ε – Fe2–3N phases are reasonable consistent with the X-ray diffraction (XRD) phase analysis results 19 and optical micrograph. The formation of γʹ phase
subzone in the inner part of the compound zone may
Table 1 - The values of coeficients for hardness calculation
Coeficients HVst asi aMn aNi aCr bM bF bB bA Cɛ Cγʹ
Values (HV) 196 27 11 8 16 745 212 632 201 983 886
Table 2 - Chemical composition of SCr420H steel
Chemical elements Fe C Si Mn Cr P S N Mo
Fig. 2 The lowchart of the diffusion/transformation coupled program.
upset the balance of the nitrogen concentration between the diffusion zone and the compound zone, and may as a consequence have an inluence upon the kinetics of the diffusion zone growth. The volume fraction of Fe-N phases is corresponding to the nitrogen concentration (Fig. 4). At the outer section, the nitrogen concentration is relatively high. At the inner section, nitrogen concentration is decreased rapidly to a lower value.
The hardness proiles after nitriding are calculated by experimental regression equation (4) and shown in Fig. 6
Fig. 3 A schematic illustration for nitriding process in SCr420H steel.
Fig. 5 Volume fraction of the Fe-N phase in SCr420H steel.
4. Conclusions
In this paper, a diffusion/transformation coupled model has been developed to simulate nitrogen concentration distributions, iron-nitrogen phase formation and hardness by combining nitrogen diffusion and Fe-N phase composition calculation. The model is implemented to simulate nitriding process of SCr420H steel. The simulated results indicate the nitrogen concentration proiles, volume fraction of Fe-N phases and hardness distributions can be predicted quantitatively by this model. Moreover, the simulated results are in reasonable agreement with the experimentally measured ones and theoretical analysis. It shows the
possibility of utilizing the model to improve the nitriding process parameters.
Acknowledgements
This research receives ongoing support from the High-tech Research Center and Open Research Center at the Saitama Institute of Technology, and sponsored by Natural Science Foundation of Tianjin (No. 13JCYBJC38900), National Natural Science Foundation of China (Project 51301121), Scientific Research Starting Foundation of Tianjin University of Technology and Education (No. KYQD12008) and Innovation Team Training Plan of Tianjin Universities and colleges (Grant No. TD12-5043).
References
1. Pye D. Practical nitriding and ferritic nitrocarburizing. Materials
Park, OH: ASM International; 2003.
2. Sun Y, Bell T. A numerical model of plasma nitriding of low alloy steels. Materials Science & Engineering A. 1997;224(1): 33-47.doi:10.1016/S0921-5093(96)10561-X
3. Goune M, Belmonte T, Fiorani JM, Chomer S, Michel H.
Modelling of diffusion–precipitation in nitrided alloyed iron.
Thin Solid Films. 2000;377-378:543-549.doi:10.1016/S0040-6090(00)01305-5
4. Belmonte T, Gouné M, Michel H. Numerical modeling of
interstitial diffusion in binary systems: Application to iron nitriding. Materials Science & Engineering A. 2001;302(2): 246-57.
5. Liu CC, Ju DY, Inoue T. A numerical modeling of
metallo-thermo-mechanical behavior in both carburized and carbonitrided
quenching processes. ISIJ International. 2002;42(10): 1125-1134.doi:10.1016/S0924-0136(03)00378-9
6. Ju DY, Liu CC, Inoue T. Numerical modeling and simulation of
carburized and nitrided quenching process. Journal of Materials Processing Technology. 2003;143-144:880-885.doi:10.1016/ S0924-0136(03)00378-9
7. Krukovich MG. Simulation of the nitriding process. Metal Science and Heat Treatment. 2004;46(1):25-31.
8. Kamminga JD, Janssen GC. Calculation of nitrogen depth profiles in nitrided Fe-Mn and Fe-V. Surface & Coatings Technology. 2006;200(20):909-912.
9. Kamminga JD, Janssen GC. Calculation of nitrogen depth profiles in nitrided multi-component ferritic steel. Surface & Coatings Technology. 2006; 200(20-21): 5896-5901.doi:10.1016/j. surfcoat.2005.09.002
10. Keddam M. Surface modification of the pure iron by the pulse plasma nitriding: Application of a kinetic model. Materials Science & Engineering A. 2007;462(1): 169-173. doi:10.1016/j. msea.2006.02.459
11. Cavaliere P, Zavarise G, Perillo M. Modeling of carburizing
and nitriding processes. Computational Materials Science. 2009;46(1): 26-35.
12. Yang M, Yao B, Sohn YH, Sisson Jr RD. Simulation of the
ferritic nitriding proces. International Heat Treatment and Surface Engineering. 2011;5(3):122-126. DOI: http://dx.doi. org/10.1179/174951411X12956208225186
13. Yang M, Zimmerman C, Donahue D, Sisson Jr RD. Modeling the gas nitriding process of low alloy steels. Journal of Materials Engineering and Performance. 2013;22(7):1892-1898.
14. Wriedt HA, Gokcen NA, Nafziger RH. The Fe-N (Iron-Nitrogen)
system. Bulletin of Alloy Phase Diagrams. 1987;8:355-377.
15. Voorthuysen EH, Boerma DO, Chechnin NC. Low-temperature
extension of the lehrer diagram and the iron-nitrogen phase diagram. Metallurgical and Materials Transactions A.
2002;33(8):2593-2598.
16. Lakhtin YU. Diffusion foundations of the nitriding process.
Metal Science and Heat Treatment. 1995;37(7):276-279. 17. Somers MA, Mittemeijer EJ. Layer-growth kinetics on gaseous
nitriding of pure iron: Evaluation of diffusion coefficients for nitrogen in iron nitrides. Metallurgical and Materials Transactions A. 1995;26(1):57-74.
18. Hernandez M, Staia MH, Puchi-Cabrera ES. Evaluation of
microstructure and mechanical properties of nitrided steels.
Surface & Coatings Technology. 2008;202(10):1935-1943. doi:10.1016/j.surfcoat.2007.08.018
19. Ratajski J. Relation between phase composition of compound
zone and growth kinetics of diffusion zone during nitriding of
steel. Surface & Coatings Technology. 2009; 203(16):2300-2306.DOI: 10.1016/j.surfcoat.2009.02.021
20. Somers MA. Development of compound layer during nitriding and nitrocarburising; current understanding and future challenges.
International Heat Tretament and Surface Engineering. 2011;5(1):7-16.
21. Crank J. The mathematics of diffusion. Oxford: Clarendon Press; 1956.
22. Lakhtin YU, Kogan YA, Bulgach AA. Effect of alloying elements on the thermodynamic activity and solubility of nitrogen in phases of a nitrided case. Metal Science and Heat Treatment. 1982;24(4):15-18.
23. Yakhnina VD, Nikitin VV. Development of the hardness of the nitrided case. Metal Science and Heat Treatment. 1975;17(1-2):125-128.
24. Lakhtin YU, Kogan YA, Sharlat ES. Nitriding of low- and medium-carbon steels surface-alloyed with nitride-forming elements. Soviet Materials Science. 1976; 13(5):514-517. 25. Glushchenko VN, Goryushin VV, Kondrashova GA, Duka