www.soil-journal.net/1/103/2015/ doi:10.5194/soil-1-103-2015
© Author(s) 2015. CC Attribution 3.0 License.
SOIL
Coupled cellular automata for frozen soil processes
R. M. Nagare1,*,**, P. Bhattacharya2,**, J. Khanna3,**, and R. A. Schincariol1
1Department of Earth Sciences, The University of Western Ontario, London, Canada
2Department of Geosciences, Princeton University, Princeton, USA
3Atmospheric and Oceanic Sciences, Princeton University, Princeton, USA
*now at: WorleyParsons Canada Services Ltd., Edmonton, Canada
**These authors contributed equally to this work.
Correspondence to:R. M. Nagare ([email protected])
Received: 4 May 2014 – Published in SOIL Discuss.: 21 May 2014 Revised: – – Accepted: 26 August 2014 – Published: 14 January 2015
Abstract. Heat and water movement in variably saturated freezing soils is a strongly coupled phenomenon. The
coupling is a result of the effects of sub-zero temperature on soil water potential, heat carried by water moving un-der pressure gradients, and dependency of soil thermal and hydraulic properties on soil water content. This study presents a one-dimensional cellular automata (direct solving) model to simulate coupled heat and water transport with phase change in variably saturated soils. The model is based on first-order mass and energy conservation principles. The water and energy fluxes are calculated using first-order empirical forms of Buckingham–Darcy’s law and Fourier’s heat law respectively. The liquid–ice phase change is handled by integrating along an experi-mentally determined soil freezing curve (unfrozen water content and temperature relationship) obviating the use of the apparent heat capacity term. This approach highlights a further subtle form of coupling in which heat car-ried by water perturbs the water content–temperature equilibrium and exchange energy flux is used to maintain the equilibrium rather than affect the temperature change. The model is successfully tested against analytical and experimental solutions. Setting up a highly non-linear coupled soil physics problem with a physically based approach provides intuitive insights into an otherwise complex phenomenon.
1 Introduction
Variably saturated soils in northern latitudes undergo re-peated freeze–thaw cycles. Freezing reduces soil water po-tential considerably because soil retains unfrozen water (Dash et al., 1995). The resulting steep hydraulic gradients move considerable amounts of water upward from deeper warmer soil layers which accumulates behind the freezing front. The resulting redistribution of water alters soil ther-mal and hydraulic properties, and transports heat from one soil zone to another. As water freezes into ice, the latent heat maintains soil temperatures close to 0◦C for long pe-riods of time. The water and energy redistribution has sig-nificant implications for regional hydrology, infrastructure and agriculture. Understanding the physics behind this com-plex coupling remains an active area of research. Field stud-ies have been widely used to better understand the
and during special conditions such as infiltration into frozen soils have been reported recently (e.g. Dall’Amico et al., 2011).
Although the coupling of heat and water movement in variably saturated freezing soils is complex, fundamental laws of heat and water movement coupled with principles of energy and mass conservation are able to explain the physics to a large extent. There is a paradigm shift in modelling of water movement in variably saturated soils using physi-cally based approaches. For example, HydroGeoSphere and Parflow (Brunner and Simmons, 2012; Kollet and Maxwell, 2006) are examples of codes that explicitly use Richard’s equation to model subsurface flow. Thus, the use of de-rived terms such as specific yield is not required. Mendicino et al. (2006) reported a three-dimensional (3-D) CA (cel-lular automata; direct solving) model to simulate moisture transfer in the unsaturated zone. Cervarolo et al. (2010) ex-tended the application of this CA model by coupling it with a surface–vegetation–atmosphere-transfer scheme to simu-late water and energy flow dynamics. Direct solving allows for unstructured grids while describing the coupled processes based on first-order equations. Use of discrete first-order for-mulations allow one to relax the smoothness requirements for the numerical solutions being sought. This has advantages, particularly in large-scale models, wherein use of relatively coarse spatial discretization may be feasible. Therefore, it is important to expand the application of direct solving to fur-ther complicated unsaturated soil processes.
This study presents a coupled CA model to simulate heat and water transfer in variably saturated freezing soils. The system is modelled in terms of the empirically observed heat and mass balance equations (Fourier’s heat law and Buckingham–Darcy equation) and using energy and mass conservation principles. The liquid–ice phase change is han-dled with a total energy balance including sensible and latent heat components. In a two-step approach similar to that of Engelmark and Svensson (1993), the phase change is brought about by the residual energy after sensible heat removal has dropped the temperature of the system below freezing point. Knowing the amount of water that can freeze, the change in soil temperature is then modelled by integrating along the soil freezing curve. To our knowledge, coupled cellular au-tomata have not yet been used to explore simultaneous heat and water transport in frozen variably saturated porous me-dia. The model was validated against the analytical solu-tions of (1) the heat conduction problem (Churchill, 1972), (2) steady state convective and conductive heat transport in unfrozen soils (Stallman, 1965), (3) unilateral freezing of a semi-infinite region (Lunardini, 1985), and (4) the exper-imental results of freezing-induced water redistribution in soils (Mizoguchi, 1990).
2 Cellular automata
Cellular automata were first described by von Neumann in 1948 (see von Neumann and Burks, 1966). The CA describe the global evolution of a system in space and time based on a predefined set of local rules (transition rules). Cellular au-tomata are able to capture the essential features of complex self-organizing cooperative behaviour observed in real sys-tems (Ilachinski, 2001). The basic premise involved in CA modelling of natural systems is the assumption that any het-erogeneity in the material properties of a physical system is scale dependent and there exists a length scale for any sys-tem at which material properties become homogeneous (Hutt and Neff, 2001). This length scale characterizes the construc-tion of the spatial grid cells (elementary cells) or units of the system. There is no restriction on the shape or size of the cell with the only requirement being internal homogeneity in material properties in each cell. One can then recreate the spatial description of the entire system by simple repetitions of the elementary cells. The local transition rules are results of empirical observations and are not dependant on the scale of homogeneity in space and time. The basic assumption in traditional differential equation solutions is of continuity in space and time. The discretization in models based on tradi-tional numerical methods needs to be over grid spacing much smaller than the smallest length scale of the heterogeneous properties making solutions computationally very expensive. The CA approach is not limited by this requirement and is better suited to simulate spatially large systems at any res-olution, if the homogeneity criteria at elementary cell level are satisfied (Ilachinski, 2001; Parsons and Fonstad, 2007). In fact, in many highly non-linear physical systems such as those describing critical phase transitions in thermodynam-ics and the statistical mechanical theory of ferromagnetism, discrete schemes such as cellular automata are the only sim-ulation procedures (Hoekstra et al., 2010).
On the contrary, explicit schemes like CA are not uncondi-tionally convergent and hence given a fixed space discretiza-tion, the time discretization cannot be arbitrarily chosen. An-other limitation of the CA approach was thought to be the need for synchronous updating of all cells for accurate simu-lations. However, CA models can be made asynchronous and can be more robust and error resistant than a synchronous equivalent (Hoekstra et al., 2010).
The following section (Sect. 2.1) describes a 1-D CA in simplified, but precise mathematical terms. It is then ex-plained with an example of heat flow (without phase change) in a hypothetical soil column subjected to a time varying tem-perature boundary condition.
2.1 Mathematical description
LetSit be a discrete state variable which describes the state of the ith cell at time step t. If one assumes that an
the system spatially, then the complete macroscopic state of the system is described by the ordered Cartesian prod-uctS1t⊗St2⊗. . .⊗Sti⊗. . .⊗SNt at timet. Let a local tran-sition ruleφbe defined on a neighbourhood of spatial indi-cial radiusr, φ:Sit
−r⊗S t
i−r+1⊗. . .⊗S t i+r→S
t+1
i , whereiǫ
[1+r,N−r]. The global state of the system is defined by some global mapping,χ:S1t⊗S2t⊗. . .⊗Sit⊗. . .⊗SNt →Gt, whereGt is the global state variable of the system defining the physical state of the system at timet. Given this algebra of the system,Gt+1is given by
Gt+1= (1)
χ ϕ ωt1⊗ϕ ωt2⊗. . .⊗ϕ ωti⊗. . .⊗ϕ ωtN,
whereωti=S1t −r⊗S
t
i−r+1⊗. . .⊗S t
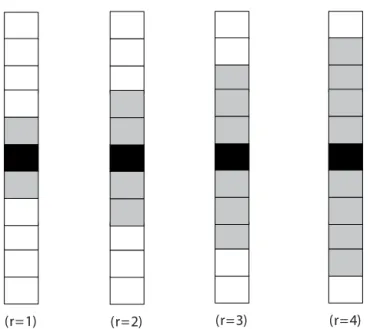
i+r. The quantityris gen-erally called the radius of interaction and defines the spatial extent on which interactions occur on the local scale. In the case of the 1-D CA, the only choice of neighbourhood which is physically viable is the standard von Neumann neighbour-hood (Fig. 1).
2.2 Physical description based on a heat flow problem in a hypothetical soil column
Let us consider the CA simulation of heat flow in a soil
col-umn of length Lc and a constant cross-sectional area. The
temperature change in the column is driven by a time vary-ing temperature boundary condition applied at the top. It is assumed that no physical variation in the soil properties exist in the column at length intervals smaller than1x. Each cell in the 1-D CA model can therefore be assumed to be of length
1x. Therefore, the column can be discretized usingLc/1x
elementary cells. To simulate the spatio-temporal evolution of soil temperature in the column, an initial temperature for each elementary cell has to be set. To study the behaviour of the soil column under external driving (time varying tem-perature), a fictitious cell is introduced at the top and/or the bottom of the soil column and subjected to time varying tem-peratures. The transition rules need to be defined now. Once the transition rules of heat exchange between neighbours are defined, the fictitious boundary cells interact with the top and/or bottom cells of the soil column as any other internal cell based on the prescribed rules and the predefined temper-ature time series. Although the same set of rules govern inter-action among all cells of the column, heat exchange cannot affect the temperature of the fictitious cells as that would cor-rupt the boundary conditions. This is handled by assigning infinite specific heats to the fictitious cells. This allows evo-lution of the internal cells and the boundary cells according to the same mathematical rules/empirical equations. The pre-ceding mathematical description of the CA algebra is based on the assumption that the state variable defining each cell is discrete in space and time. But soil temperatures are con-sidered to be continuous in space and time. The continuous description of the soil temperature can be adapted to the CA
(r=2)
(r=1) (r=3) (r=4)
Figure 1.One-dimensional cellular automata grids based on the von Neumann neighbourhood concept. How many neighbours (grey cells) interact with an active cell (black) is controlled by the indicial radius (r).
scheme by considering small time intervals over which the temperature variations are not of interest and hence for all practical purposes can be assumed constant. Conditions for convergence of the numerical temperature profile set an up-per limit on the size of this time interval for a given value of
1x. Therefore, once the length scale of homogeneity1xin
the system and the local update rules have been ascertained, the CA is ready for simulation under the given initial and boundary conditions. Equations (2) and (3) (Sect. 3), applied sequentially, would be the local update rules for this simple case of heat flow in a soil column (without phase change) driven by time varying temperatures at the top.
The meaning of the terms used in the mathematical de-scription of CA can now be explained with respect to the heat flow simulation for the hypothetical soil column:Sit is the temperature of theith cell at timet,r=1,φis a sequen-tial application of Eqs. (2) and (3) describing heat loss/gain by a cell due to temperature gradients with its two nearest neighbours and temperature change due to the heat loss/gain respectively, andχis the identity mapping.
3 Coupled heat and water transport in variably
saturated soils
qh= i+1
X
ζ=i−1 λi,ζ·
Tζ−Ti li,ζ
, ζ6=i, (2)
where subscriptsiandζrefer to the cell and its active neigh-bours, qh is the net heat flux (J s−1m−2) for the ith cell, T is cell temperature (◦C),λi,ζ is average effective thermal conductivity of the region between theith and theζth cells (J s−1m−1◦C−1), andli,ζ is the distance between the centres of theith and theζth cells (m). Effective thermal conductiv-ity can be calculated using one of the popular mixing mod-els (e.g. Johansen, 1975; Campbell, 1985). The empirical re-lationship between heat flux from Eq. (2) and the resulting change in cell temperature (1Ti =Tit+1t−Tit)is given as
Qh,i= qh·1t
li =
Ci·1Ti, (3)
whereli is the length of the cell (m) andCi (J m−3◦C−1)is the effective volumetric heat capacity of the cell such that
Ci=Cwθw+Ciceθice+Csθs+Caθa, (4)
whereθ is volumetric fraction (m3m−3)and subscripts w, ice, s, and a represent water, ice, soil solids and air fractions. The mass conservation equation in 1-D can be written as
ρw· 12
1t +ρw· qw
li +
ρw·Ss=0, (5)
2=θw+ ρice
ρw
θice, (6)
whereρ is density (kg m−3),2is the total volumetric
wa-ter content (m3m−3), qw is the Buckingham–Darcy flux
(m s−1), andSsis sink/source term. In unfrozen soils,θice=
0 and2=θw.
Buckingham–Darcy’s equation is used to describe the flow of water under hydraulic head gradients wherein it is recog-nized that the soil matric potential (ψ )and hydraulic con-ductivity (k)are functions of liquid water content (θw). The
dependency of ψ andk onθw can be expressed as a
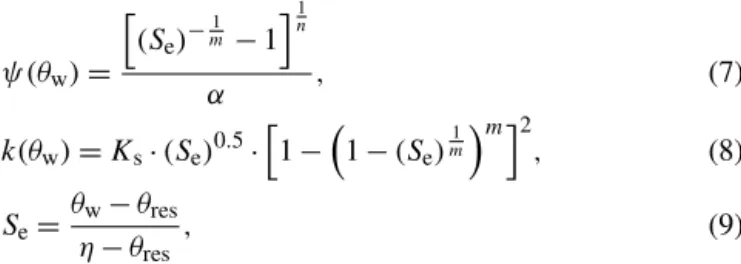
con-stitutive relationship. The concon-stitutive relationships proposed by Mualem–van Genuchten (van Genuchten, 1980) defining ψ (θw)andk(θw)are used in this study:
ψ (θw)=
h
(Se)−
1
m−1
i1
n
α , (7)
k(θw)=Ks·(Se)0.5·
h
1−1−(Se)
1
m mi2
, (8)
Se=
θw−θres η−θres
, (9)
whereθres (m3m−3)is the residual liquid water content, η (m3m−3)is total porosity, Ks (m s−1)is the saturated hy-draulic conductivity, andα(m−1),nandmare equation con-stants such thatm=1−1/n. For an elementary cell in a 1-D
CA model, the Buckingham–Darcy flux in its simplest form can be written as
qw= i+1
X
ζ=i−1 ki,ζ·
(ψ+z)ζ−(ψ+z)i li,ζ
, ζ6=i, (10)
where all subscripts have the same meaning as introduced so far,zis the cell elevation andkrepresents the average hy-draulic conductivity of the region between theith and theζth cells. In this study, phase change and associated temperature change is brought about by integrating along a soil freezing curve (SFC). SFCs can be defined because the liquid water content in frozen soils must have a fixed value for each tem-perature at which the liquid and ice phases are in equilibrium, regardless of the amount of ice present (Low et al., 1968). Soil freezing curves for different types of soils developed from field and laboratory observations between liquid wa-ter content and soil temperature have been widely reported (e.g. Anderson and Morgenstern, 1973; Stähli and Stadler, 1997). Van Genuchten’s model can be used to define a SFC (Eq. 7), whereinψ (θw)is replaced withT (θw), andn,mand α(◦C−1)are equation constants.
4 The coupled CA model
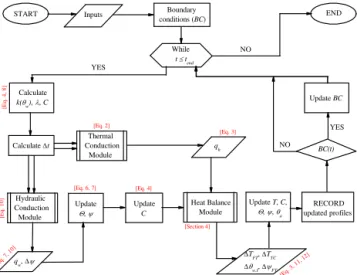
Figure 2 shows a flow chart describing the algorithm driving
the coupled CA code. The code was written in MATLAB®.
Let the superscriptt denote the present time step and
sub-scriptibe the spatial index across the grid where each node represents centres of the cell. The thermal conduction and hydraulic conduction modules represent two different algo-rithms that calculate the net heat (qh,i)and water (qw,i)fluxes respectively across theith cell. In essence, the thermal con-duction and hydraulic concon-duction codes run simultaneously and are not affected by each other in the same time step. However, the processes are not independent and are coupled through updating of model parameters and state variables at the end of each time step. Hydraulic conduction is achieved by applying Eq. (10) to each elementary cell using the hy-draulic gradients between it and its immediate neighbours (r=1). Similarly, Eq. (2) is used to calculate the heat flux between each elementary cell and its immediate neighbours using the corresponding thermal gradients. The change in mass due to the fluxqw,iis used to obtain change in pressure head (1ψi=ψit+1t−ψit)from theψ (θw)relationship. The updated value of total water content is then used to update
the volumetric heat capacityCi (Eq. 4). The updated value
ofCi is used as an input to the energy balance module along with computed heat fluxqh,i. This represents the first stage of coupling between hydraulic and thermal processes. The energy balance module computes the total change in ice and water content due to phase change, and the total temperature
change (1Ti)due to a combination of thermal conduction
[Eq. 3, 1
1, 1 2] [Section 4]
[Eq. 3]
[Eq. 4] [Eq. 6, 7]
[E q . 4 , 8 ] [Eq. 7, 1
0] [E q . 1 0 ] [Eq. 2] NO YES NO END START YES
qw, ∆
∆TFT, ∆TTC
∆ w,I, ∆FT
While
t tend
Boundary conditions (BC) Inputs
Calculate ∆t BC(t)
Hydraulic Conduction Module
qh
Update
C
Update T, C,
, , a Thermal Conduction Module Update , Heat Balance Module
Update BC
RECORD updated profiles Calculate
k(
w), , C
Figure 2.Flow chart describing the algorithm driving the coupled CA code. Subscripts TC, HC and FT refer to changes in physi-cal quantities due to thermal conduction, hydraulic conduction and freeze–thaw processes respectively. Hydraulic conduction and ther-mal conduction are two different CA codes coupled through up-dating of volumetric heat capacity and the freeze–thaw module to simulate the simultaneous heat and water movement in soils. Cor-responding equations or sections containing module description are shown in red text in squared brackets.
The energy balance module is explained using an exam-ple of a system wherein the soil temperature is dropping and phase change may take place if cell temperature drops be-low the freezing point of pure water (Tfw=0◦C). Inside the energy balance module, the change in temperature (1Ti)is calculated using Eq. (3) and values ofCi andQh,iassuming that only thermal conduction takes place. If the computed 1Ti for a given cell is such that Tit+1t≥Tfw, then water cannot freeze; cell temperatures are updated without phase change and the code moves into the next time step. In the approach of this study, phase change and associated temper-ature change can occur if and only if the present cell tem-perature (Ti)and water content (θw,i)represent a point on the SFC. This point along the SFC (Fig. 3) is defined here as the critical state point (Tcrit,θwcrit). If1TigivesTit+1t<Tfw for any cell, then freezing point depression along the SFC accounts for change in temperature due to freeze–thaw. The freezing point depression or Tcrit is defined for the cell by comparing the cellθw,i with the SFC. However, the coupled nature of heat and water transport in soils perturbs the crit-ical state from time to time, e.g. when freezing induces wa-ter movement towards the freezing front or infiltration into frozen soil leads to accumulation or removal of extra wa-ter from any cell. In such a case, Qh,i needs to be used to bring the cell to the critical state. This may require thermal conduction without phase change (Tcrit>Ti)or freezing of water without temperature change (Tcrit<Ti). This process gives us an additional change in temperature or water
con--5 -4 -3 -2 -1 0 1 2 3
0.0 0.1 0.2 0.3 0.4 0.5 0.6 0.7 0.8 0.9 1.0 U n fr o z e n w a te r c o n te n t (m 3 m -3 )
Temperature (°C) (Tcrit,
wcrit)
(Tnew) d
w
critical state point for a given
w,i
Figure 3.Graphical description of the phase change approach used in this study. The curve is a soil freezing curve for a hypothetical soil. The change in water content (dθw)due toQres,i is used to
determineTnewby integrating along the SFC (Eq. 11).
tent which is purely due to the fact that the additional water accumulation disturbs the critical state. This is another and a subtle form of coupling between heat and water flow. Be-cause of the above consideration to perturbation of critical state caused by additional water added/removed from a cell, infiltration into frozen soils during the over-winter or spring melt events need no further modifications to the process of water and heat balance.
IfQh,i is such that a cell can reach critical state and still additional heat needs to be removed, then this additional heat (Qres,i)removal leads to the freezing of water. The freezing of water leads to change in the temperature of the cell such that
min
θw,i, Qres,i
Lf
=
TZnew,i
Tcrit
dθw,i, (11)
general-ized Clausis–Clapeyron equation by assuming zero ice gauge pressure:
Lf· 1Ti Ti+273.15=
g·19i, (12)
whereg is acceleration due to gravity (9.81 m s−2). At the end of the energy balance calculations, temperatures of all
the cells are updated using the1Ti computed in the energy
balance module. Water content for each cell is updated by considering the change due to freeze/thaw inside the energy balance module andqw,i. Hydraulic conductivity of each cell is updated (Eq. 8) using the final updated values of water content. Pressure and total heads in each cell are updated considering water movement (Eq. 7) and freezing/thawing (Eq. 12). The volumetric heat capacity of each cell is up-dated one more time (Eq. 4) to incorporate the changes due to freeze/thaw inside the energy balance module. Thermal conductivity of each cell is updated using a mixing model (e.g. Johansen, 1975). This completes all the necessary up-dates and the model is ready for computations of the next time step.
The CA scheme described here is not unconditionally con-vergent. Hence, the size of the time step cannot be arbitrarily chosen. In our implementation of the CA model, adaptive time stepping has been achieved following the convergence analysis reported in Appendix A.
5 Comparison with analytical solutions
5.1 Heat transfer by pure conduction
The ability of the CA model to simulate pure conduction under hydrostatic conditions was tested by comparison to the analytical solution of one-dimensional heat conduction in a finite domain given by Churchill (1972). A soil column with total length (Lc)of 4 m was assumed to have differ-ent initial temperatures in its upper (Tu=10◦C) and lower (Tl=20◦C) halves (Fig. 4). The system is hydrostatic at all times and there is no flow. At the interface, heat conduction due to the temperature gradient will occur until the entire
do-main reaches an average steady state temperature of 15◦C.
The analytical solution given by Churchill (1972) can be ex-pressed as
T (z, t )=Tu·
"
0.5+π2 ∞
X
n=1
(−1)n−1
2n−1 (13)
·cos
(2n−1)·π·z Lc
·exp − (
2n−1)·π Lc 2 · λ C ·t !#
+Tl·
"
0.5−2
π ∞
X
n=1
(−1)n−1 2n−1 ·cos
(
2n−1)·π·z Lc
·exp − (
2n−1)·π Lc 2 · λ C ·t !# .
The parameters used in analytical examples for
Churchill (1972), and the CA code are given in Ta-ble 1. There is excellent agreement between the analytical solution and the CA simulation (Fig. 4).
5.2 Heat transfer by conduction and convection
Stallman’s analytical solution (1965) to the subsurface tem-perature profile in a semi-infinite porous medium in response to a sinusoidal surface temperature provides a test of the CA model’s ability to simulate one-dimensional heat convec-tion and conducconvec-tion in response to a time varying Dirichlet boundary.
Given the temperature variation at the ground surface de-scribed by
T (z0, t )=Tsurf+A·sin
2·π·t τ
, (14)
the temperature variation with depth is given by
T (z, t )=Ae−a·z·sin
2·π·t
τ −b·z
+T∞, (15)
a=
"π Cρ
λτ
2 +1
4
q
fCwρw 2λ
4#0.5
(16)
+1 2
q
fCwρw 2λ
2)0.5 −
q
fCwρw 2λ , b=
"π Cρ
λτ
2 +1
4
q
fCwρw 2λ
4#0.5
(17)
+1 2
qfCwρw 2λ
2)0.5 ,
whereAis the amplitude of temperature variation (◦C),Tsurf is the average surface temperature over a period ofτ (s),T∞ is the initial temperature of the soil column and temperature at infinite depth, andqfis the specific flux through the col-umn top.
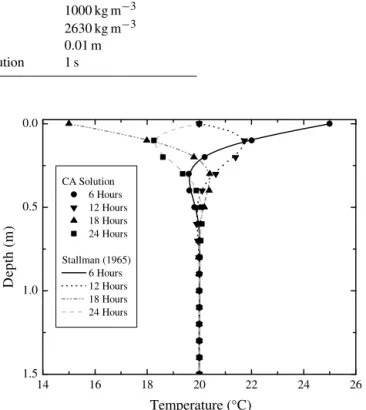
The parameters used in analytical examples for Stall-man (1965), and the CA code are given in Table 2. The cou-pled CA code is able to simulate the temperature evolution due to conductive and convective heat transfer as seen from the excellent agreement with the analytical solution (Fig. 5).
5.3 Heat transfer with phase change
Table 1. Simulation parameters for heat conduction problems. Analytical solution for this example is given by Eq. (13) as per Churchill (1972).
Symbol Parameter Value
η porosity 0.35
λ bulk thermal conductivity 2.0 J s−1m−1◦C−1
Cw volumetric heat capacity of water 4 174 000 J m−3◦C−1
Cs volumetric heat capacity of soil solids 2 104 000 J m−3◦C−1
ρw density of water 1000 kg m−3
ρs density of soil solids 2630 kg m−3
l length of cell 0.01 m
t length of time step in CA solution 1 s
4.0 3.5 3.0 2.5 2.0 1.5 1.0 0.5 0.0
10 12 14 16 18 20
5 Days 10 Days 20 Days 50 Days 75 Days 189 Days
Temperature (°C)
D
e
p
th
(
m
)
10 °C
20 °C
Figure 4. Comparison between the analytical solution given by Churchill (1972) and coupled cellular automata model simulation for a perfectly thermally insulated 4 m long soil column. Lines rep-resent the analytical solution and symbols reprep-resent the CA solution for time points as shown in the legend. The initial temperature dis-tribution is shown on the right.
initially unfrozen soil column with timet. The soil column is divided into three zones (Fig. 6a) where zone 1 is fully frozen with no unfrozen water; zone 2 is “mushy” with both ice and water; and zone 3 is fully thawed. The Lunardini (1985) so-lution as described by McKenzie et al. (2007) is given by following set of equations:
T1=(Tm−Ts)·
erf( x
2√D1t)
erf(ϑ ) +Ts, (18)
T2=(Tf−Tm)·
erf x
2√D4t
−erf(γ )
erf(γ )−erfϑ
q
D1 D4
+Tf, (19)
1.5 1.0 0.5 0.0
14 16 18 20 22 24 26
CA Solution 6 Hours 12 Hours 18 Hours 24 Hours
Stallman (1965) 6 Hours 12 Hours 18 Hours 24 Hours
Temperature (°C)
D
e
p
th
(
m
)
Figure 5.Comparison between the analytical (Stallman, 1965) and coupled CA model steady state solutions for conductive and convec-tive heat transfer. The soil column in this example is infinitely long, initially at 20◦C, and the upper surface is subjected to a sinusoidal temperature with amplitude of 5◦C and period of 24 h.
T3=(T0−Tf)· −erfc
x (2√D3t)
erfγ
q
D4 D3
+T0, (20)
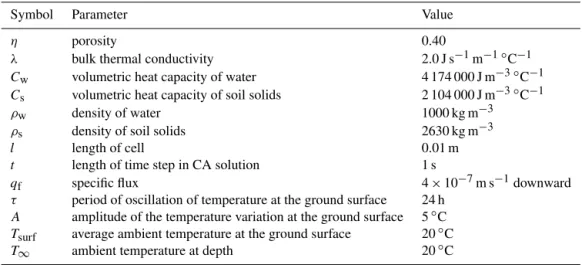
Table 2.Simulation parameters for predicting the subsurface temperature profile in a semi-infinite porous medium in response to a sinusoidal surface temperature. The analytical solution to this one-dimensional heat convection and conduction problem in response to a time varying Dirichlet boundary is given by Eqs. (14)–(17) as per Stallman (1965).
Symbol Parameter Value
η porosity 0.40
λ bulk thermal conductivity 2.0 J s−1m−1◦C−1
Cw volumetric heat capacity of water 4 174 000 J m−3◦C−1
Cs volumetric heat capacity of soil solids 2 104 000 J m−3◦C−1
ρw density of water 1000 kg m−3
ρs density of soil solids 2630 kg m−3
l length of cell 0.01 m
t length of time step in CA solution 1 s
qf specific flux 4×10⁻⁷m s−1downward
τ period of oscillation of temperature at the ground surface 24 h
A amplitude of the temperature variation at the ground surface 5◦C
Tsurf average ambient temperature at the ground surface 20◦C
T∞ ambient temperature at depth 20◦C
diffusivity with latent heat,D4, is defined as
D4=
λ2
C2+
γdLf1ξ Tf−Tm
, (21)
whereγdis the dry unit density of soil solids, and1ξ =ξ1− ξ3 whereξ1 andξ3 are the ratio of unfrozen water to soil solids in zones 1 and 3 respectively. For a timetin the region from 0≤x≤X1(t )the temperature isT1andX1(t )is given by
X1(t )=2ϑ
p
D1t; (22)
and fromX1(t )≤x≤X(t )the temperature isT2whereX(t ) is given by
X(t )=2γpD4t; (23)
and for x≥X(t ) the temperature isT3. The unknowns, ϑ
andγ, are obtained from the solution of the following two
simultaneous equations:
(Tm−Ts) (Tm−Tf)·
e−ϑ 21
−D1
D4
=
λ2 λ1erf(ϑ )
q
D1 D4
erf(γ )−erfϑ
q
D1 D4
, (24)
(Tm−Tf)λλ21 (T0−Tf) ·
s
D3 D4·
e−γ 21
−D4
D3
(25)
=
erf(γ )−erf
ϑ
q
D1 D4
erfcγqD4 D3
.
The verification example based on Lunardini’s (1985) ana-lytical solution used in this study is the same as that used
Figure 6.(a)Diagram showing the setting of Lunardini’s (1985) three-zone problem. Equations (18), (19), and (20) are used to pre-dict temperatures in the completely frozen zone (no phase change and sensible heat only), mushy zone (phase change and latent heat+sensible heat), and unfrozen zone (sensible heat only) re-spectively. (b) Linear freezing function used to predict unfrozen water contents for two cases used in this study (Tm= −1◦C and
Tm= −4◦C).
approxi-Table 3.Simulation parameters for predicting the subsurface temperature profile with phase change in a three-zone semi-infinite porous medium. The analytical solution to this one-dimensional problem with sensible and latent heat zones is given by Eqs. (18)–(25) as per Lundardini (1985).
Symbol Parameter Value
η porosity 0.20
λ1 bulk thermal conductivity of frozen zone 3.464352 J s−1m−1◦C−1
λ2 bulk thermal conductivity of mushy zone 2.941352 J s−1m−1◦C−1
λ3 bulk thermal conductivity of unfrozen zone 2.418352 J s−1m−1◦C−1
C1 bulk-volumetric heat capacity of frozen zone 690 360 J m−3◦C−1
C2 bulk-volumetric heat capacity of mushy zone 690 360 J m−3◦C−1
C3 bulk-volumetric heat capacity of unfrozen zone 690 360 J m−3◦C−1
ξ1 fraction of liquid water to soil solids in frozen zone 0.0782
ξ3 fraction of liquid water to soil solids in unfrozen zone 0.2
l length of cell 0.01 m
t length of time step in CA solution 1 s
Lf latent heat of fusion 334 720 J kg−1
γd dry unit density of soil solids 1680 kg m−3
Ts surface temperature at the cold end −6◦C
Tm temperature at the boundary of frozen and mushy zones −1,−4◦C
γ∗ equation parameter estimated using Eqs. (24) and (25) 1.395, 2.062
ϑ∗ equation parameter estimated using Eqs. (24) and (25) 0.0617, 0.1375
T0 initial temperature of the soil column 4◦C
∗values taken from McKenzie et al. (2007)
mate solution methods. The linear freezing function used in this study is shown in Fig. 6b and the parameters used in Lu-nardini’s analytical solution are given in Table 3. The excel-lent agreement between the analytical solution and coupled CA model simulations (Fig. 7a, b) for two different cases of Tmshows that the model is able to perfectly simulate the pro-cess of heat conduction with phase change.
6 Comparison with experimental data
Hansson et al. (2004) describe laboratory experiments of Mi-zoguchi (1990) in which freezing-induced water redistribu-tion in 20 cm long Kanagawa sandy loam columns was ob-served. The coupled CA code was used to model the experi-ment as a validation test for simulation of frost-induced wa-ter redistribution in unsaturated soils. Four identical cylin-ders, 8 cm in diameter and 20 cm long, were packed to a bulk density of 1300 kg m−3resulting into a total porosity of
0.535 m3m−3. The columns were thermally insulated from
all sides except the tops and brought to uniform temperature (6.7◦C) and volumetric water content (0.33 m3m−3). The tops of three cylinders were exposed to a circulating fluid at −6◦C. One cylinder at a time was removed from the freezing apparatus and sliced into 1 cm thick slices after 12, 24, and 50 h. Each slice was oven dried to obtain the total water con-tent (liquid water+ice). The fourth cylinder was used to pre-cisely determine the initial condition. The freezing-induced water redistribution observed in these experiments was sim-ulated using the coupled CA code. Parameters used were
sat-0 20 40 60 80 100 -6
-4 -2 0 2 4
0 20 40 60 80 100
12 hours
T
em
p
er
at
u
re
(
°
C
)
Distance (cm) (a)
24 hours 12 hours
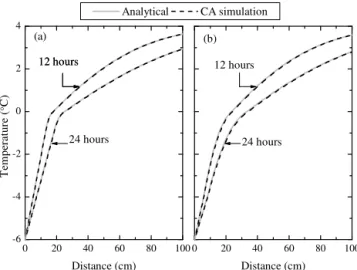
Analytical CA simulation
Distance (cm) 24 hours 12 hours (b)
Figure 7. Comparison between analytical solution of heat flow with phase change (Lunardini, 1985) and coupled CA model lutions for heat transfer with phase change. Lunardini’s (1985) so-lution is shown and compared with the CA simulation for two cases:
(a)Tm= −1◦C and(b)Tm= −4◦C (Table 3, Fig. 6).
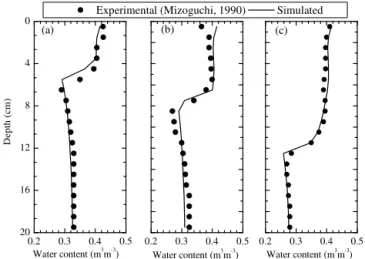
20 16 12 8 4 0
0.2 0.3 0.4 0.5
Experimental (Mizoguchi, 1990) Simulated (c) (b)
Water content (m3
m-3
) Water content (m3 Water content (m3m-3) m-3
)
(a)
0.2 0.3 0.4 0.5 0.2 0.3 0.4 0.5
D
e
p
th
(
c
m
)
Figure 8.Comparison of total water content (ice+liquid) between experimental (Mizoguchi, 1990, as cited by Hansson, 2004) and coupled CA model results:(a)12,(b)24, and(c)50 h.
the model using a heat flux boundary at the top and bottom of the columns. The heat flux at the surface and bottom was controlled by heat conductance terms multiplied by the dif-ference between the surface and ambient, and bottom and ambient temperatures respectively. Similar boundary condi-tions were used in the CA simulacondi-tions. The value of heat con-ductance at the surface was allowed to decrease non-linearly as a function of the surface temperature squared using the values reported by Hansson et al. (2004). The heat conduc-tance coefficient of 1.5 J s−1m−2◦C−1was used to simulate heat loss through the bottom. Hansson and Lundin (2006) observed that the four soil cores used in the experiment per-formed by Mizoguchi (1990) were quite similar in terms of saturated hydraulic conductivity, but probably less so in terms of the water-holding properties where more significant differences were to be expected. Such differences in water-holding capacity would result in significant differences in unsaturated hydraulic conductivities of the columns at
dif-ferent times during the freezing experiments. The simulated values of total water content agree very well with the ex-perimental values (Fig. 8). The region with a sharp drop in the water content indicates the position of the freezing front. There is clear freezing-induced water redistribution, which is one of the principal phenomena for freezing porous me-dia and is well represented in the coupled CA simulations. Mizoguchi’s experiments have been used by a number of re-searchers for validation of numerical codes (e.g. Hansson et al., 2004; Painter, 2011; Daanen et al., 2007). The CA sim-ulation shows a comparable or improved simsim-ulation for total water content as well as for the sharp transition at the freez-ing front.
7 Conclusions
Appendix A: Convergence analysis
The CA scheme described in this paper is not uncondition-ally convergent. Hence, the size of the time step cannot be arbitrarily chosen. In this section we present a detailed eval-uation of the convergence criteria of our code to address the choice of the time step.
The heat and flow convergence criteria are derived one af-ter another. We start with the heat balance portion. The local energy balance is the basic principle used in our approach. This is imposed by ensuring flux continuity of heat. The local heat balance is described by Eqs. (1) and (2) and the freeze–
thaw effect. For a 1-D CA application, assumingr=1, this
can be written as
Cili
e
Tit+1t−Teit
1t +ρwLfli
e
θwt+i1t−eθwti
1t (A1)
=λi,i+1
e
Tit+1−eTit
li +
λi,i−1
e
Tit−1−eTit li
,
where li is the uniform cell size andλi,i+1 andλi,i−1 are the average effective thermal conductivity of the region be-tween the ith, and thei+1th andi−1th cells respectively. The second term on the left-hand side of equation is the con-tribution of freeze–thaw to the thermal energy conservation.
e
Tit =Tit+eitis some approximation of the exact solution for temperatureTitat timetand cell indexigiven an approxima-tion erroreit. Similarly,eθwti=θwti+ei′t is an approximation, subject to the discretization errore′it, of the exact solution for the volumetric fraction of waterθwti. It is useful to rewrite the equation in the following simpler form in order to decouple the thermal and hydraulic processes in terms of known pa-rameters:
Cili
e
Tit+1t−Teit
1t + ρwLf
eθwt+i1t−eθwti
e
Tit+1t−eTit
!
(A2)
·li
e
Tit+1t−Teit
1t =λi,i+1
e
Tit+1−Teit
li +
λi,i−1
e
Tit−1−Teit li
.
The quantity in parentheses in the second term of the equation can be approximated asρwLfdθw/dT|T=Tit, where dθw/dT|T=Tit is the slope of the soil freezing curve at T =Tit, a known quantity. Finally, we introduce the term Ci′=Ci+ρwLfdθw/dT|T=Tt
i as apparent heat capacity, and
rewrite Eq. (A1) as
Ci′li
e
Tit+1t−Teit
1t = (A3)
λi,i+1
e
Tit +1−Te
t i
li +
λi,i−1
e
Tit −1−eT
t i li
.
Rearranging the terms, we obtain
eti+1t =eit 1−λ¯i1t
li2Ci′
!
+λi,i+11t
li2Ci′ e t
i+1 (A4)
+λi,i−11t
li2Ci′ e t i−1+
"
λi,i+11t li2Ci′ T
t i+1+
λi,i−11t l2iCi′ T
t i−1
+Tit 1−λ¯i1t l2iCi′
!
−Tit+1t
#
,
where λ¯i=λi,i−1+λi,i+1. Replacing all the error terms
by the maximum absolute error term, defined as Et=
max|eit| , we obtain
1t≤l 2 iC′i
¯
λi
. (A5)
All coefficients of error terms on the right-hand side of Eq. (A4) are either positive or zero. Given this, the up-per bound on the error at timet+1t, defined asEt+1t= max
n |eit+1t|
o
, must be
Et+1t ≤Et+max{f (T , λ)} =Et+F, (A6)
wheref (T , λ)is the term in squared brackets in Eq. (A4)
andF =max{f (T , λ)}. Therefore as long as Eq. (A5) is sat-isfied, the error always has an upper bound controlled solely by the discretization error. This is the condition for stability. But, becauseCi′is a function of time, an adaptive time step-ping scheme would be well suited to solve the problem. The adaptive time stepper would need to satisfy Eq. (A5) at each time step.
As long as the thermal energy balance component of our CA algorithm obeys the time stepping–spatial discretization relationship in Eq. (A5) it remains stable. For such time step control, using the Lax–Richtmeyer equivalence theorem, one only needs to show that the thermal module represents a con-sistent numerical approximation to the full diffusion equation (includingCi′to account for the freeze–thaw effect) in order to prove convergence of our method. To do this we note the following recurrence relations:
Et+1t ≤Et+F ≤Et−1t+2F ≤E0+(n+1)F, (A7) t=n1t.
It is worth noting that here we have assumed a constant value
ofF through all time steps. In the following we argue that
this does not affect the generality of the convergence analysis that follows next.
Clearly, if the only source of error in our approximate so-lution is the discretization of a continuous process, then our initial values must be error-free; i.e.E0=0. Therefore,
Et+1t ≤(n+1)F. (A8)
Now, from the definition off (T , λ)we have
f (T , λ)=
"
1 li
λi,i+1
Tit+1−Tit
li +
λi,i−1
Tit−1−Tit li
!
−Ci′T t+1t
i −T
t i 1t
#
1t Ci′.
For lim1t,li→0, we have the cluster of terms within the square brackets converge to the expression
∂ ∂z
λ(z)∂H ∂z
−C′∂T
∂t . (A10)
As T is an exact solution of the above diffusion-equation
form, we must have the terms within square bracket converge to 0 as lim1t,li →0. This argument for the boundedness of
F as1t,li→0 holds at each time step and, hence, would
have led to the same conclusion if we would have used a time
variable maximum value off (T , λ)in Eq. (A8). Therefore,
in general, at any timet
lim 1t,li→0
Et →0. (A11)
This formally shows that our numerical algorithm, with time stepping satisfying Eq. (A5), is consistent and hence follows the convergence of the thermal module.
We can construct a similar convergence analysis for the hydraulic module. But we will approach this problem from the continuum version of the modified Richard’s equation for variably saturated flow for the sake of brevity. The modified Richard’s equation for variably saturated flow can be written as (in the absence of a source term)
∂θw
∂t +
ρice ρw
∂θice
∂t =
∂ ∂z
k(z)∂H ∂z
. (A12)
The left-hand side of Eq. (A12) follows from the continuum version of the first term on the left-hand side of Eq. (5) where Eq. (6) has been used to eliminate2. The term on the right-hand side is the Darcy flux, introduced as the continuum ver-sion of Eq. (10) where the total headH=ψ+z. The effect of freeze–thaw on the total head can be accounted for as a Clausis–Clapeyron process as given in Eq. (12). To make this clear, we rewrite Eq. (A12) as follows:
∂θ
w
∂H +
ρice ρw
∂θice ∂T
∂T
∂H
∂H
∂t =
∂
∂z
k(z)∂H ∂z
. (A13)
We can make use of the following relations to eliminate tem-perature from Eq. (A13):
∂θice
∂T = −
Lf gT
∂θw
∂H, (A14)
∂T
∂H =
gT Lf
. (A15)
Therefore, we can rewrite Eq. (A12) finally as
1−ρice
ρw
Cw ∂H
∂t =
∂ ∂z
k(z)∂H ∂z
, (A16)
whereCw=∂θw/∂H|H=H (t ) is the local slope of the soil retention curve which can be derived from Eq. (7). Equa-tion (A16) now has the same form as the expression in Eq. (A10). It is immediately clear that, if one would have fol-lowed the full formal arguments as outlined for the thermal module, the condition for stability of the variably saturated flow dynamics part of our algorithm is of the form
1t≤l 2 iC′wi
¯
ki
, (A17)
whereCw′ =Cw(1−ρice/ρw)andk¯i=ki,i−1+ki,i+1. We re-fer the reader to Mendicino et al. (2006) for a thorough con-vergence analysis of the water flow problem. The formal ar-gument is exactly equivalent to that presented by us for the heat flow problem. Combining Eqs. (A5) and (A17), the fol-lowing condition gives stability and convergence conditions for the overall CA problem:
1t≤min l
2 iCw′i
¯
ki ,l
2 iCi′
¯
λi
!
Acknowledgements. We wish to acknowledge the financial support of the Natural Science and Engineering Research Council (NSERC) and BioChambers Inc. (MB, Canada) through a NSERC-CRD award, NSERC Strategic Projects grant, and the Canadian Foundation for Climate and Atmospheric Sciences (CFCAS) through an IP3 Research Network grant. The authors want to thank the contributions of Lalu Mansinha and Kristy Tiampo, in helping to improve the manuscript, and Jalpa Pal during different stages of this work.
Edited by: P. Hallett
References
Anderson, D. M. and Morgenstern, N. R.: Physics, chemistry, and mechanics of frozen ground: A review, in: Proceedings Sec-ond International Conference on Permafrost, Yakutsk, U.S.S.R., North American Contribution, US National Academy of Sci-ences, Washington, DC, 1973.
Brunner, P. and Simmons, C. T.: HydroGeoSphere: A fully inte-grated, physically based hydrological model, Groundwater, 50, 170–176, 2012.
Campbell, G. S.: Soil physics with BASIC: Transport models for soil-plant systems, Elsevier, New York, 1985.
Cervarolo, G., Mendicino, G., and Senatore, A.: A coupled ecohydrological–three-dimensional unsaturated flow model de-scribing energy, H2O and CO2fluxes, Ecohydrol., 3, 205–225,
2010.
Churchill, R. V.: Operational mathematics, McGraw-Hill Compa-nies, New York, 1972.
Daanen, R. P., Misra, D., and Epstein, H.: Active-layer hydrology in nonsorted circle ecosystems of the arctic tundra, Vadose Zone J., 6, 694–704, 2007.
Dall’Amico, M., Endrizzi, S., Gruber, S., and Rigon, R.: A robust and energy-conserving model of freezing variably-saturated soil, The Cryosphere, 5, 469–484, doi:10.5194/tc-5-469-2011, 2011. Dash, J. G., Fu, H., and Wettlaufer, J. S.: The premelting of ice and
its environmental consequences, Rep. Prog. Phys., 58, 116–167, 1995.
Engelmark, H. and Svensson, U.: Numerical modeling of phase-change in freezing and thawing unsaturated soil, Nord. Hydrol., 24, 95–110, 1993.
Hansson, K. and Lundin, L. C.: Equifinality and sensitivity in freez-ing and thawfreez-ing simulations of laboratory and in situ data, Cold Reg. Sci. Technol., 44, 20–37, 2006.
Hansson, K., Simunek, J., Mizoguchi, M., Lundin, L. C., and van Genuchten, M. T.: Water flow and heat transport in frozen soil: Numerical solution and freeze-thaw applications, Vadose Zone J., 3, 693–704, 2004.
Hayashi, M., Goeller, N., Quinton, W. L., and Wright, N.: A simple heat-conduction method for simulating the frost-table depth in hydrological models, Hydrol. Process., 21, 2610–2622, 2007. Hoekstra, A. G., Kroc, J., and Sloot, P. M. A.: Introduction to
mod-eling of complex systems using cellular automata, in: Simulating complex systems by cellular automata, edited by: Kroc, J., Sloot, P. M. A., and Hoekstra, A. G., Springer, Berlin, 2010.
Hutt, M. T. and Neff, R.: Quantification of spatiotemporal phenom-ena by means of cellular automata techniques, Phys. A, 289, 498–516, 2001.
Ilachinski, A.: Cellular automata: A discrete universe, World Scien-tific Publishing Company, Singapore, 2001.
Johansen, O.: Thermal conductivity of soils, Cold Regions Research and Engineering Laboratory, Trond-Heim (Norway), 1975. Kollet, S. J. and Maxwell, R. M.: Integrated surface–groundwater
flow modeling: A free-surface overland flow boundary condition in a parallel groundwater flow model, Adv. Water Res., 7, 945– 958, 2006.
Low, P. F., Anderson, D. M., and Hoekstra, P.: Some thermody-namic relationships for soils at or below freezing point. 1. Freez-ing point depression and heat capacity, Water Resour. Res., 4, 379–394, 1968.
Lunardini, V. J.: Freezing of soil with phase change occurring over a finite temperature difference, in: Freezing of soil with phase change occurring over a finite temperature difference, 4th inter-national offshore mechanics and arctic engineering symposium, ASM, 1985.
McKenzie, J. M., Voss, C. I., and Siegel, D. I.: Groundwater flow with energy transport and water-ice phase change: Numerical simulations, benchmarks, and application to freezing in peat bogs, Adv. Water Resour., 30, 966–983, 2007.
Mendicino, G., Senatore, A., Spezzano, G., and Straface, S.: Three-dimensional unsaturated flow modeling using cellular automata, Water Resour. Res., 42, W11419, doi:10.1029/2005WR004472, 2006.
Mizoguchi, M.: Water, heat and salt transport in freezing soil, Uni-versity of Tokyo, Tokyo, 1990.
Nagare, R. M., Schincariol, R. A., Quinton, W. L., and Hayashi, M.: Effects of freezing on soil temperature, freezing front prop-agation and moisture redistribution in peat: laboratory investiga-tions, Hydrol. Earth Syst. Sci., 16, 501–515, doi:10.5194/hess-16-501-2012, 2012.
Painter, S.: Three-phase numerical model of water migration in par-tially frozen geological media: Model formulation, validation, and applications, Comput. Geosci., 1, 69–85, 2011.
Parsons, J. A. and Fonstad, M. A.: A cellular automata model of surface water flow, Hydrol. Process., 21, 2189–2195, 2007. Quinton, W. L. and Hayashi, M.: Recent advances toward
physically-based runoff modeling of the wetland-dominated cen-tral Mackenzie River basin, in: Cold region atmospheric and hy-drologic studies. The Mackenzie GEWEX experience: Volume 2: Hydrologic processes, edited by: Woo, M., Springer, Berlin, 2008.
Smerdon, B. D. and Mendoza, C. A.: Hysteretic freezing character-istics of riparian peatlands in the western boreal forest of Canada, Hydrol. Process., 24, 1027–1038, 2010.
Stähli, M. and Stadler, D.: Measurement of water and solute dy-namics in freezing soil columns with time domain reflectometry, J. Hydrol., 195, 352–369, 1997.
Stallman, R. W.: Steady 1-dimensional fluid flow in a semi-infinite porous medium with sinusoidal surface temperature, J. Geophys. Res., 70, 2821–2827, 1965.
Mathematisch-Naturwissen-schaftliche Klasse, Abteilung 2, Mathematik, Astronomie, Physik, Meteorologie und Technik, 98, 965–983, 1889. Van Genuchten, M. T.: A closed-form equation for predicting the
hydraulic conductivity of unsaturated soils, Soil Sci. Soc. Am. J., 44, 892–898, 1980.